Paddy’s growth and development model, and economic value of farming system
Agriculture is one of the important sectors in Indonesia so that the various efforts related to development in agriculture continues to be done, especially paddy. This study aims to create algorithms and design of programs for simulating the growth and development of paddy and presented spatially. The approach of this study were divided into three parts. First is to compile a database of weather and economic calculations are used as input application system, the second is to integrate numerical and spatial models. And the third is to develop Graphical User Interface (GUI). Numerical model developed is the growth, development and economic.
Growth model simulates the flow of biomass to leaves, stems, roots and seeds as well as the loss of respiration. Added total biomass is a function of efficiency on the use and amount of solar radiation intercepted.
Development model describes the development phase of each plant phenological events suspected based on the concept of heat units. Based on the concept of heat units, plant development phase will change from one phase to the next phase if the plant has reached a certain accumulation of heat units.
Economic analysis was done by seeing Benefit Cost Ratio (B/C), activities that benefit the farm system will have a B/C > 1.0, and the Break Event Point (BEP). For the government and related agencies, the resulting output is expected to be useful for the determination of agricultural development policy. As for farmers, is expected to help the timing of planting in order to obtain optimum production and profit.
About the model
Shierary-Rice
Shierary-Rice crop simulation model was first developed by Handoko (1998), the goal is to estimate the potential production of paddy in Indonesia. The development of crop simulation model with daily resolution, especially for paddy can not be separated from the state of the weather, because these elements provide a major influence on plant growth and development phase that requires the input of daily weather data including maximum and minimum temperature, humidity, solar radiation, wind speed (Handoko 1994).
The use of Shierary-Rice model usually intended more paddy which made the source of water from rain or irrigation. This model consists of four main sub-sub-model development models, sub models of growth, water balance sub-model and sub models of nitrogen availability. In this study, Shierary-Rice simulation model was adopted and developed from a single point into the region and the results are presented spatially.
Growth model
Growth model simulates the flow of biomass to leaves, stems, roots and seeds as well as the loss of respiration. Model calculates the increment of biomass growth based on solar radiation interception and crop water availability. Solar radiation interception (Qint) calculated from data of solar radiation (Qs) and leaf area index (LAI). The amount of biomass of photosynthesis is shared between vegetative and generative organs (seeds) based on the phase of plant development. Added total biomass is a function of the efficiency of the use of solar radiation and the amount of solar radiation is intercepted. Some of these biomass will be used in the process of respiration. Respiration rate is calculated based on the weight of each plant organ (roots, stems, leaves and seeds) and temperature are represented in the form of temperature quotient.
Development model
Model describing the development phase of development of plants from each of the phenological events suspected based on the concept of heat units. Based on this concept, the rate of plant growth occurs when the average daily temperature exceeds the base temperature. Base temperature is the minimum temperature required by a plant to grow to accumulate heat units. Base temperature for each plant will be different, for paddy to be used in the model used base temperature of 15 °C. Based on the concept of heat units, plant development phase will change from one phase to the next phase if the plant has reached a certain accumulation of heat units. For example, for certain varieties of paddy will reach the phase of maximum shoots after accumulating heat units of 750 HU.
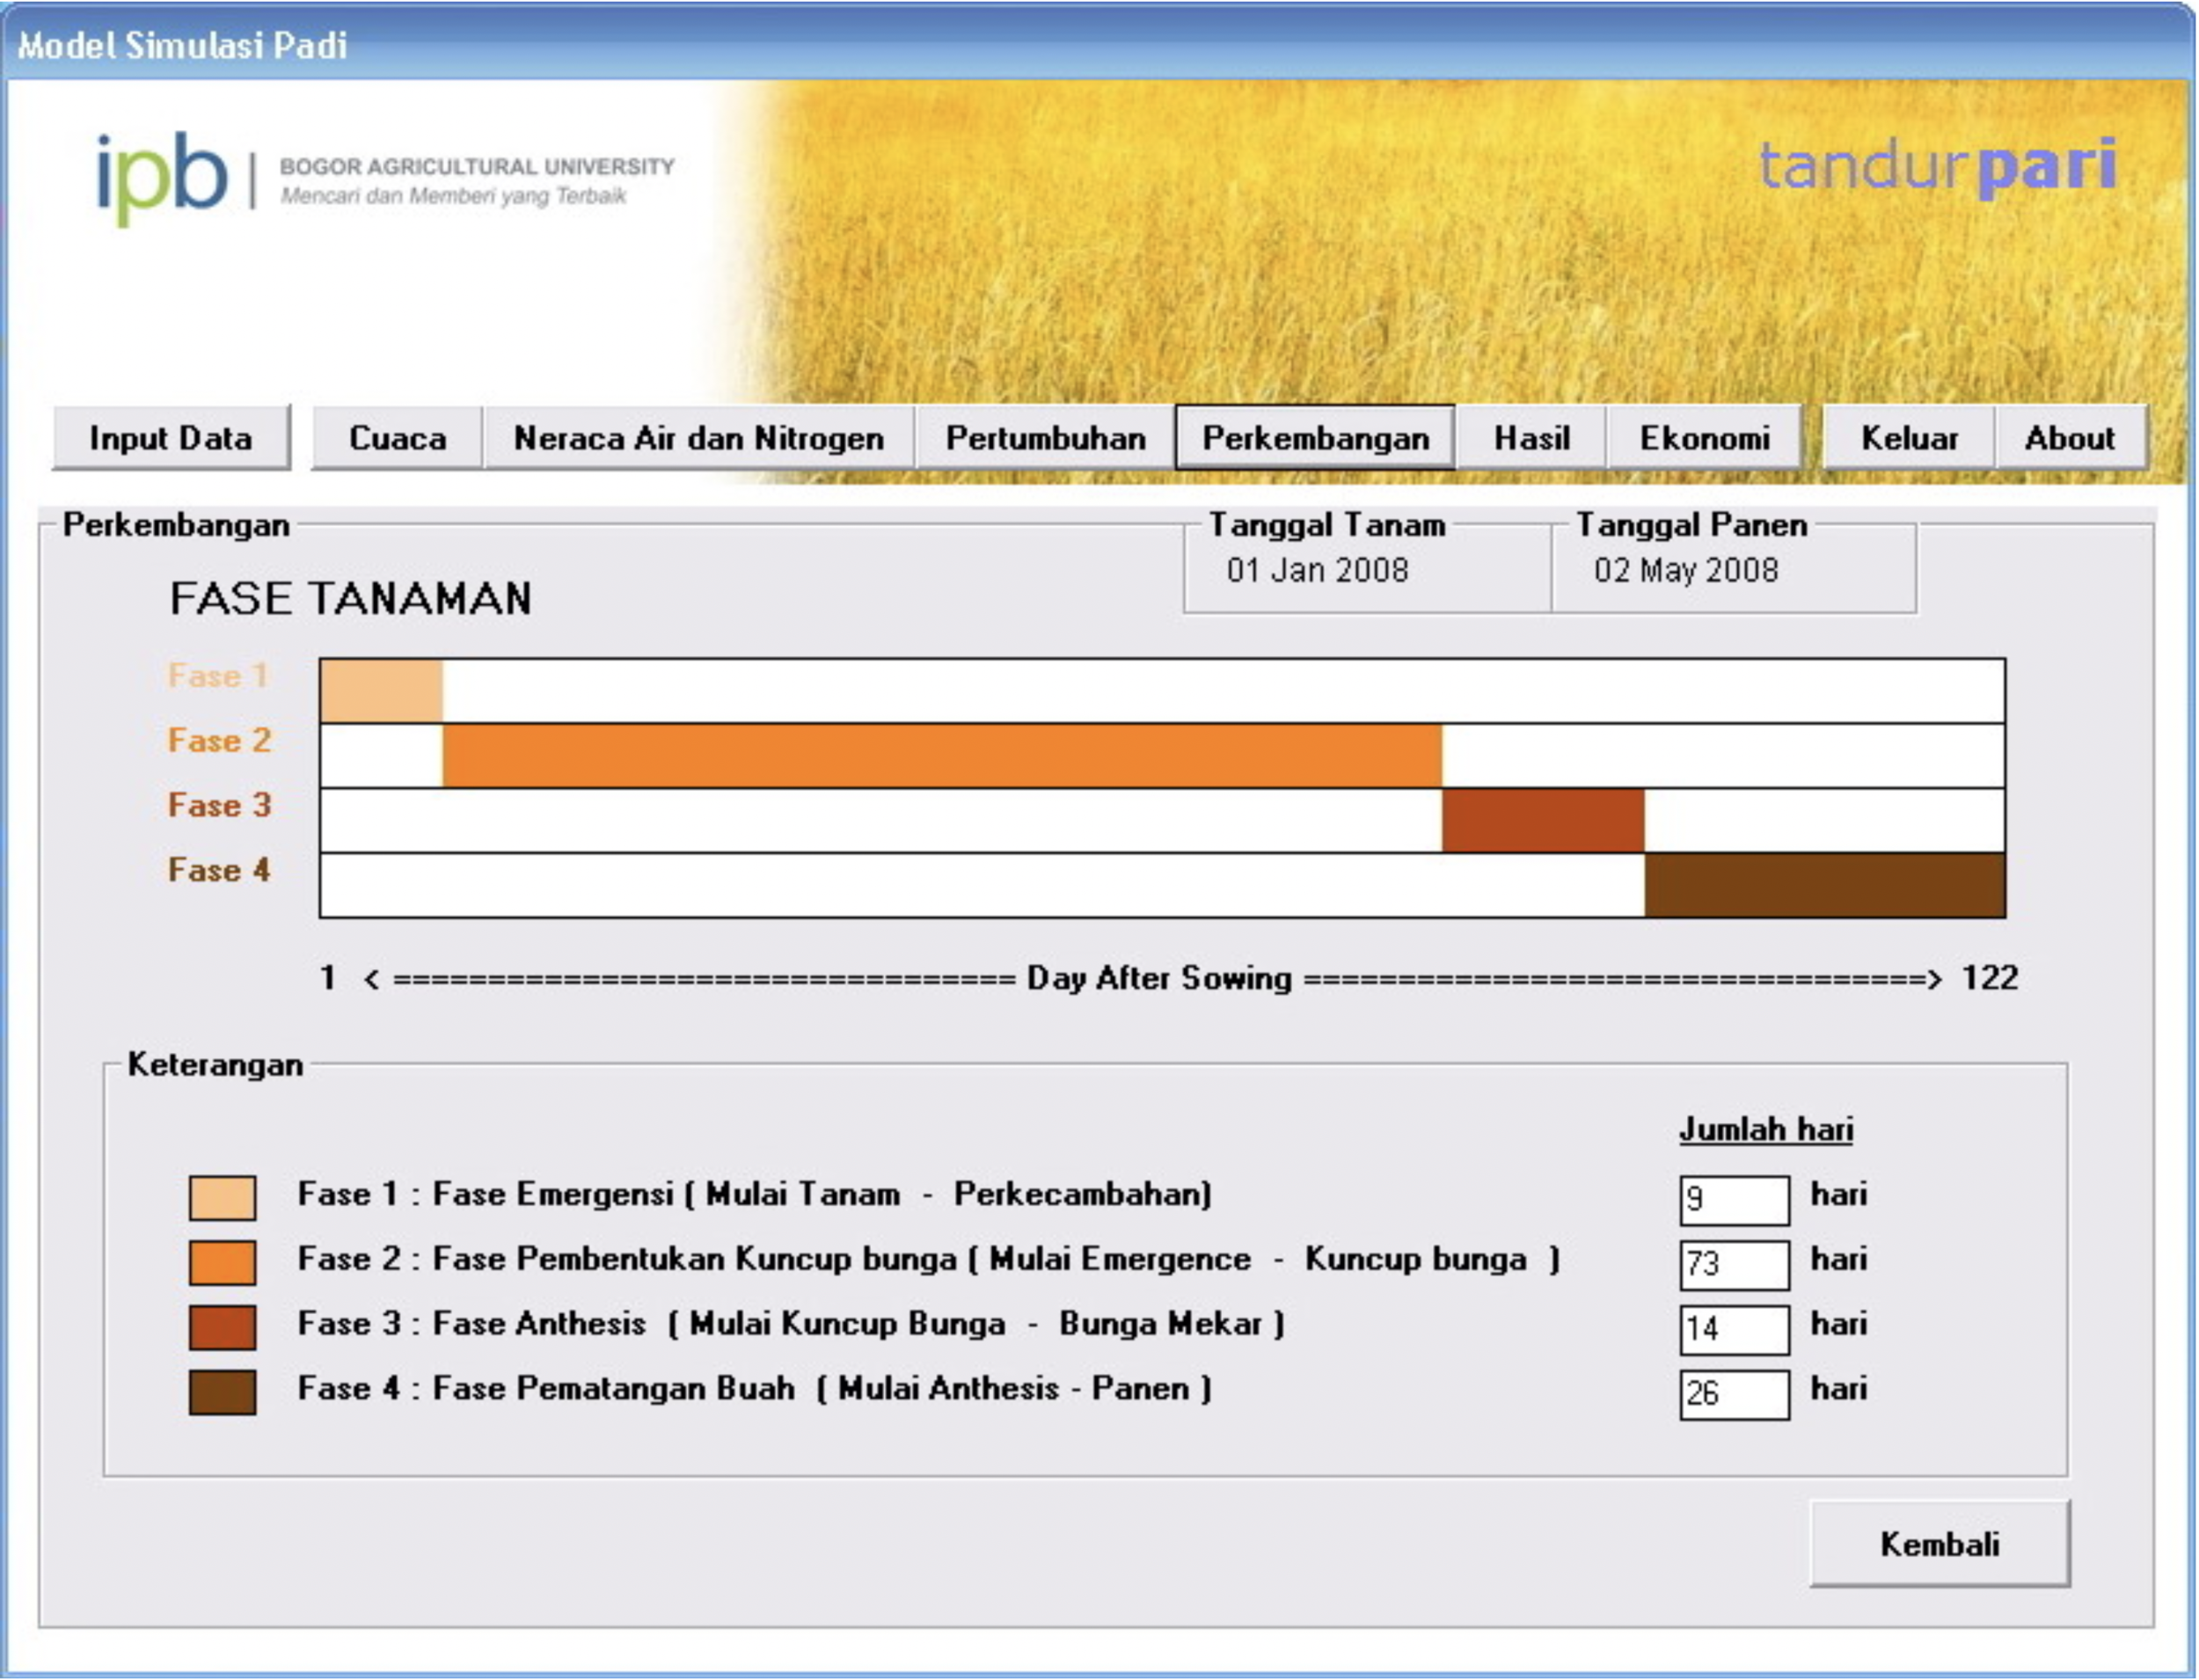
In general, the paddy phenological events began to be deployed to harvest given the scale of 0-1. The scale is divided into four events, namely seedling (s = 0.0), planting (0.25), maximum shoots (0.50), flowering (s = 0.75) and physiologically mature (s = 1.0).
Economic value model
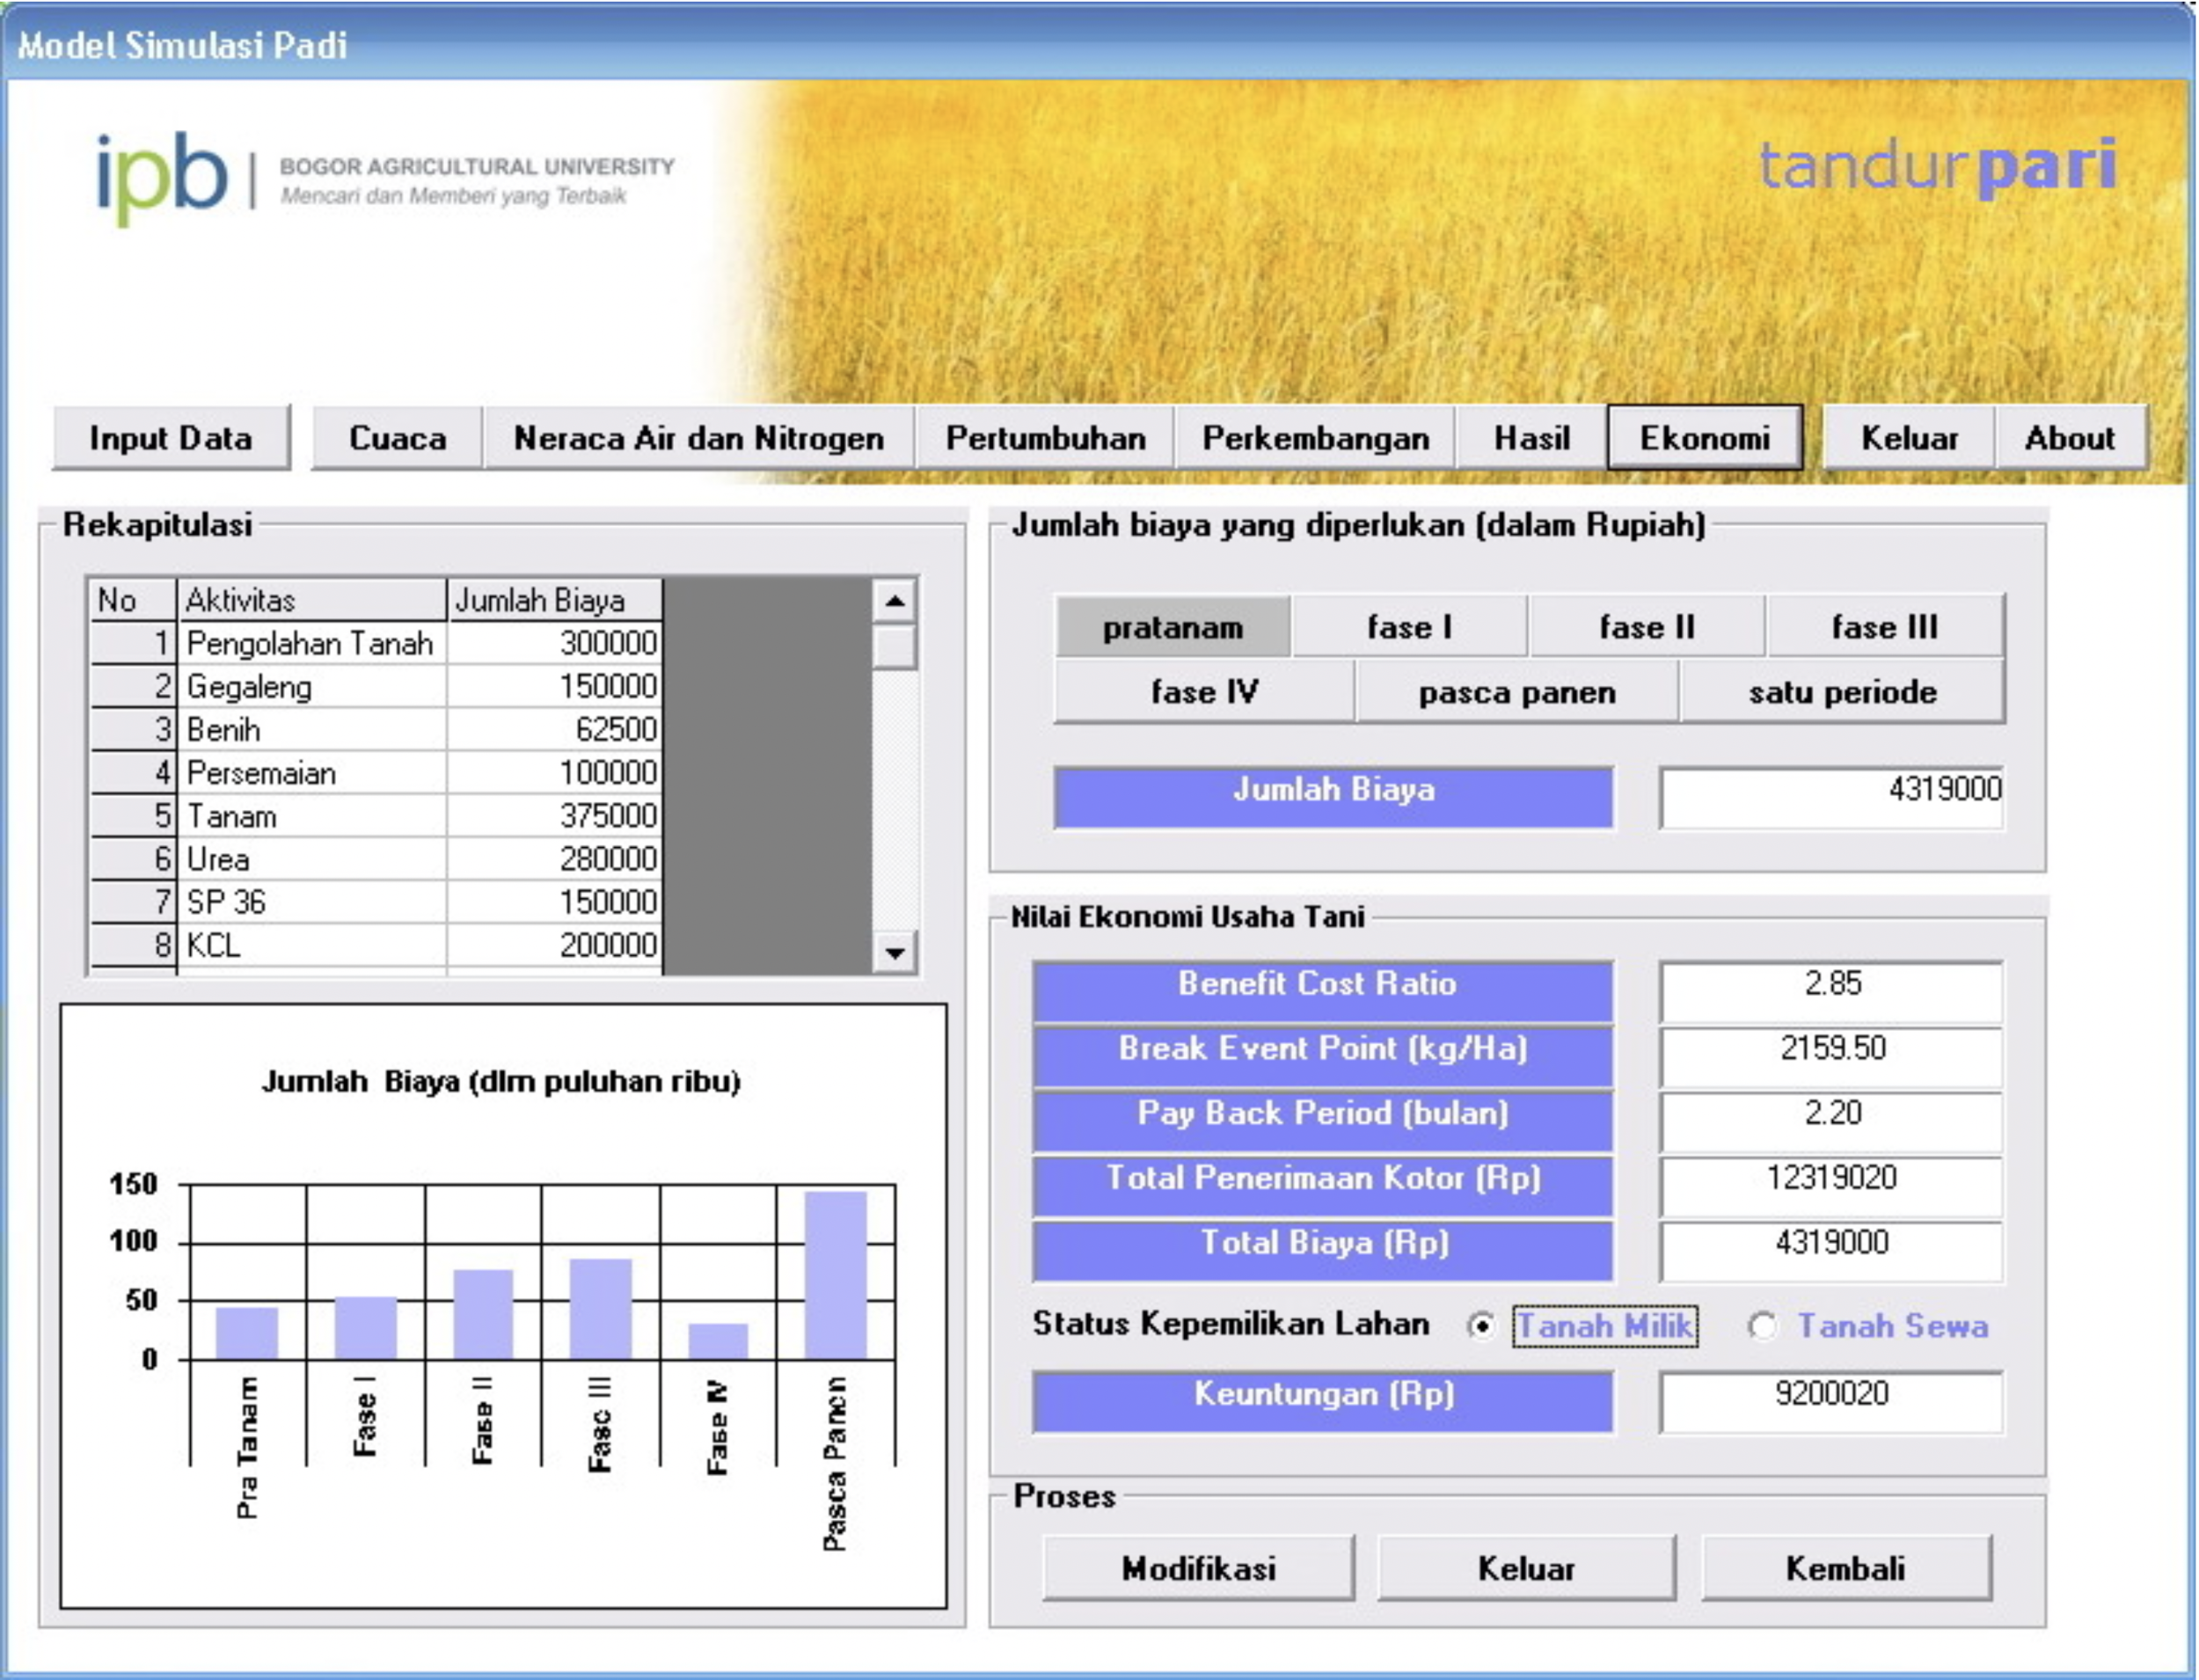
This model was calculated on the basis of survey data needs and cost per hectare of paddy crop. Economic analysis of paddy farming is done by seeing Benefit Cost Ratio (B/C), activities that benefit the farm system will have a B/C > 1.0, and the Break Event Point (BEP).
- B/C = (Planting area * Production * grain prices)/Cost
- BEP = Cost/(Planting area * Production)
Application
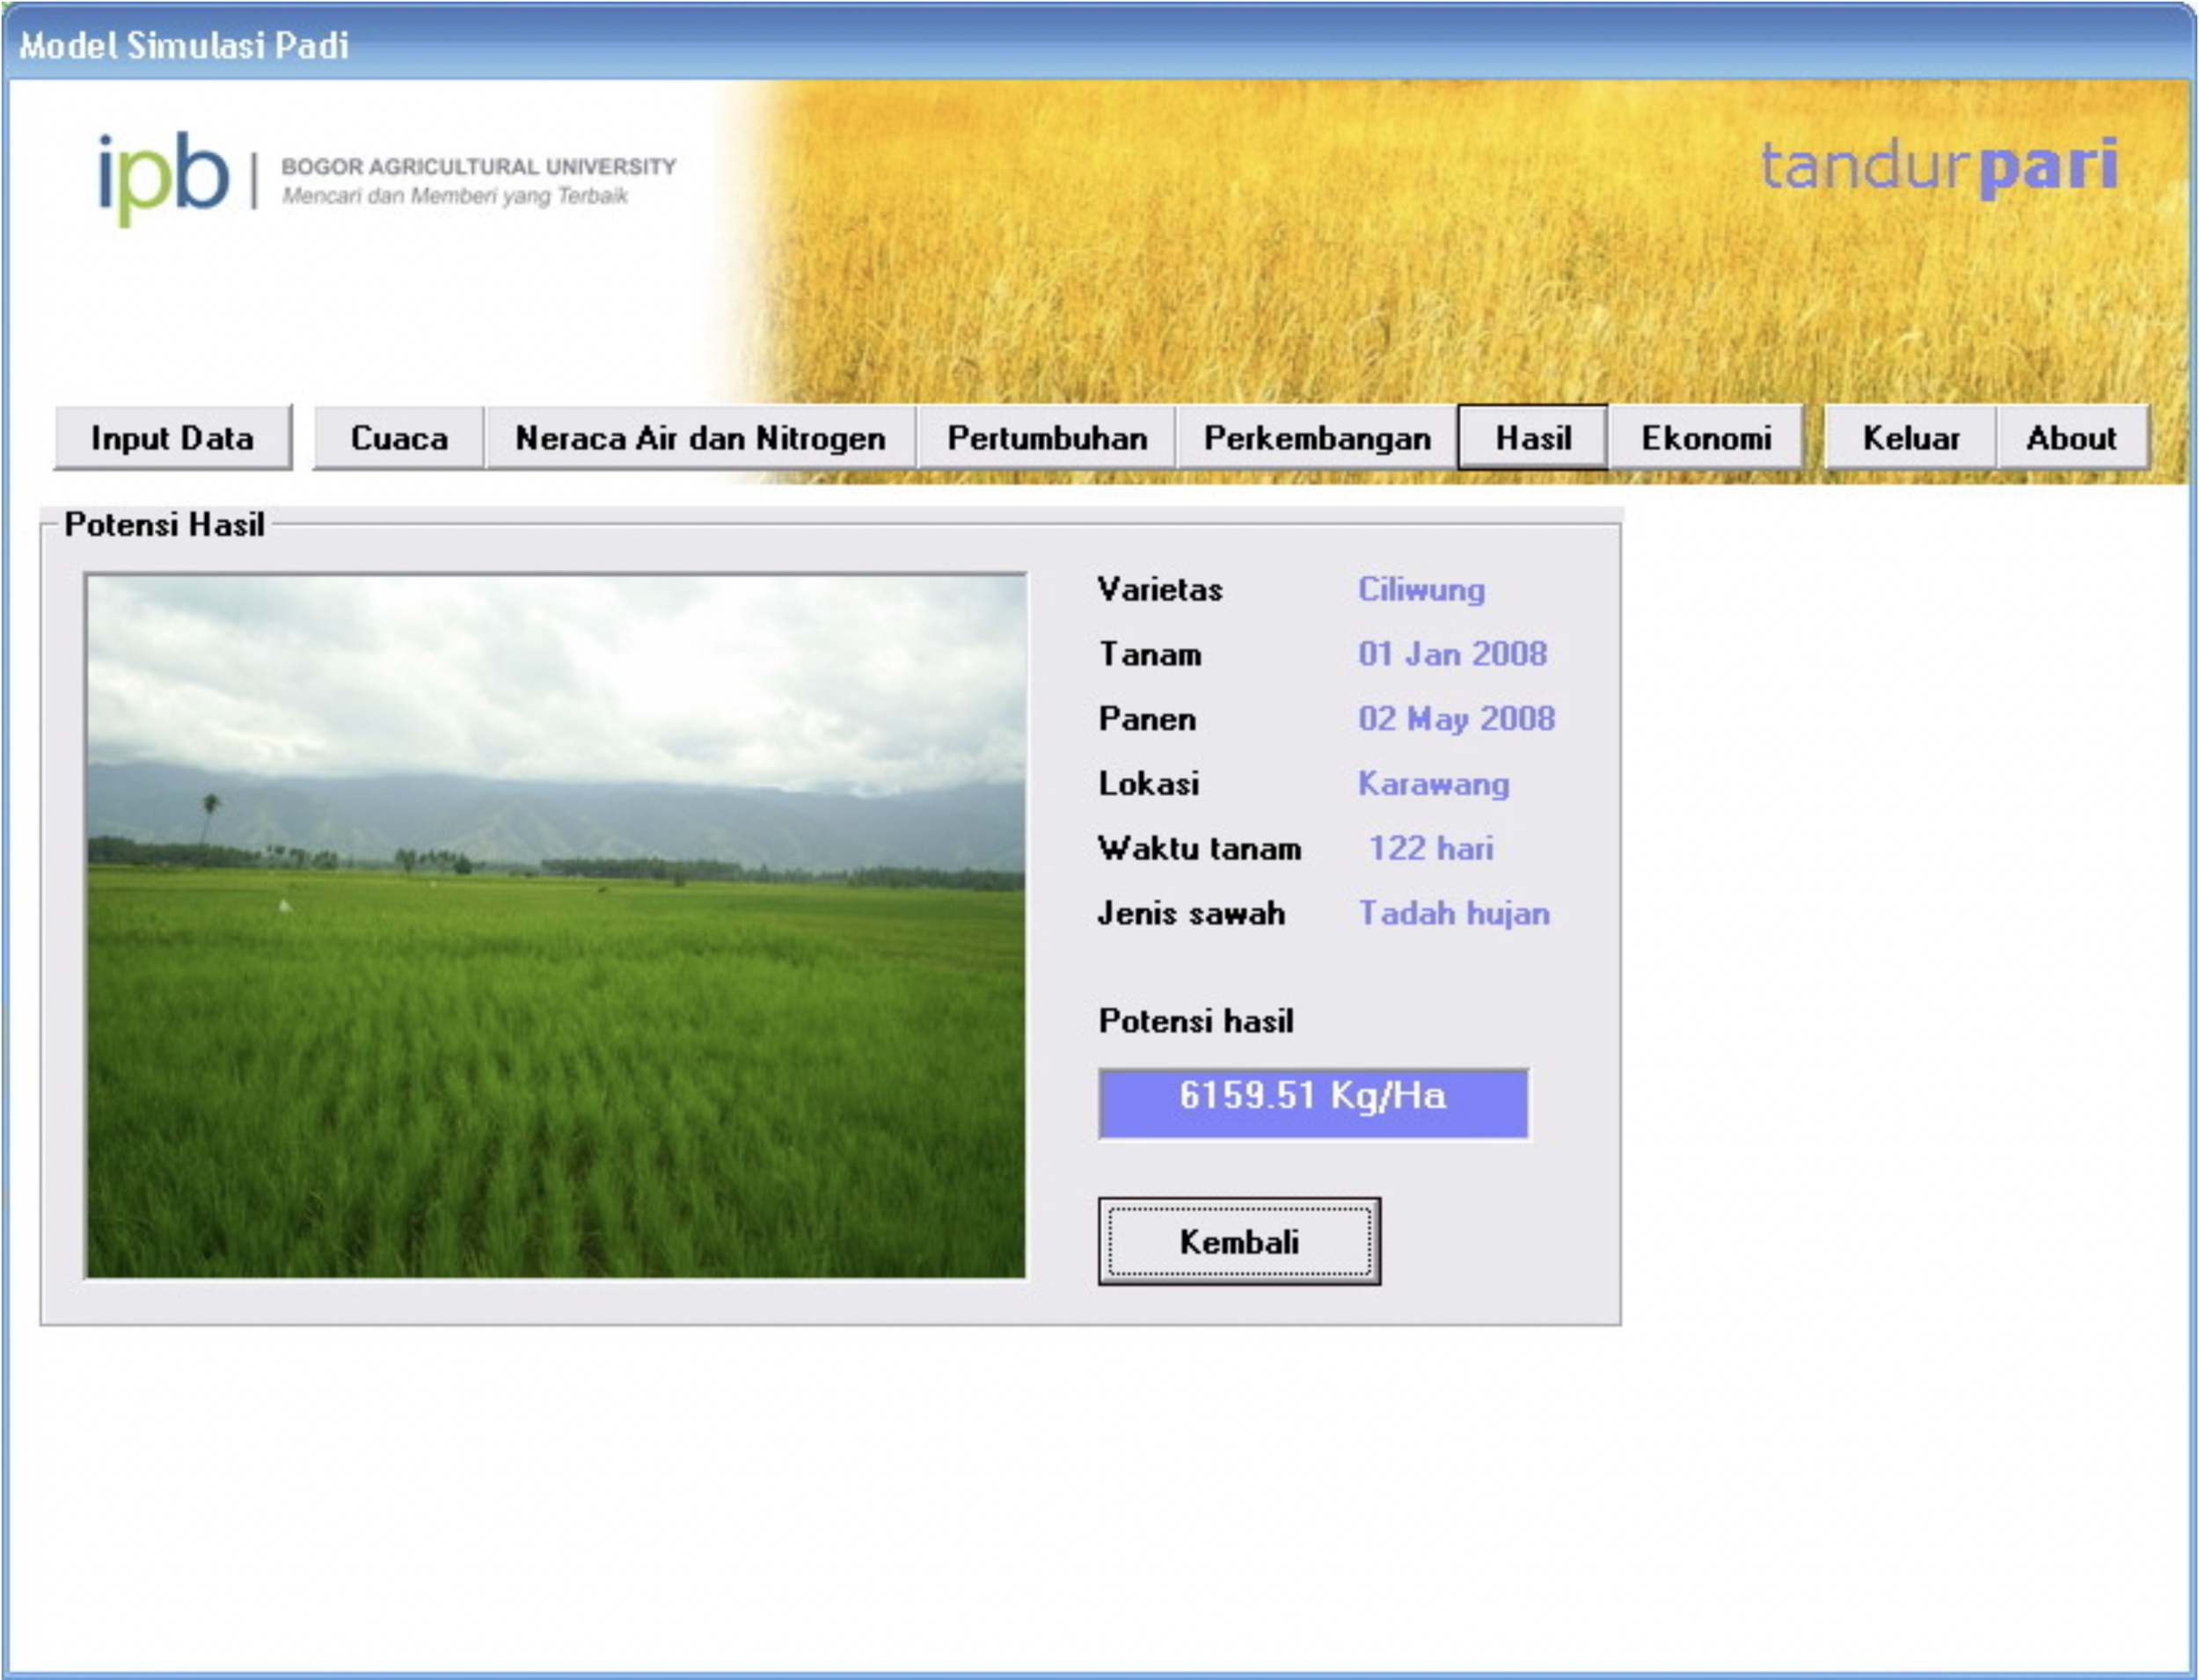
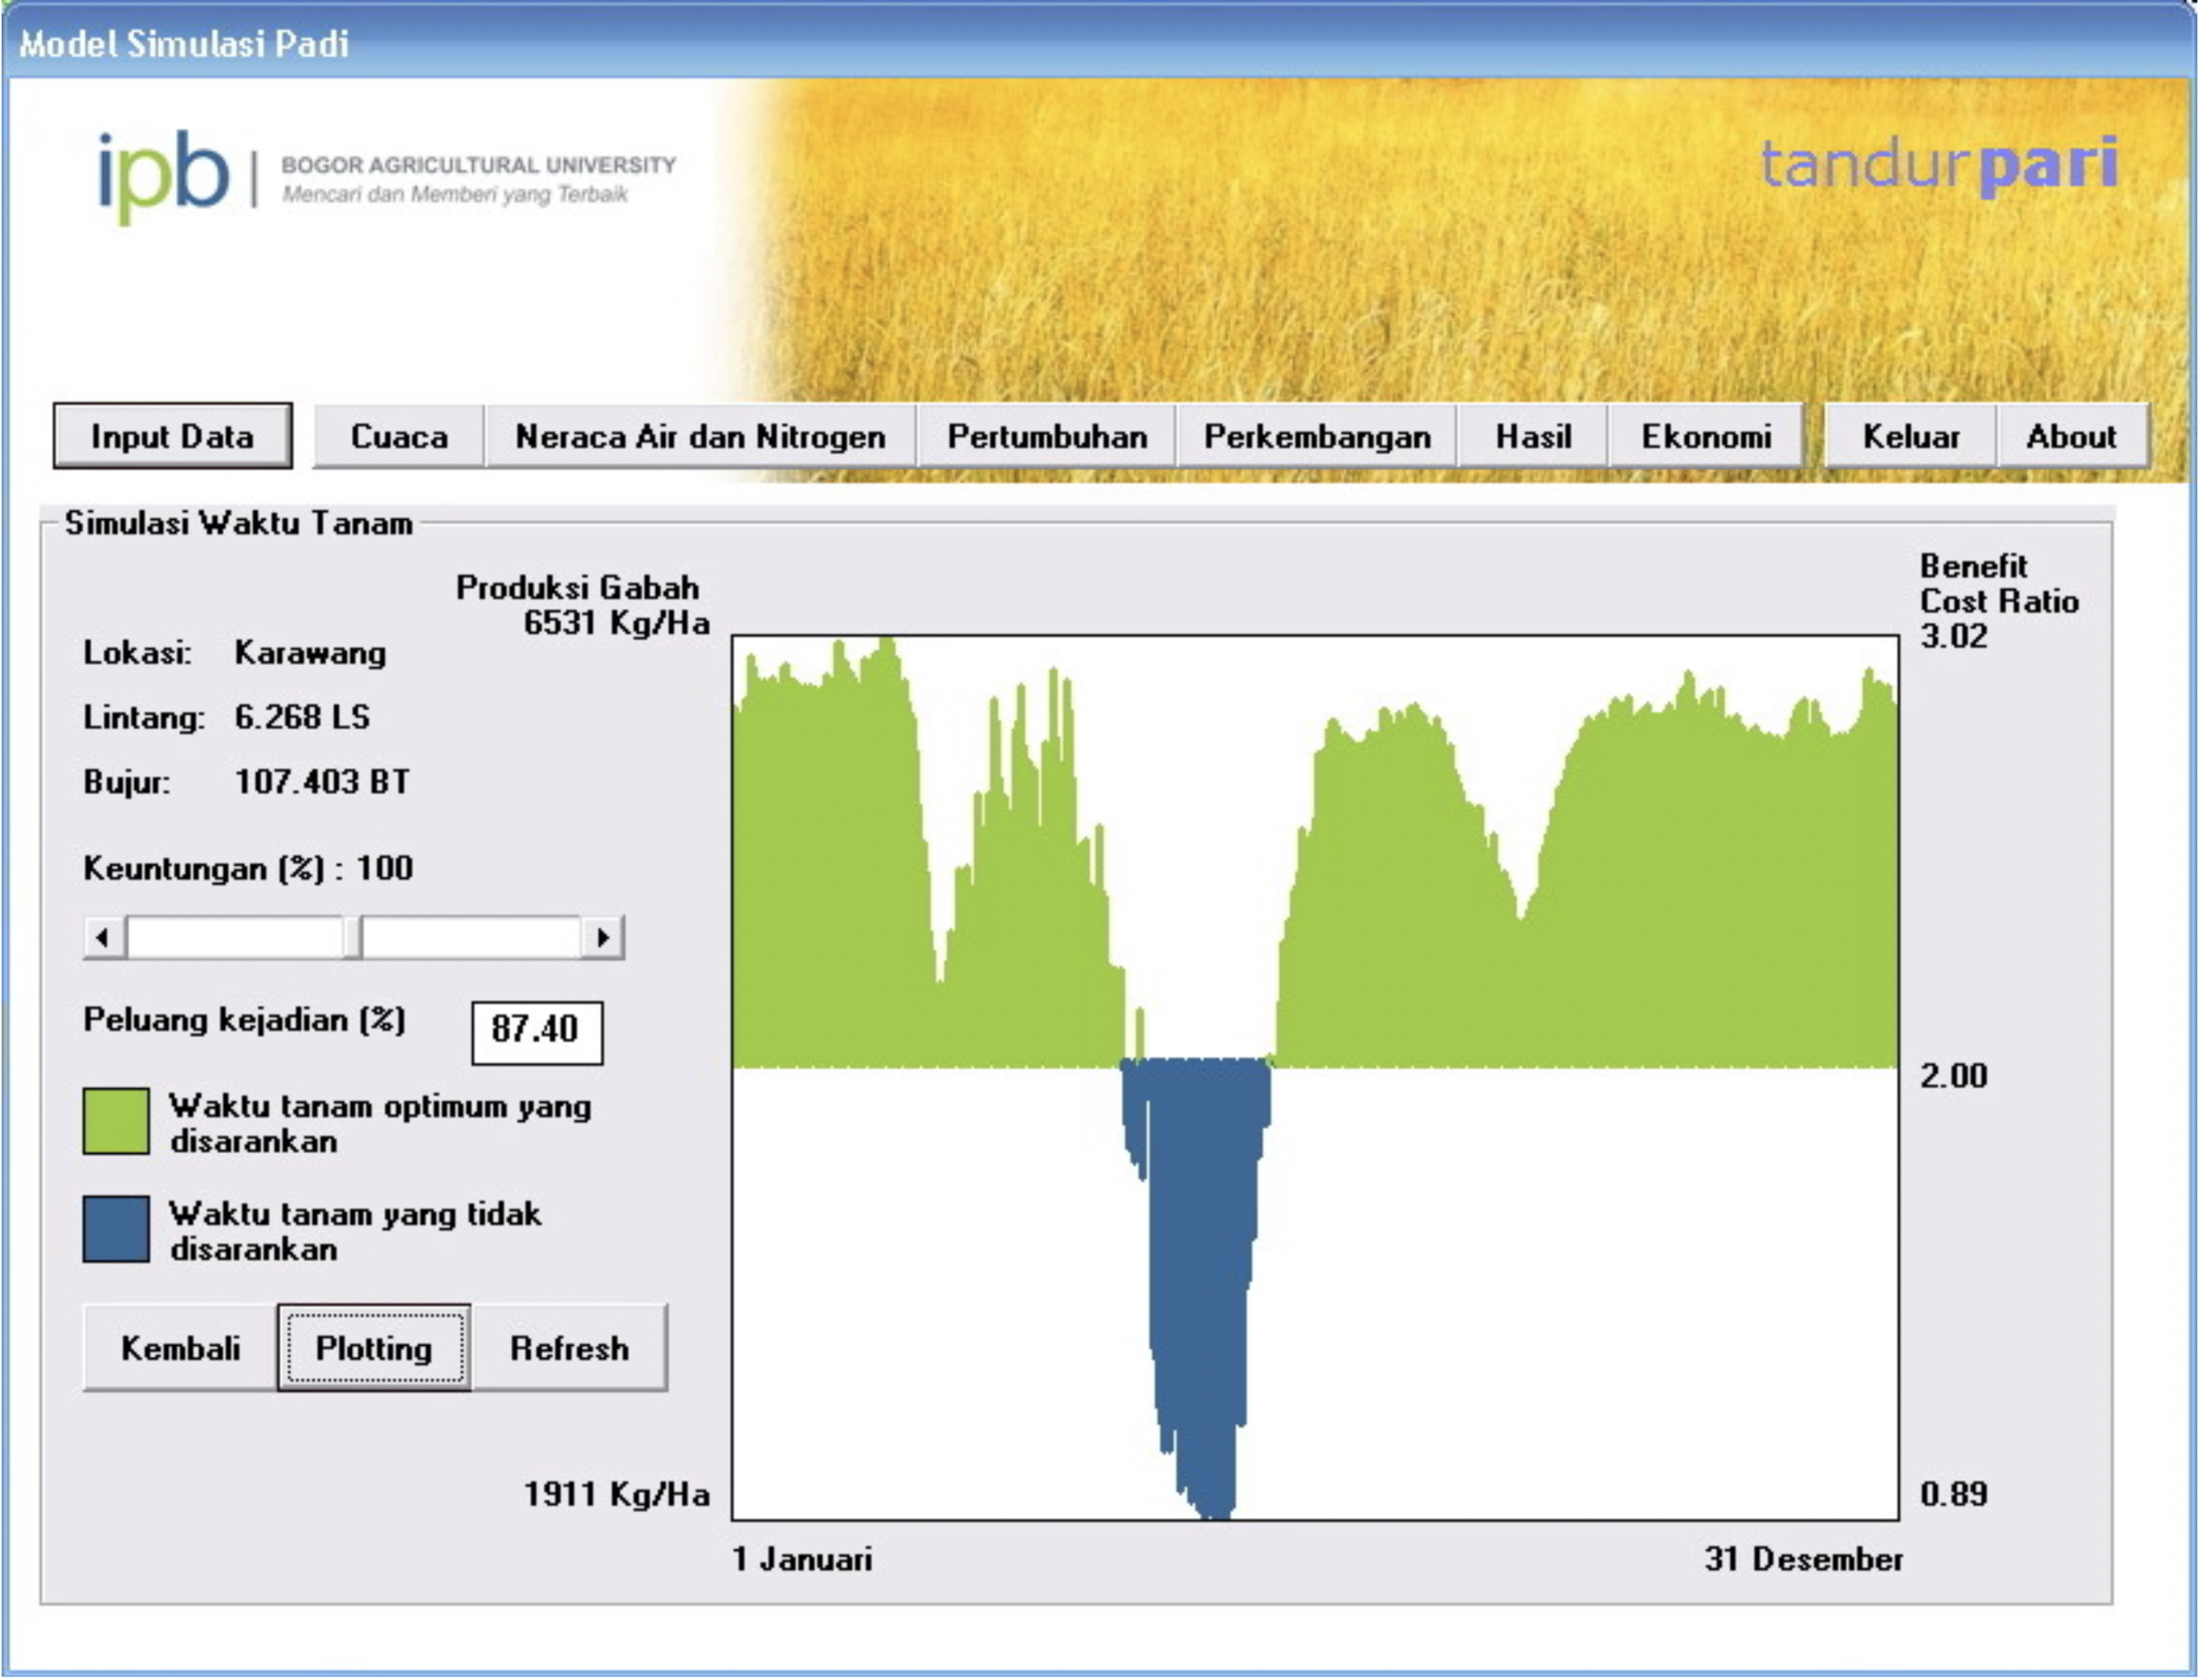
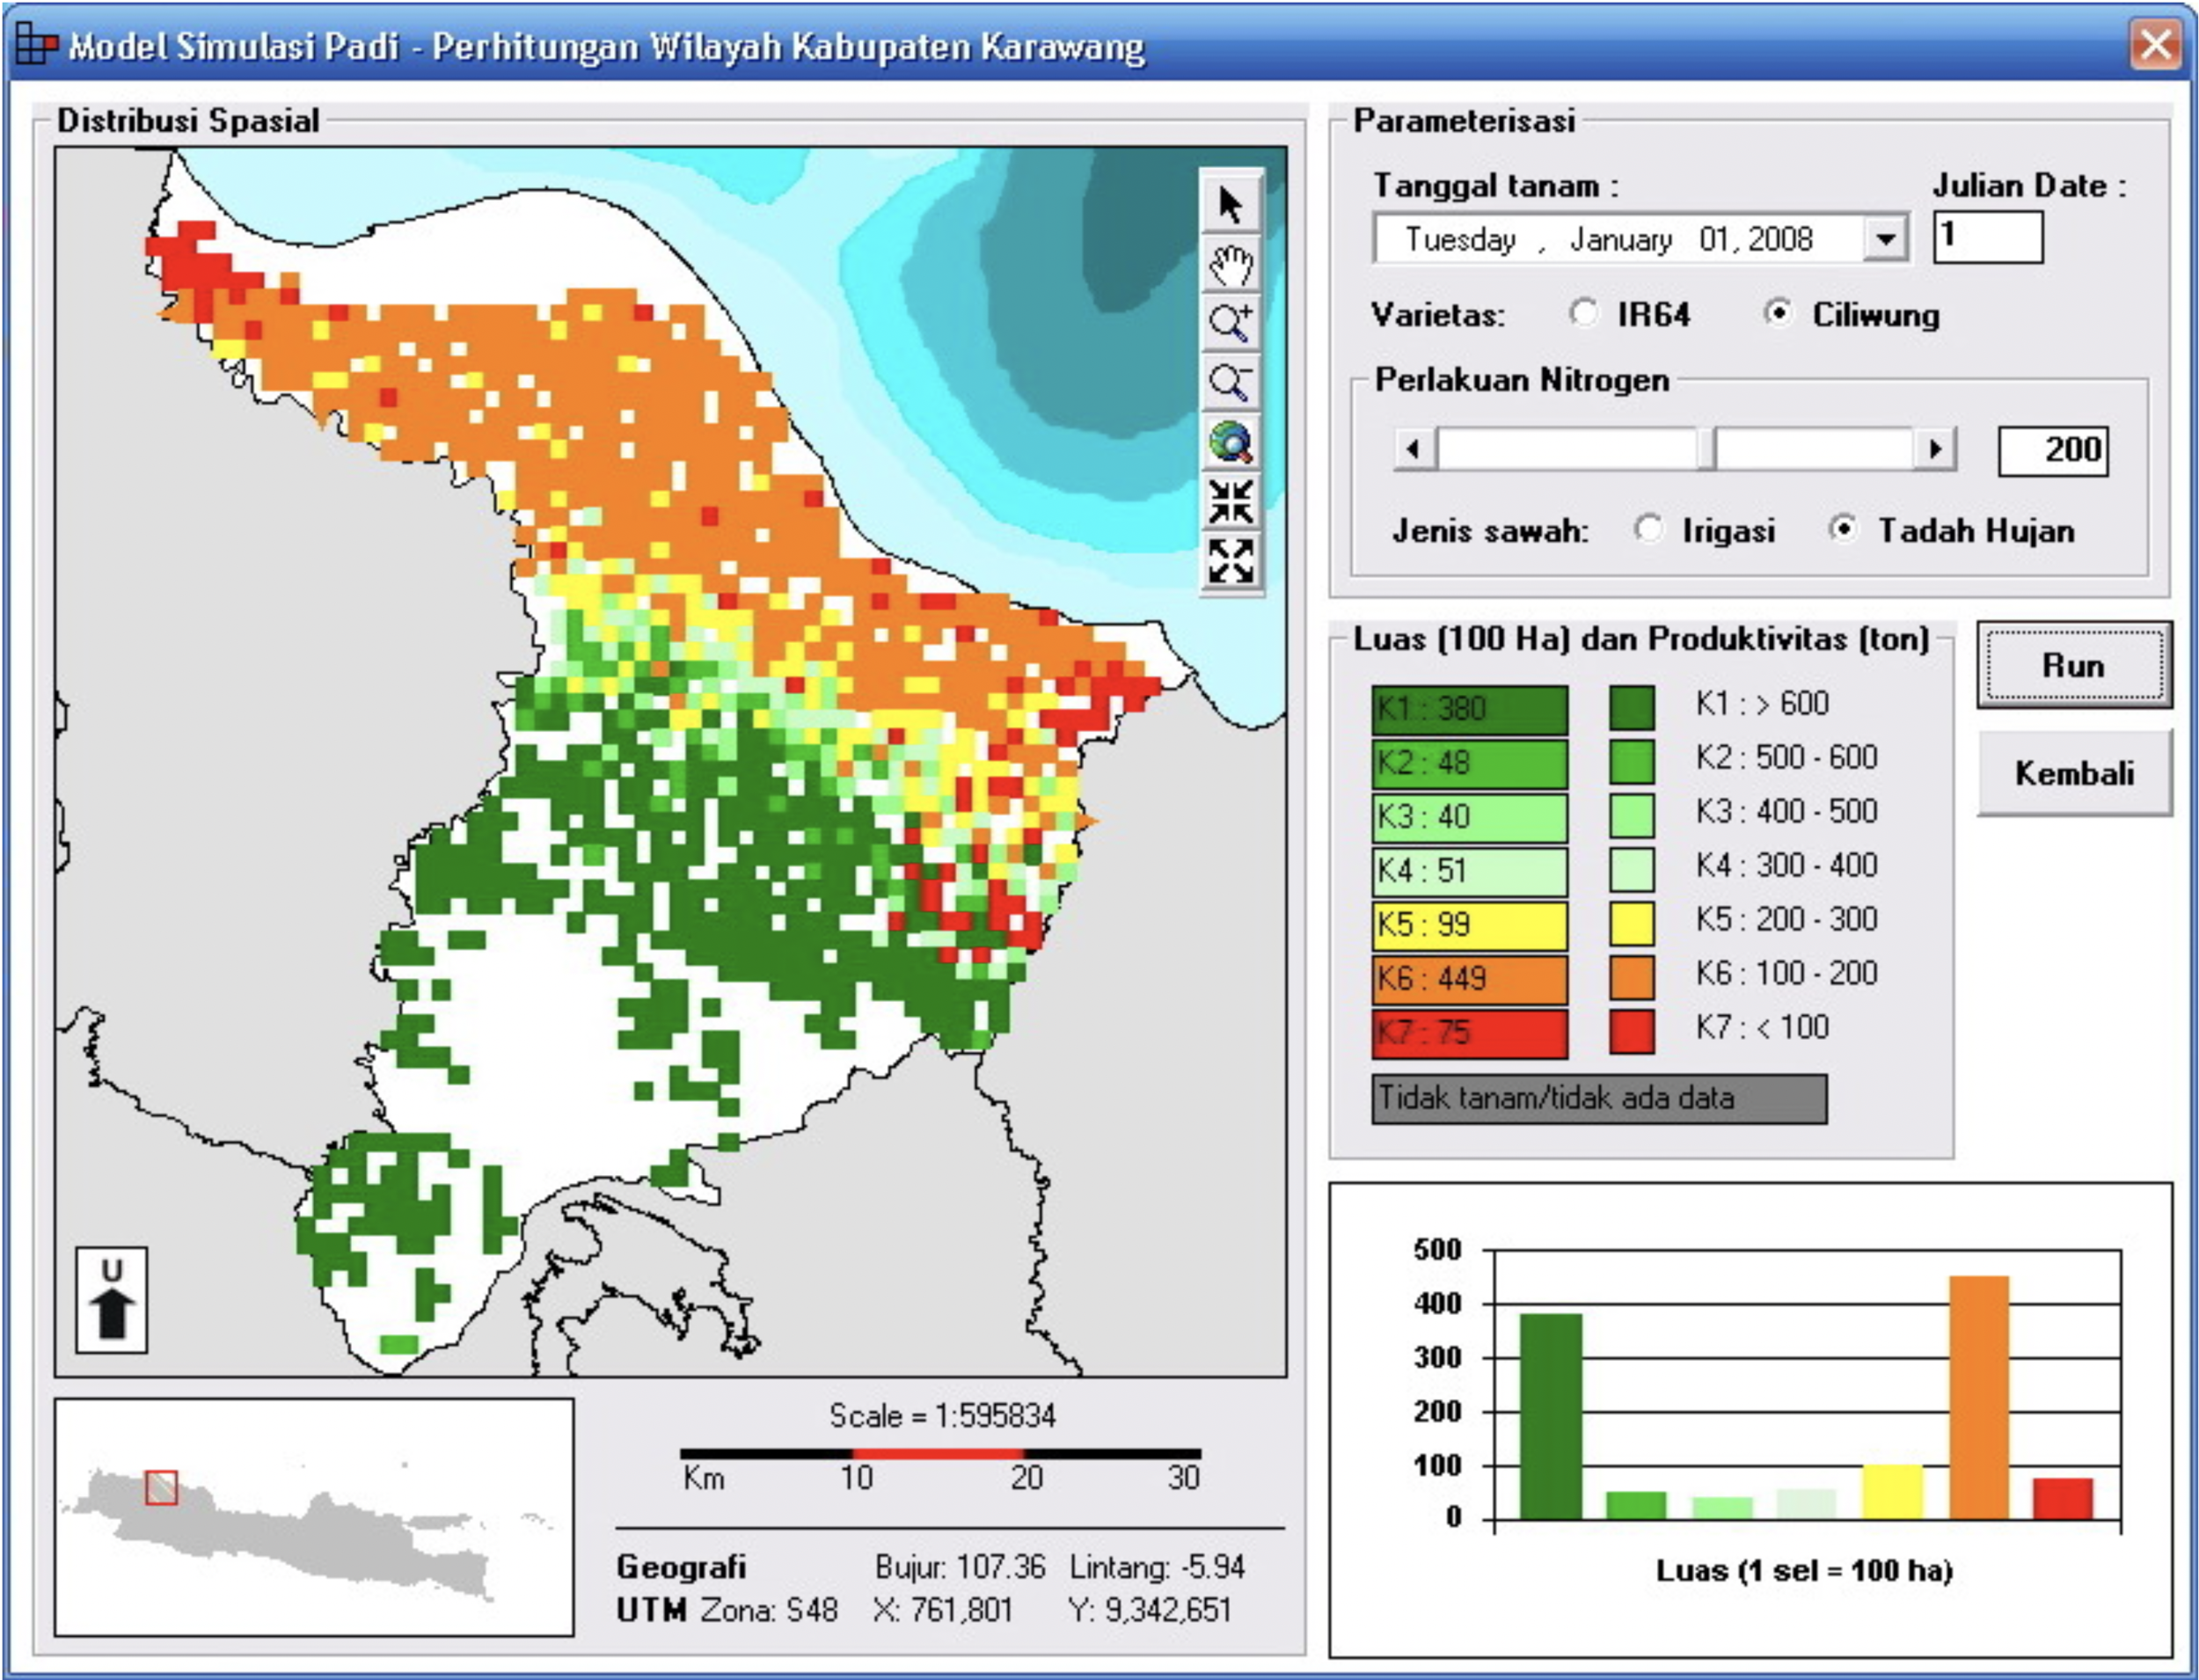
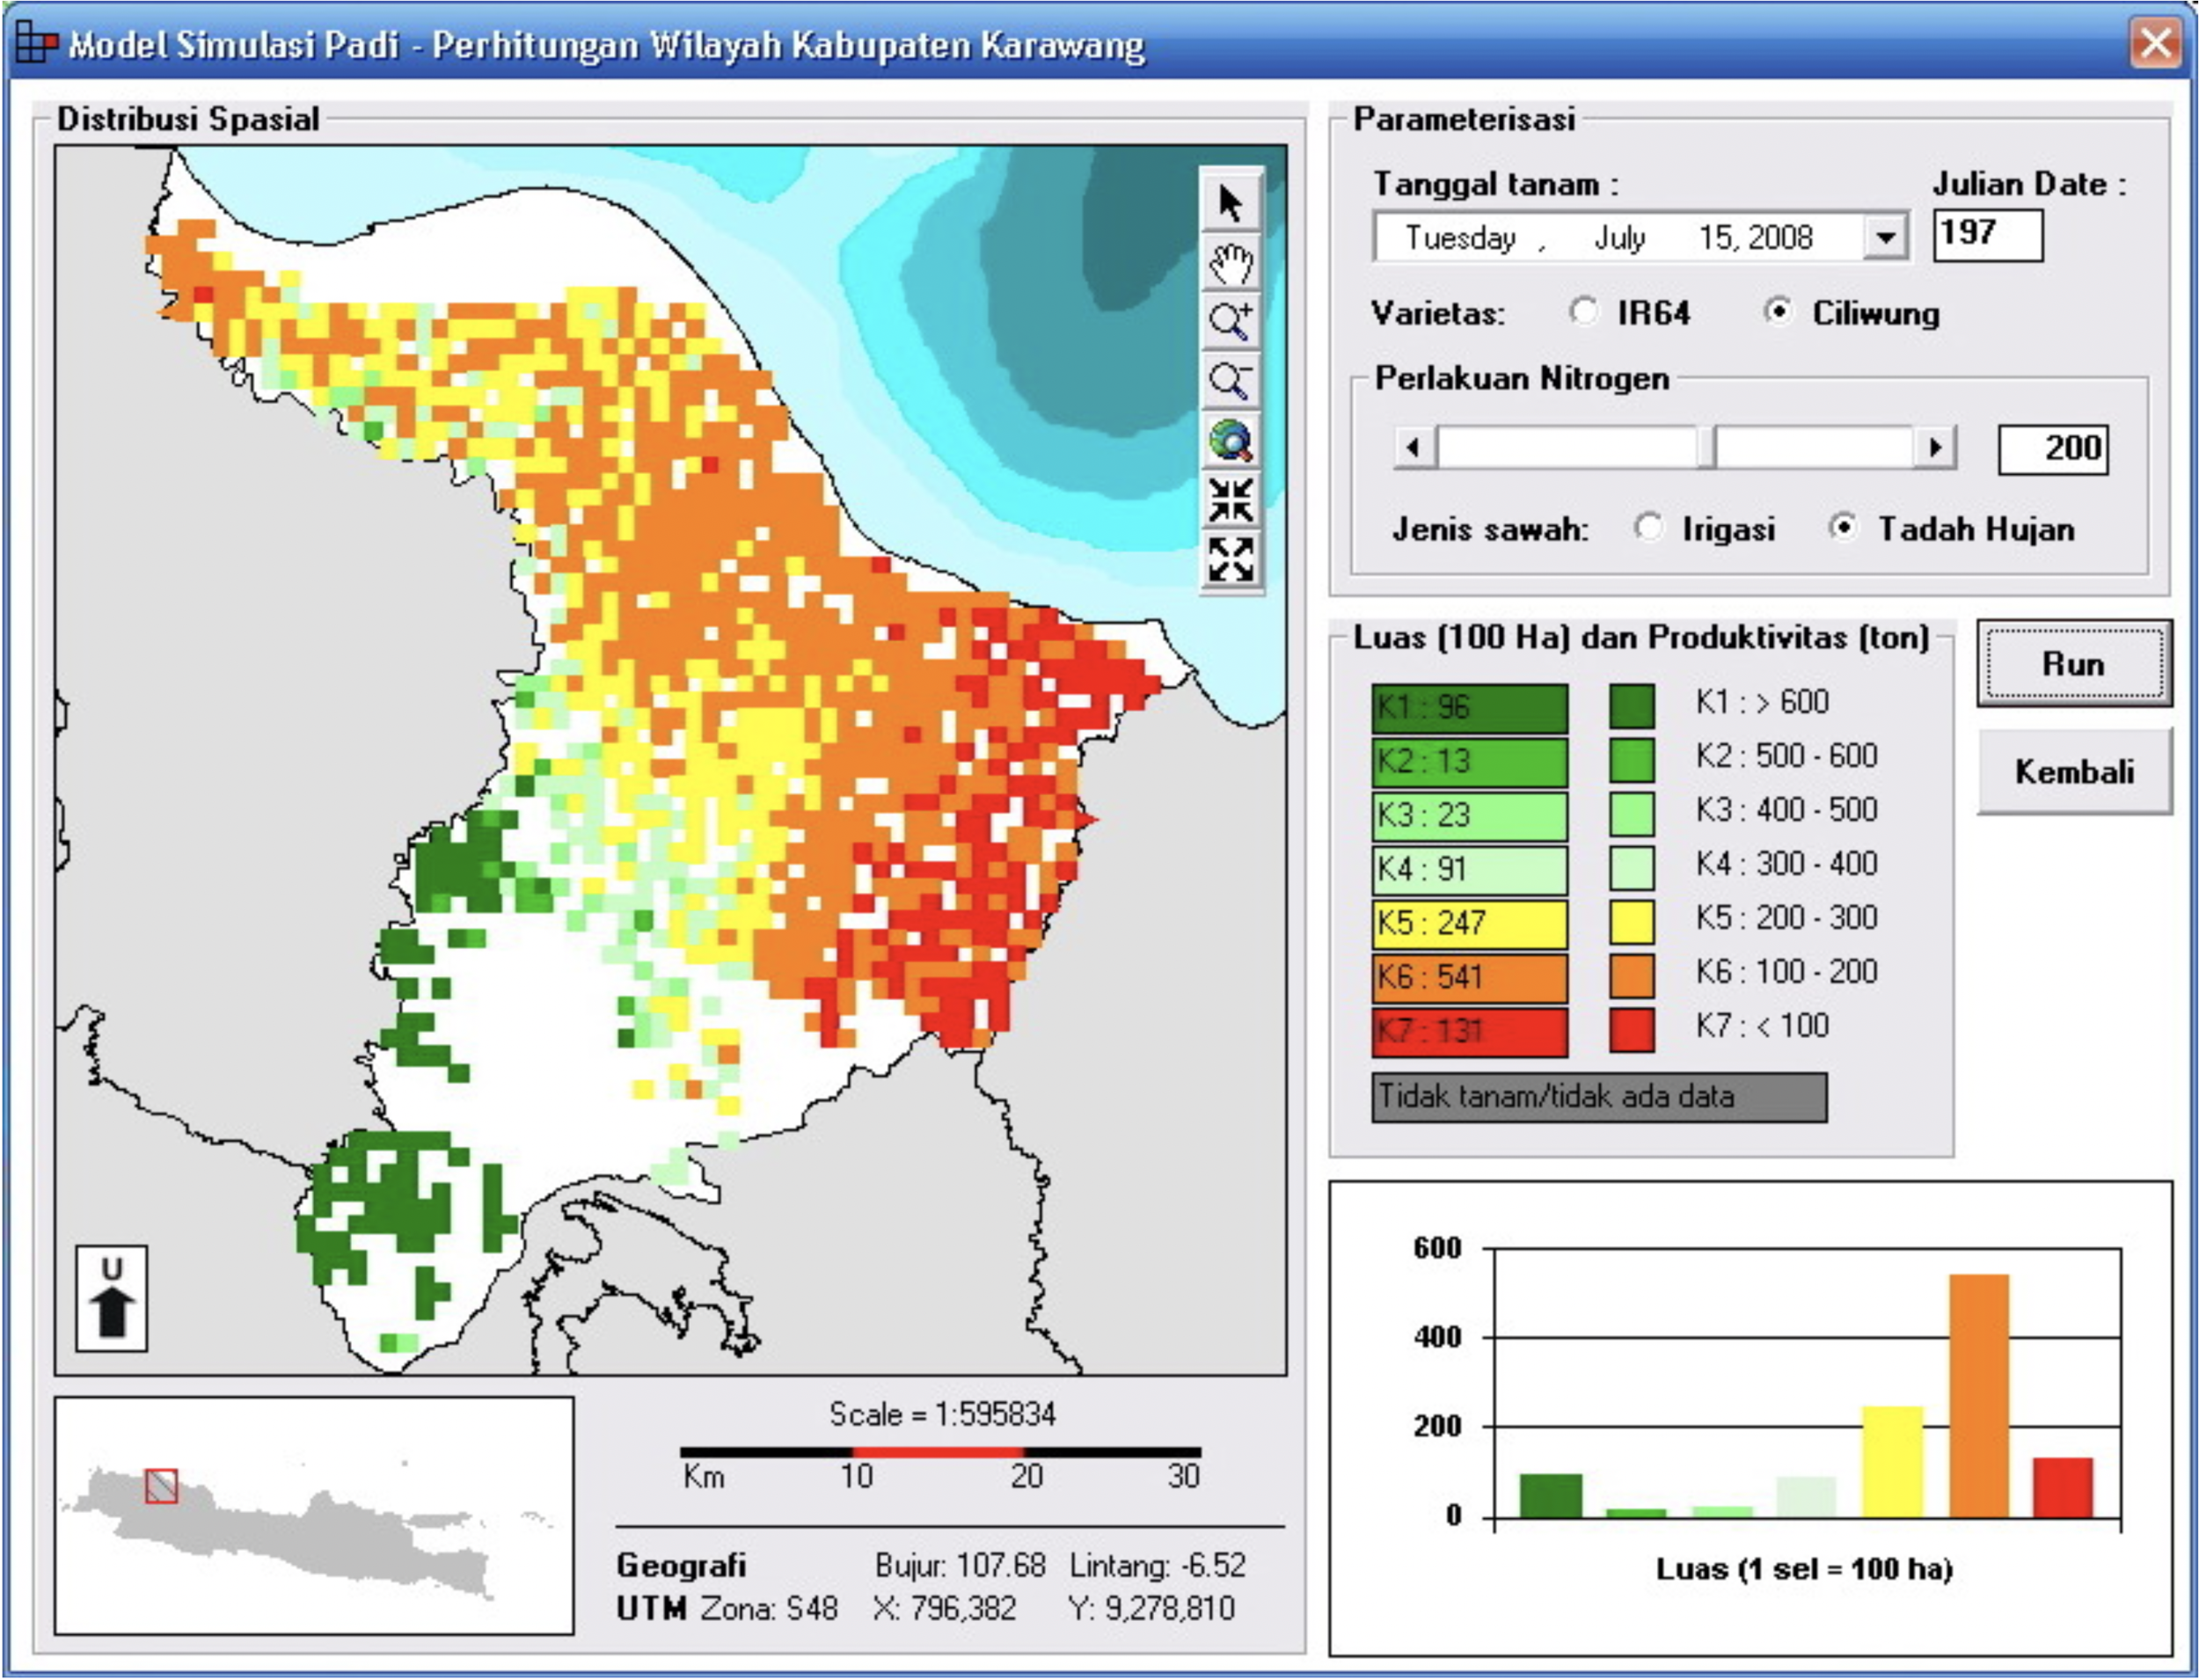
This sub-model presents an estimate of potential production at various planting times. Estimation on potential production is based on weather data, nitrogen treatment and paddy varieties. Weather data and nitrogen treatment are related to the water requirements and nutrients of paddy in each phase of its development. Information on potential production estimation can be visaulised spatially and in one location (point). One cell on the map represents 100 hectares of paddy fields. In a one-point simulation, the output is an estimate of potential production at various planting date and the optimum planting time. The sub-model of economic value presents profit estimation based on cost component information and estimated potential production, both for one planting period and each phase of its development. Cost components can be modified according to conditions and prevailing prices.
The results of this simulation can be useful for the government in making policies and programs related to the planting schedule and is expected to be used by farmers to find out the optimum planting time and estimate the amount of benefits that might be obtained.
User Interface
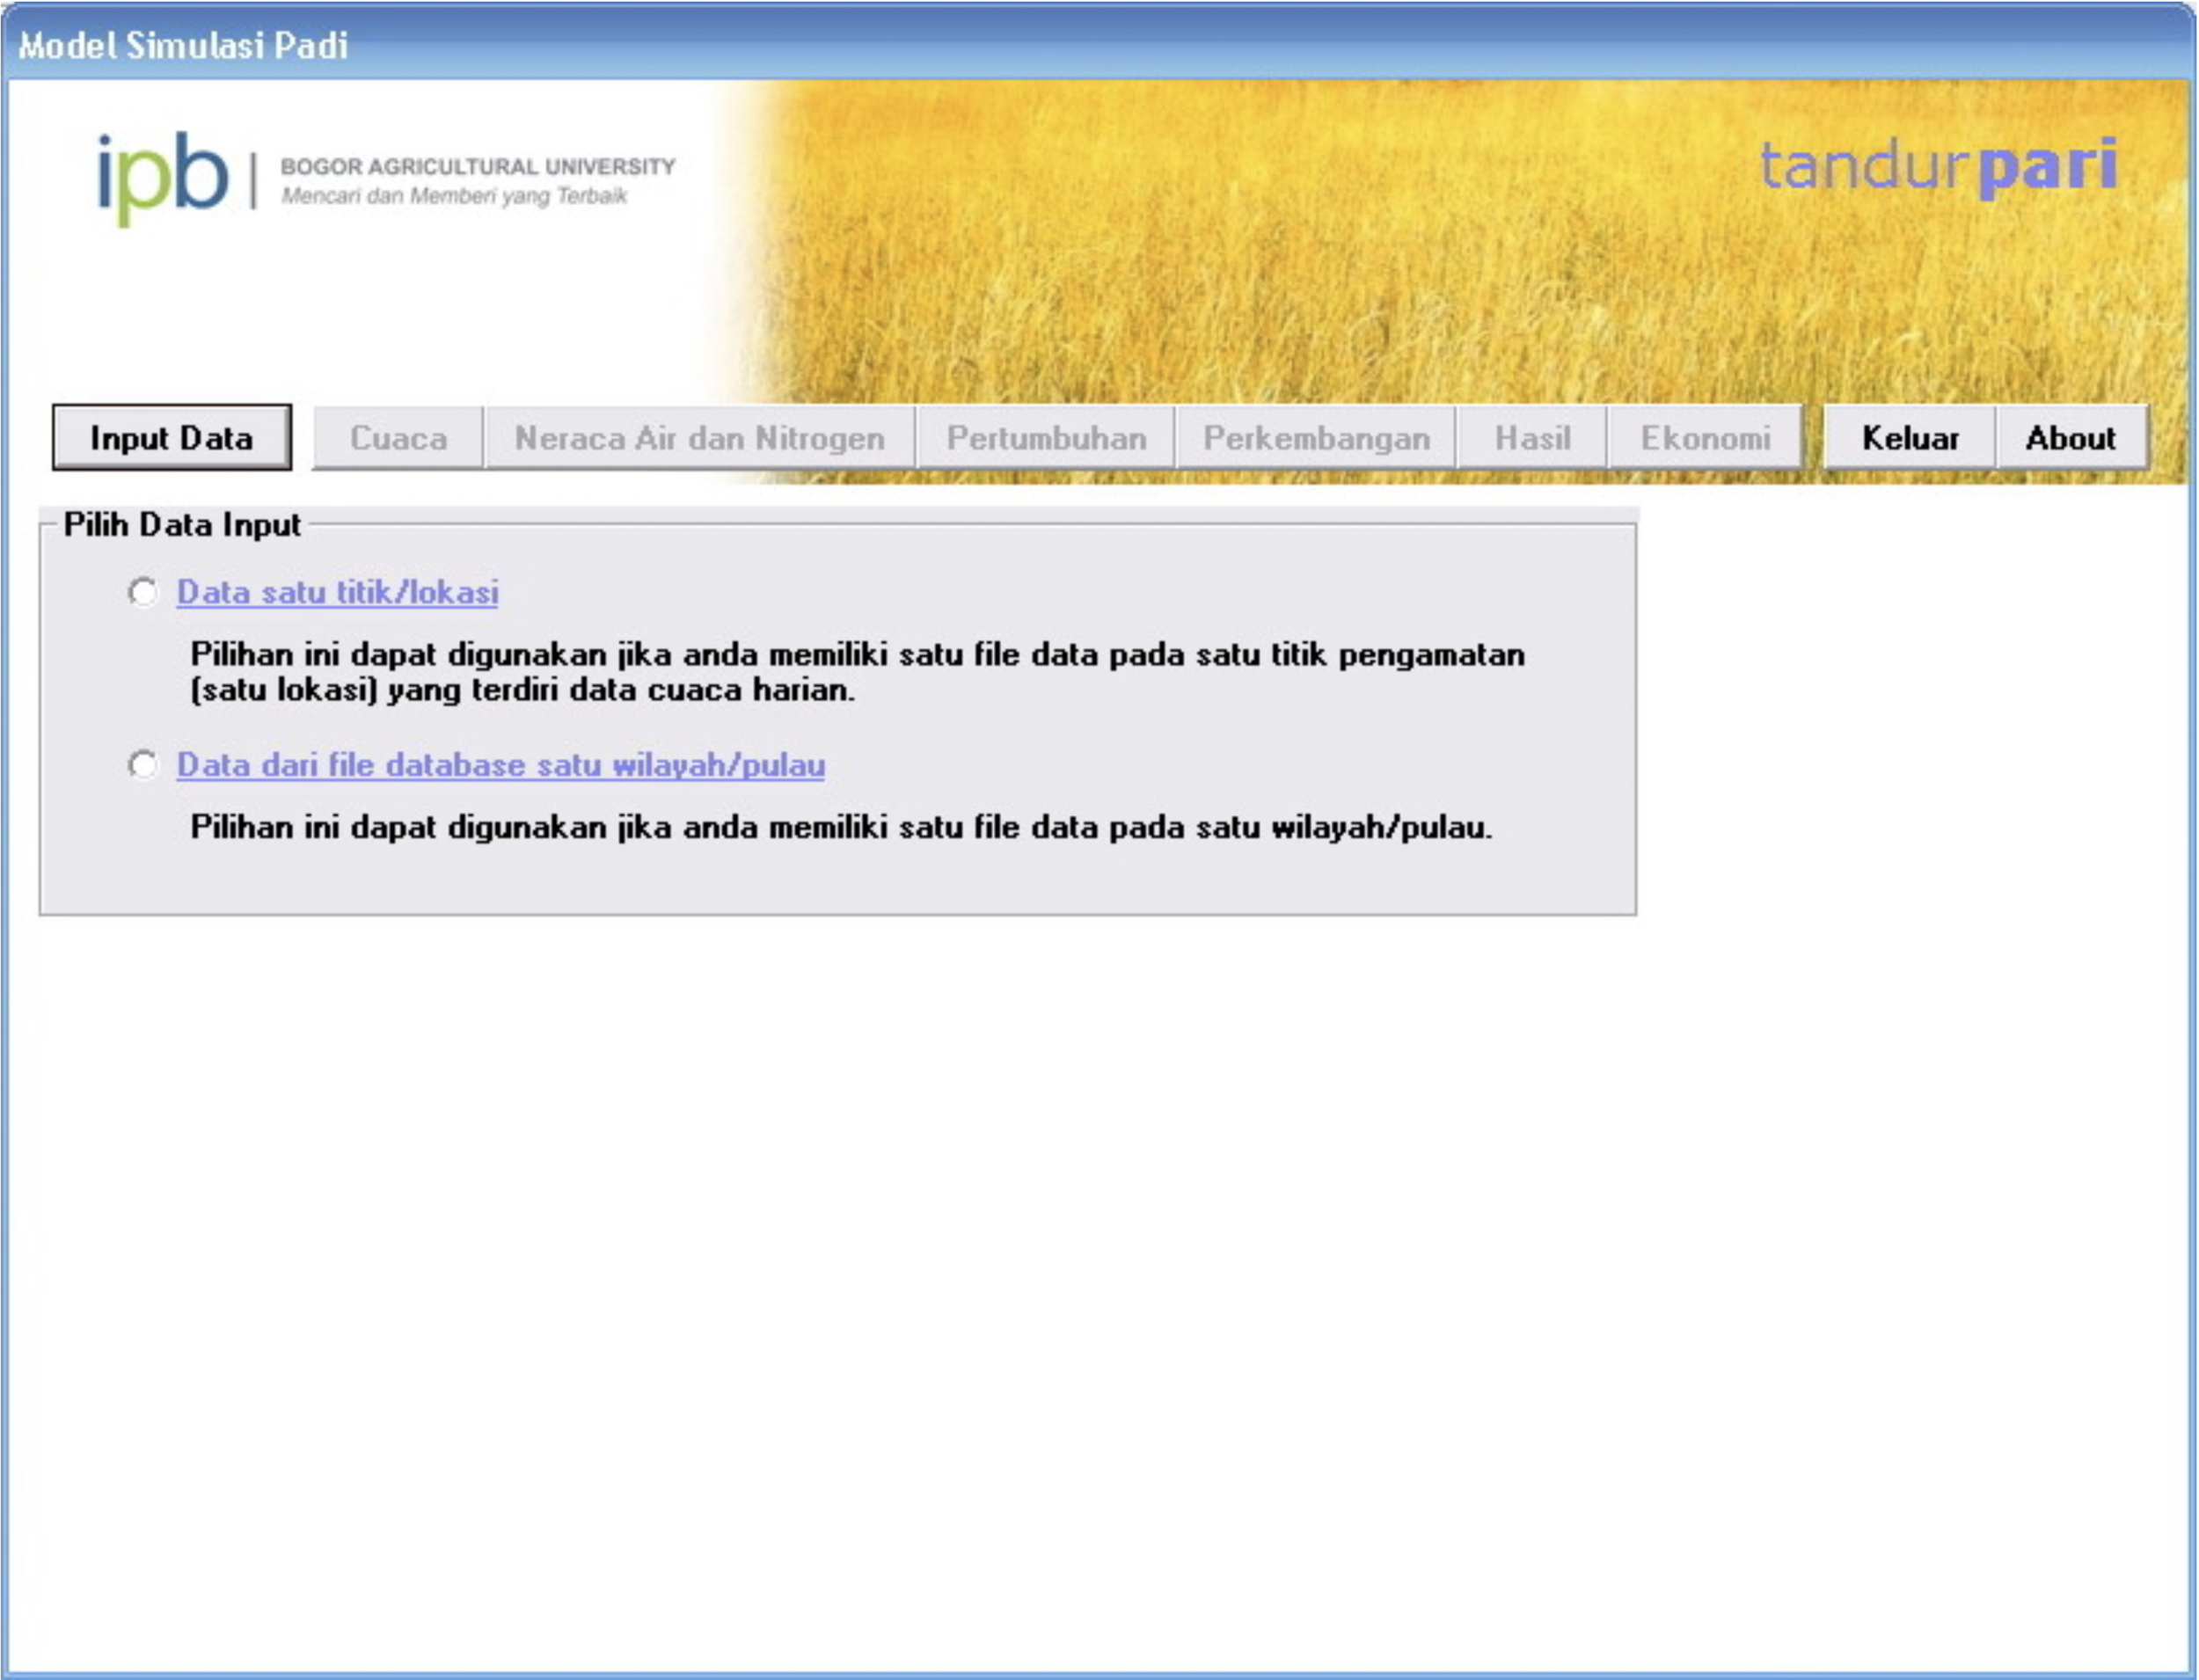
The user interface was built as a software application package with the Visual Basic programming language and supported with a number of library files and ActiveX from other software. To display the results of the model, a map is built by adding MapObjects to the project component in Visual Basic. MapObject has several features such as zoom in, zoom out and display the coordinates of the map. The program offer two-methods to calculate the growth and development models, one point and regional.
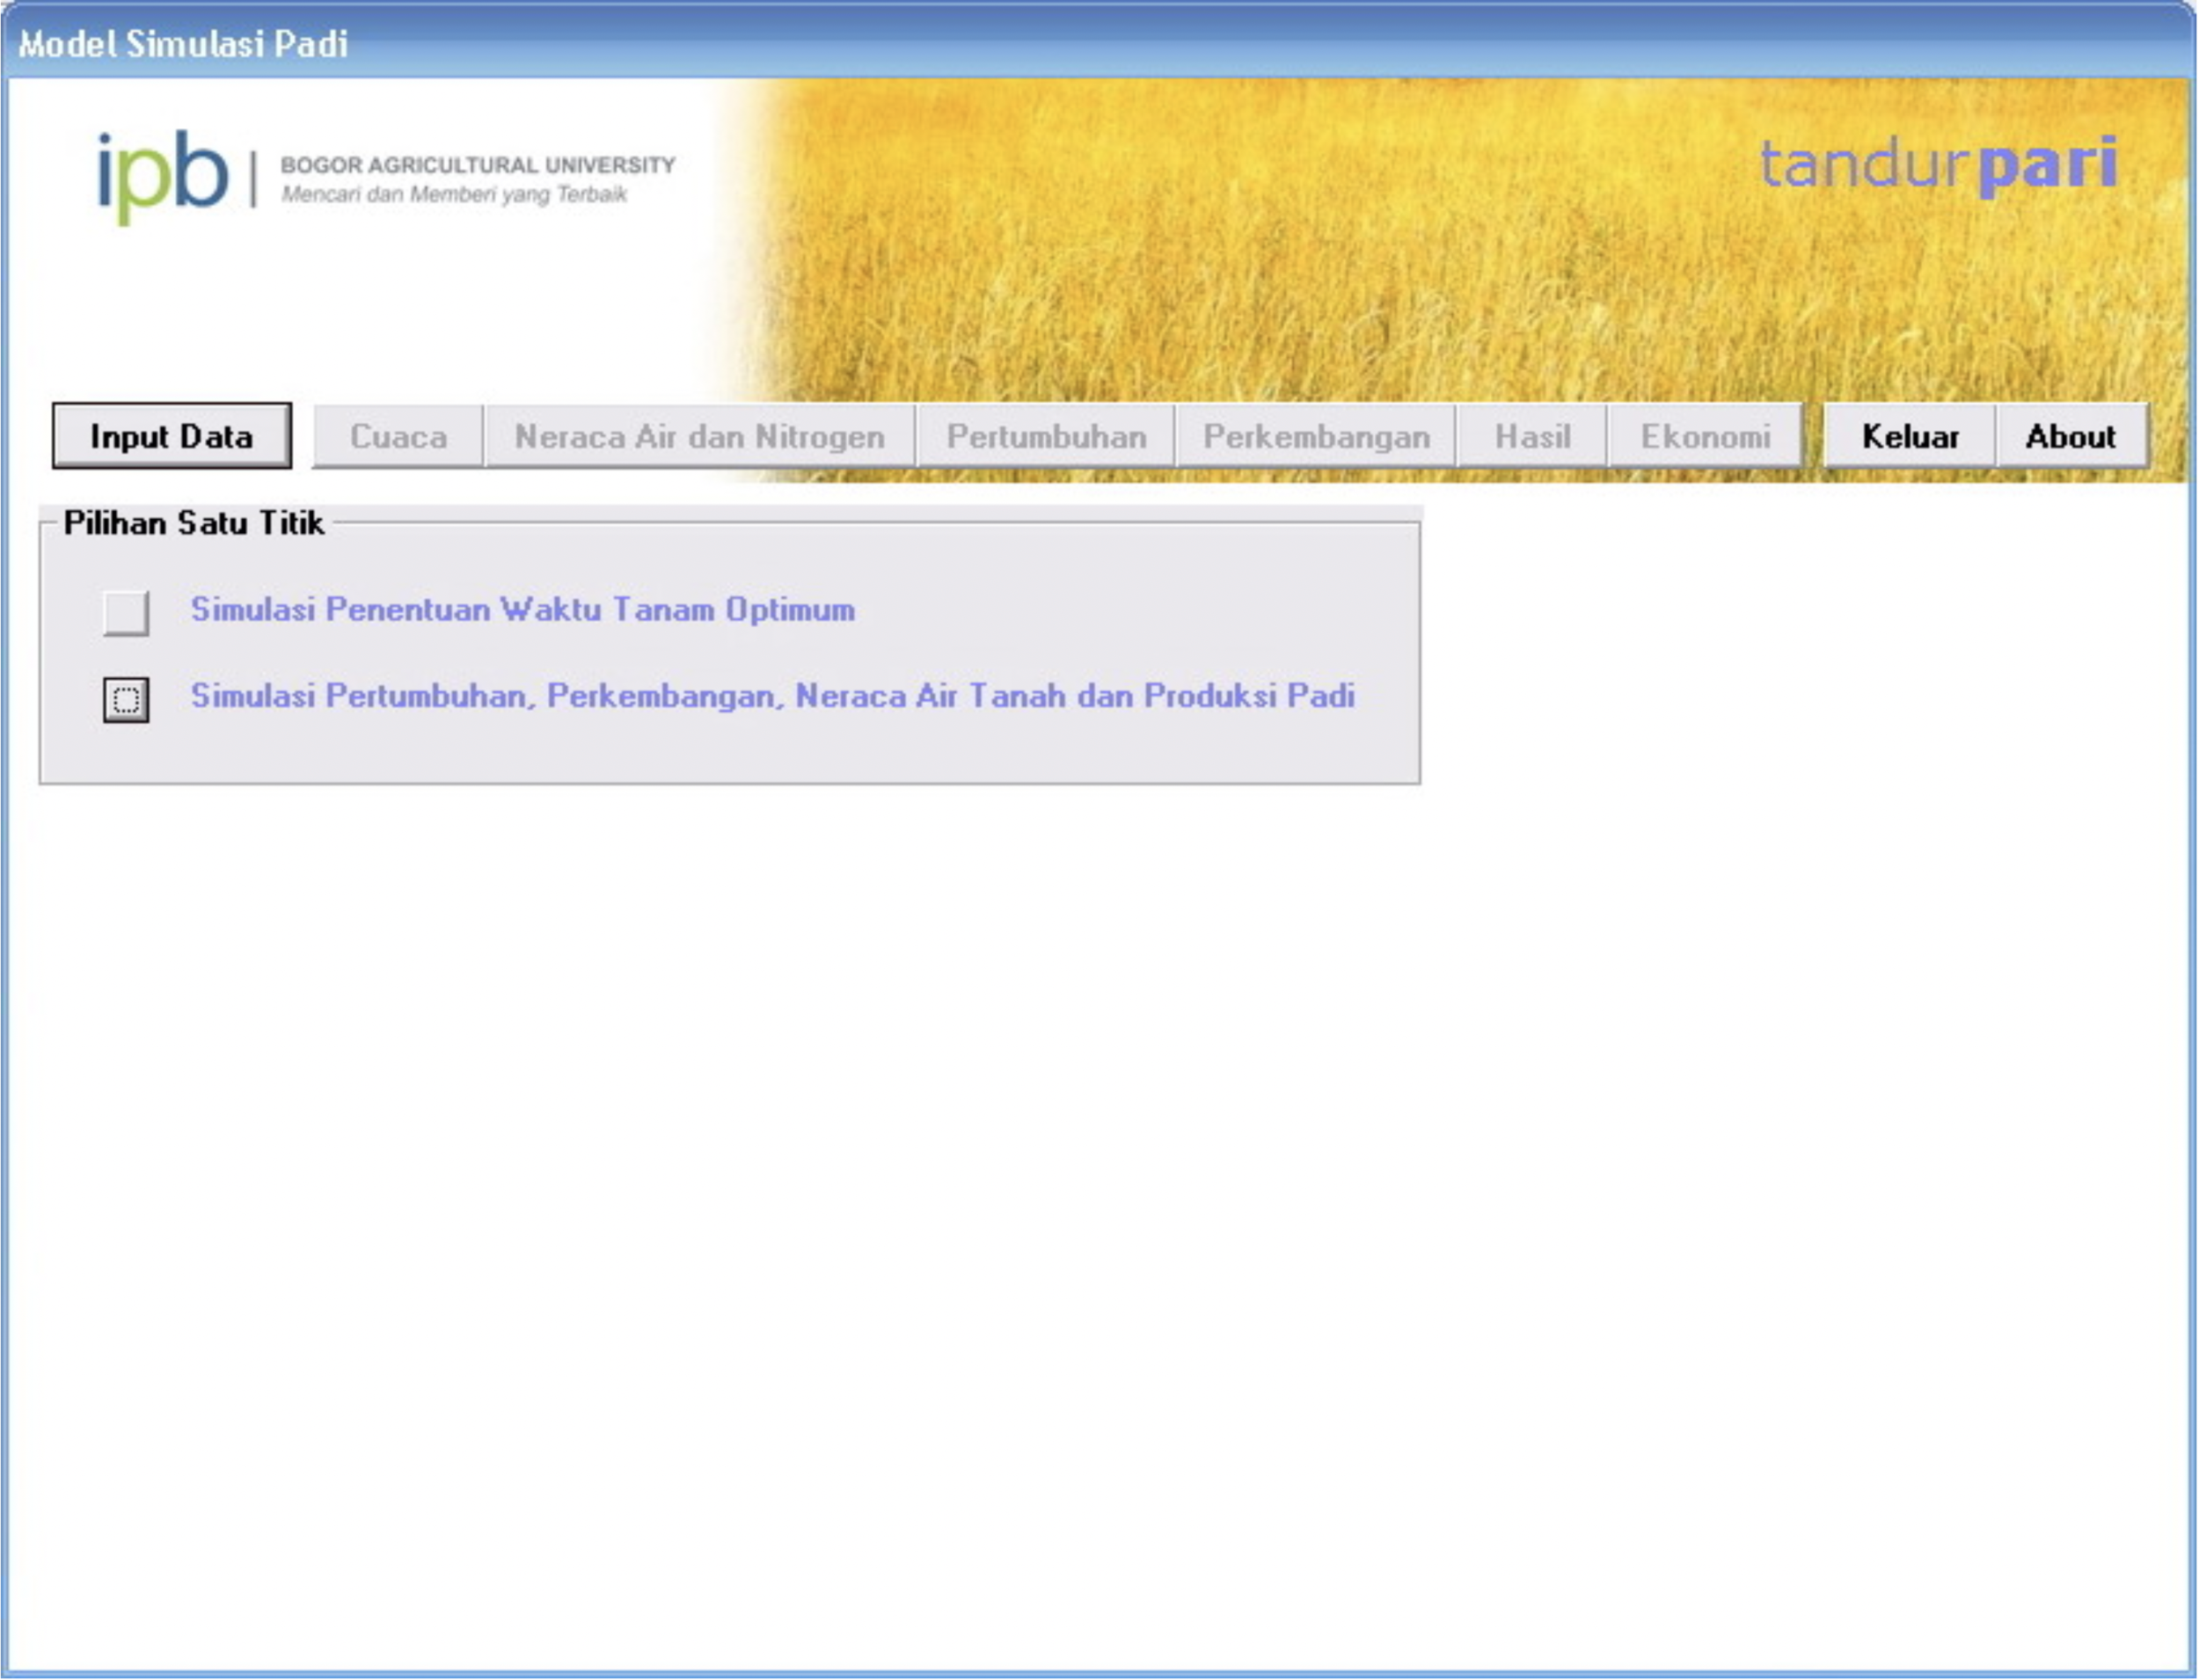
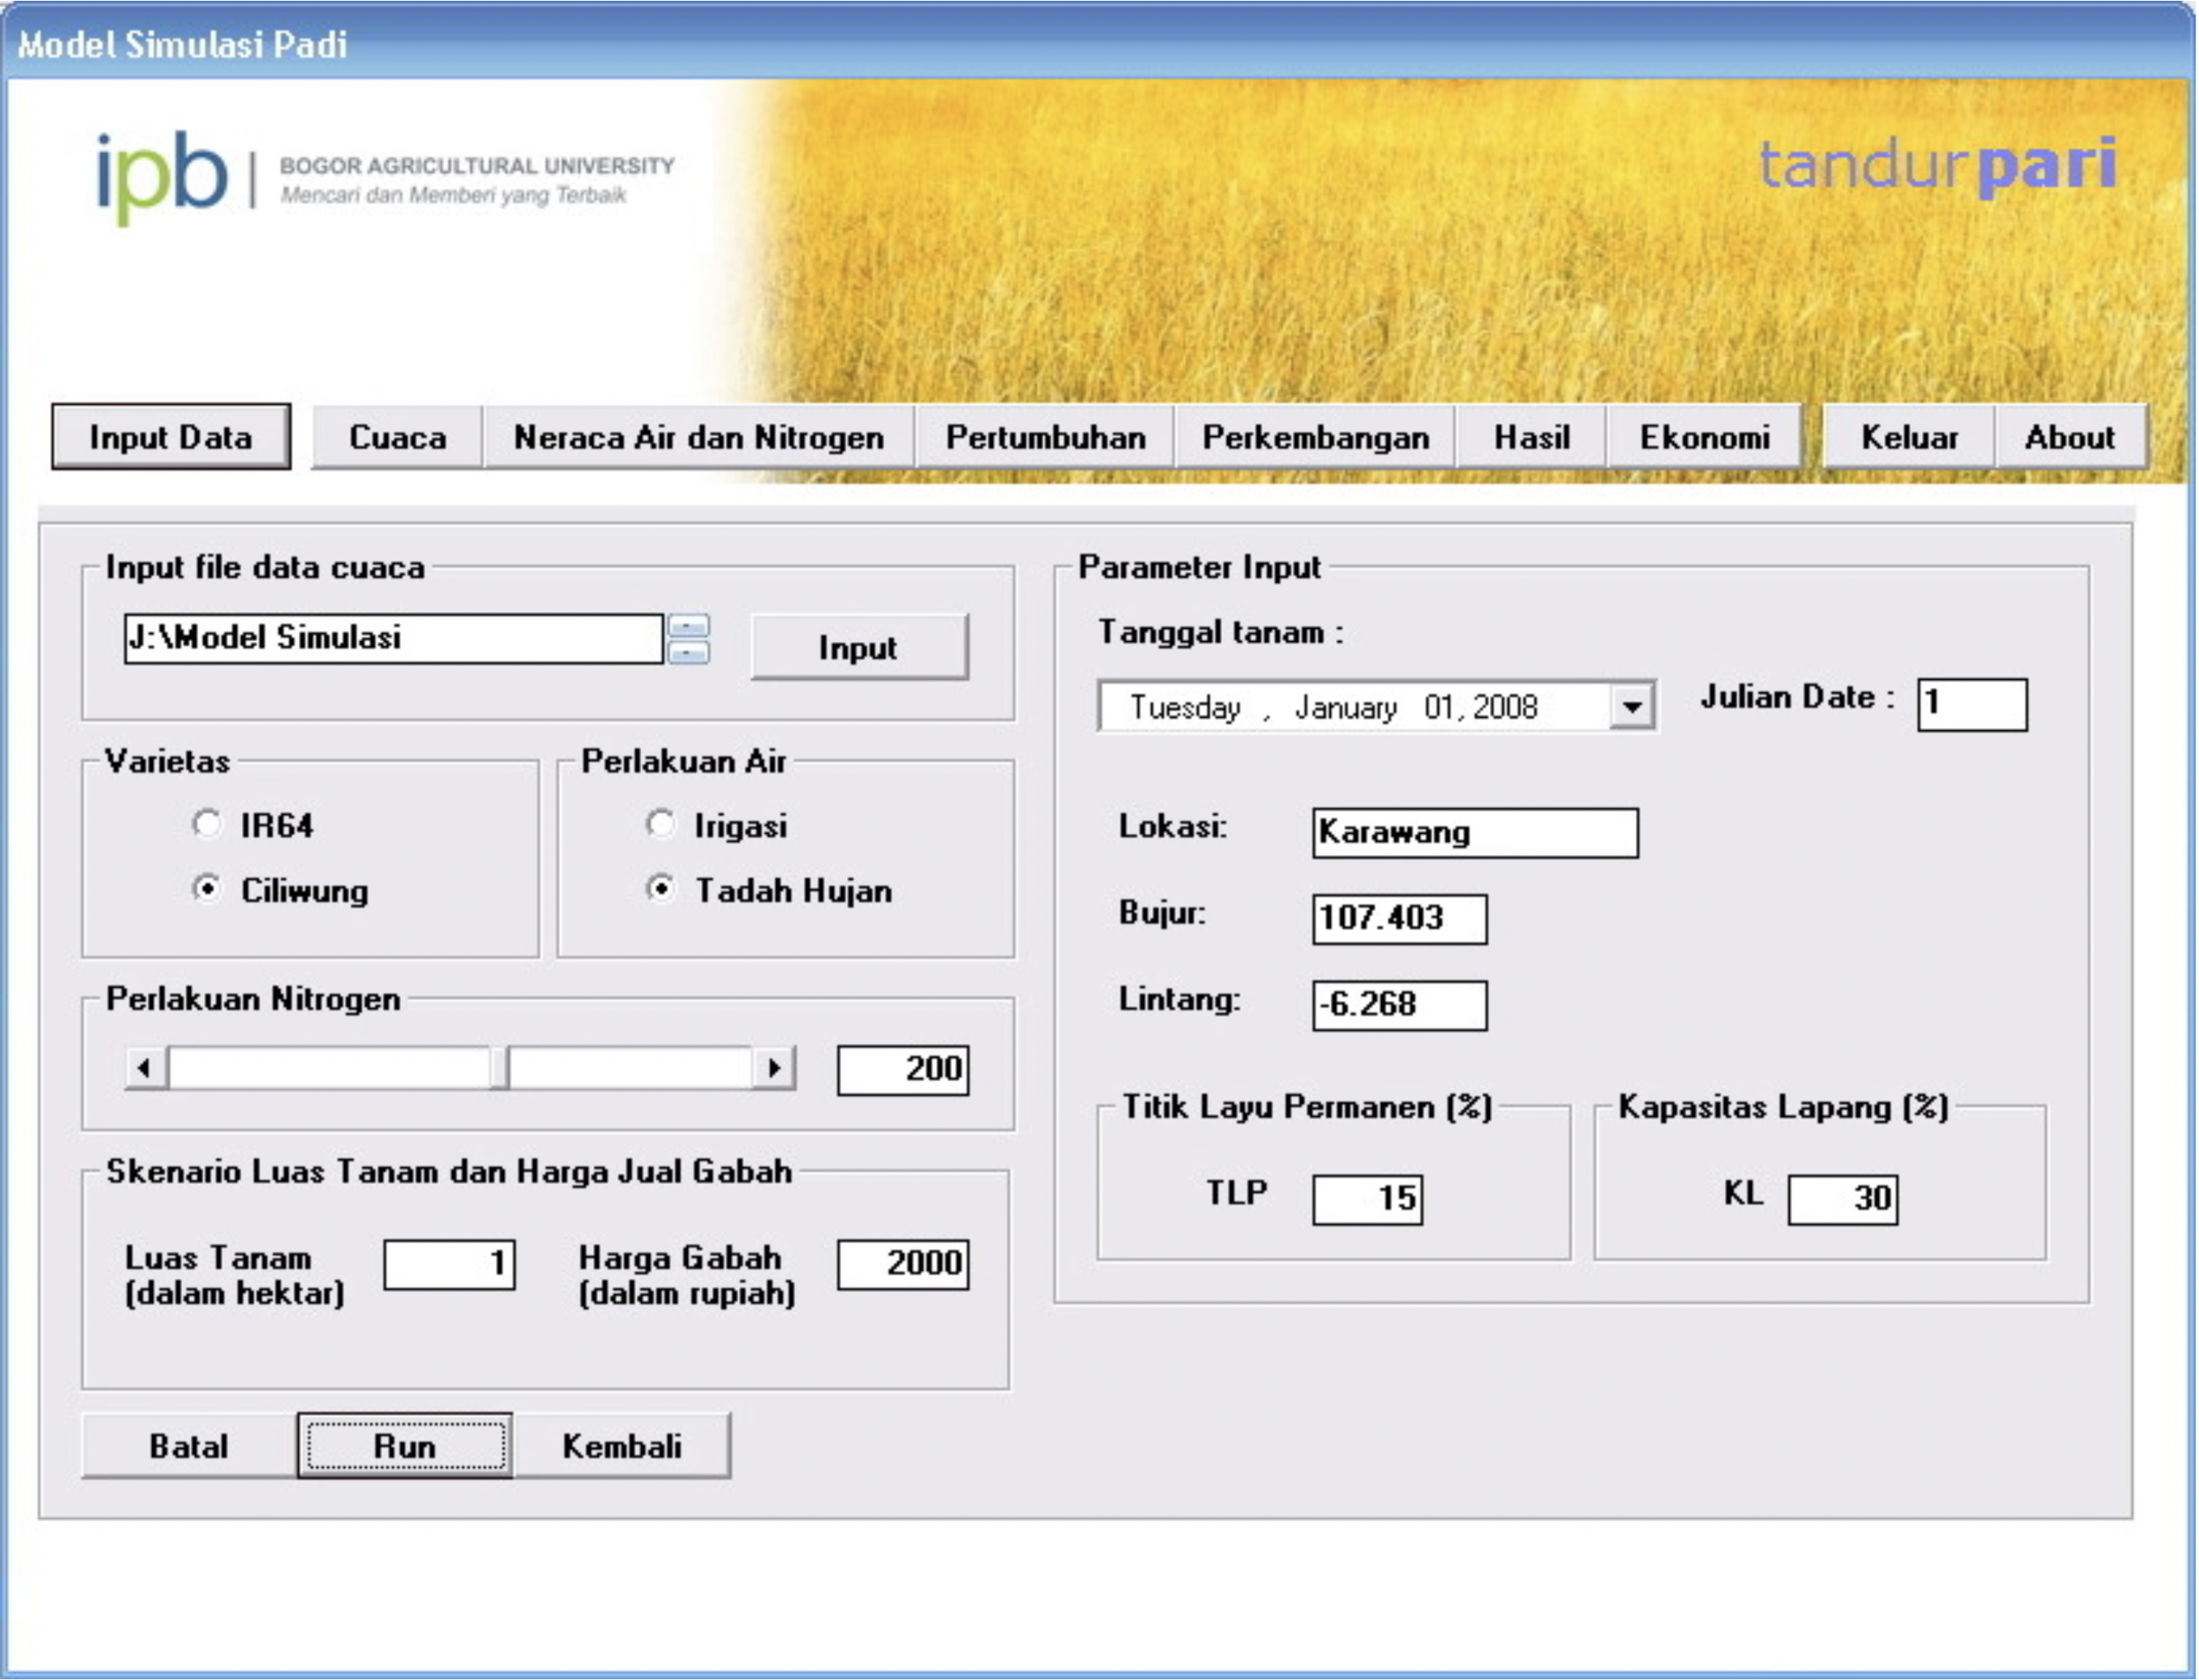
At one point calculation options, there is a choice of simulation to determine the optimum planting time and simulation of growth, development, groundwater balance and paddy production and its economic value. The required weather data input is made in * .csv format and the simulation can be carried out by modifying the amount of nitrogen treatment, planting date, paddy varieties and types of irrigated or rainfed paddy fields.
After the simulation model is run, information on the length of development for each phase is presented on a specific page. The periods of each phase vary widely and are determined based on rainfall conditions and other climate data. In addition to seeing the simulation results for each phase of development, it can also be seen directly the magnitude of the potential results in general. On the other page, optimum planting time simulation information can be obtained by estimating the production potential and economic value of the farm.
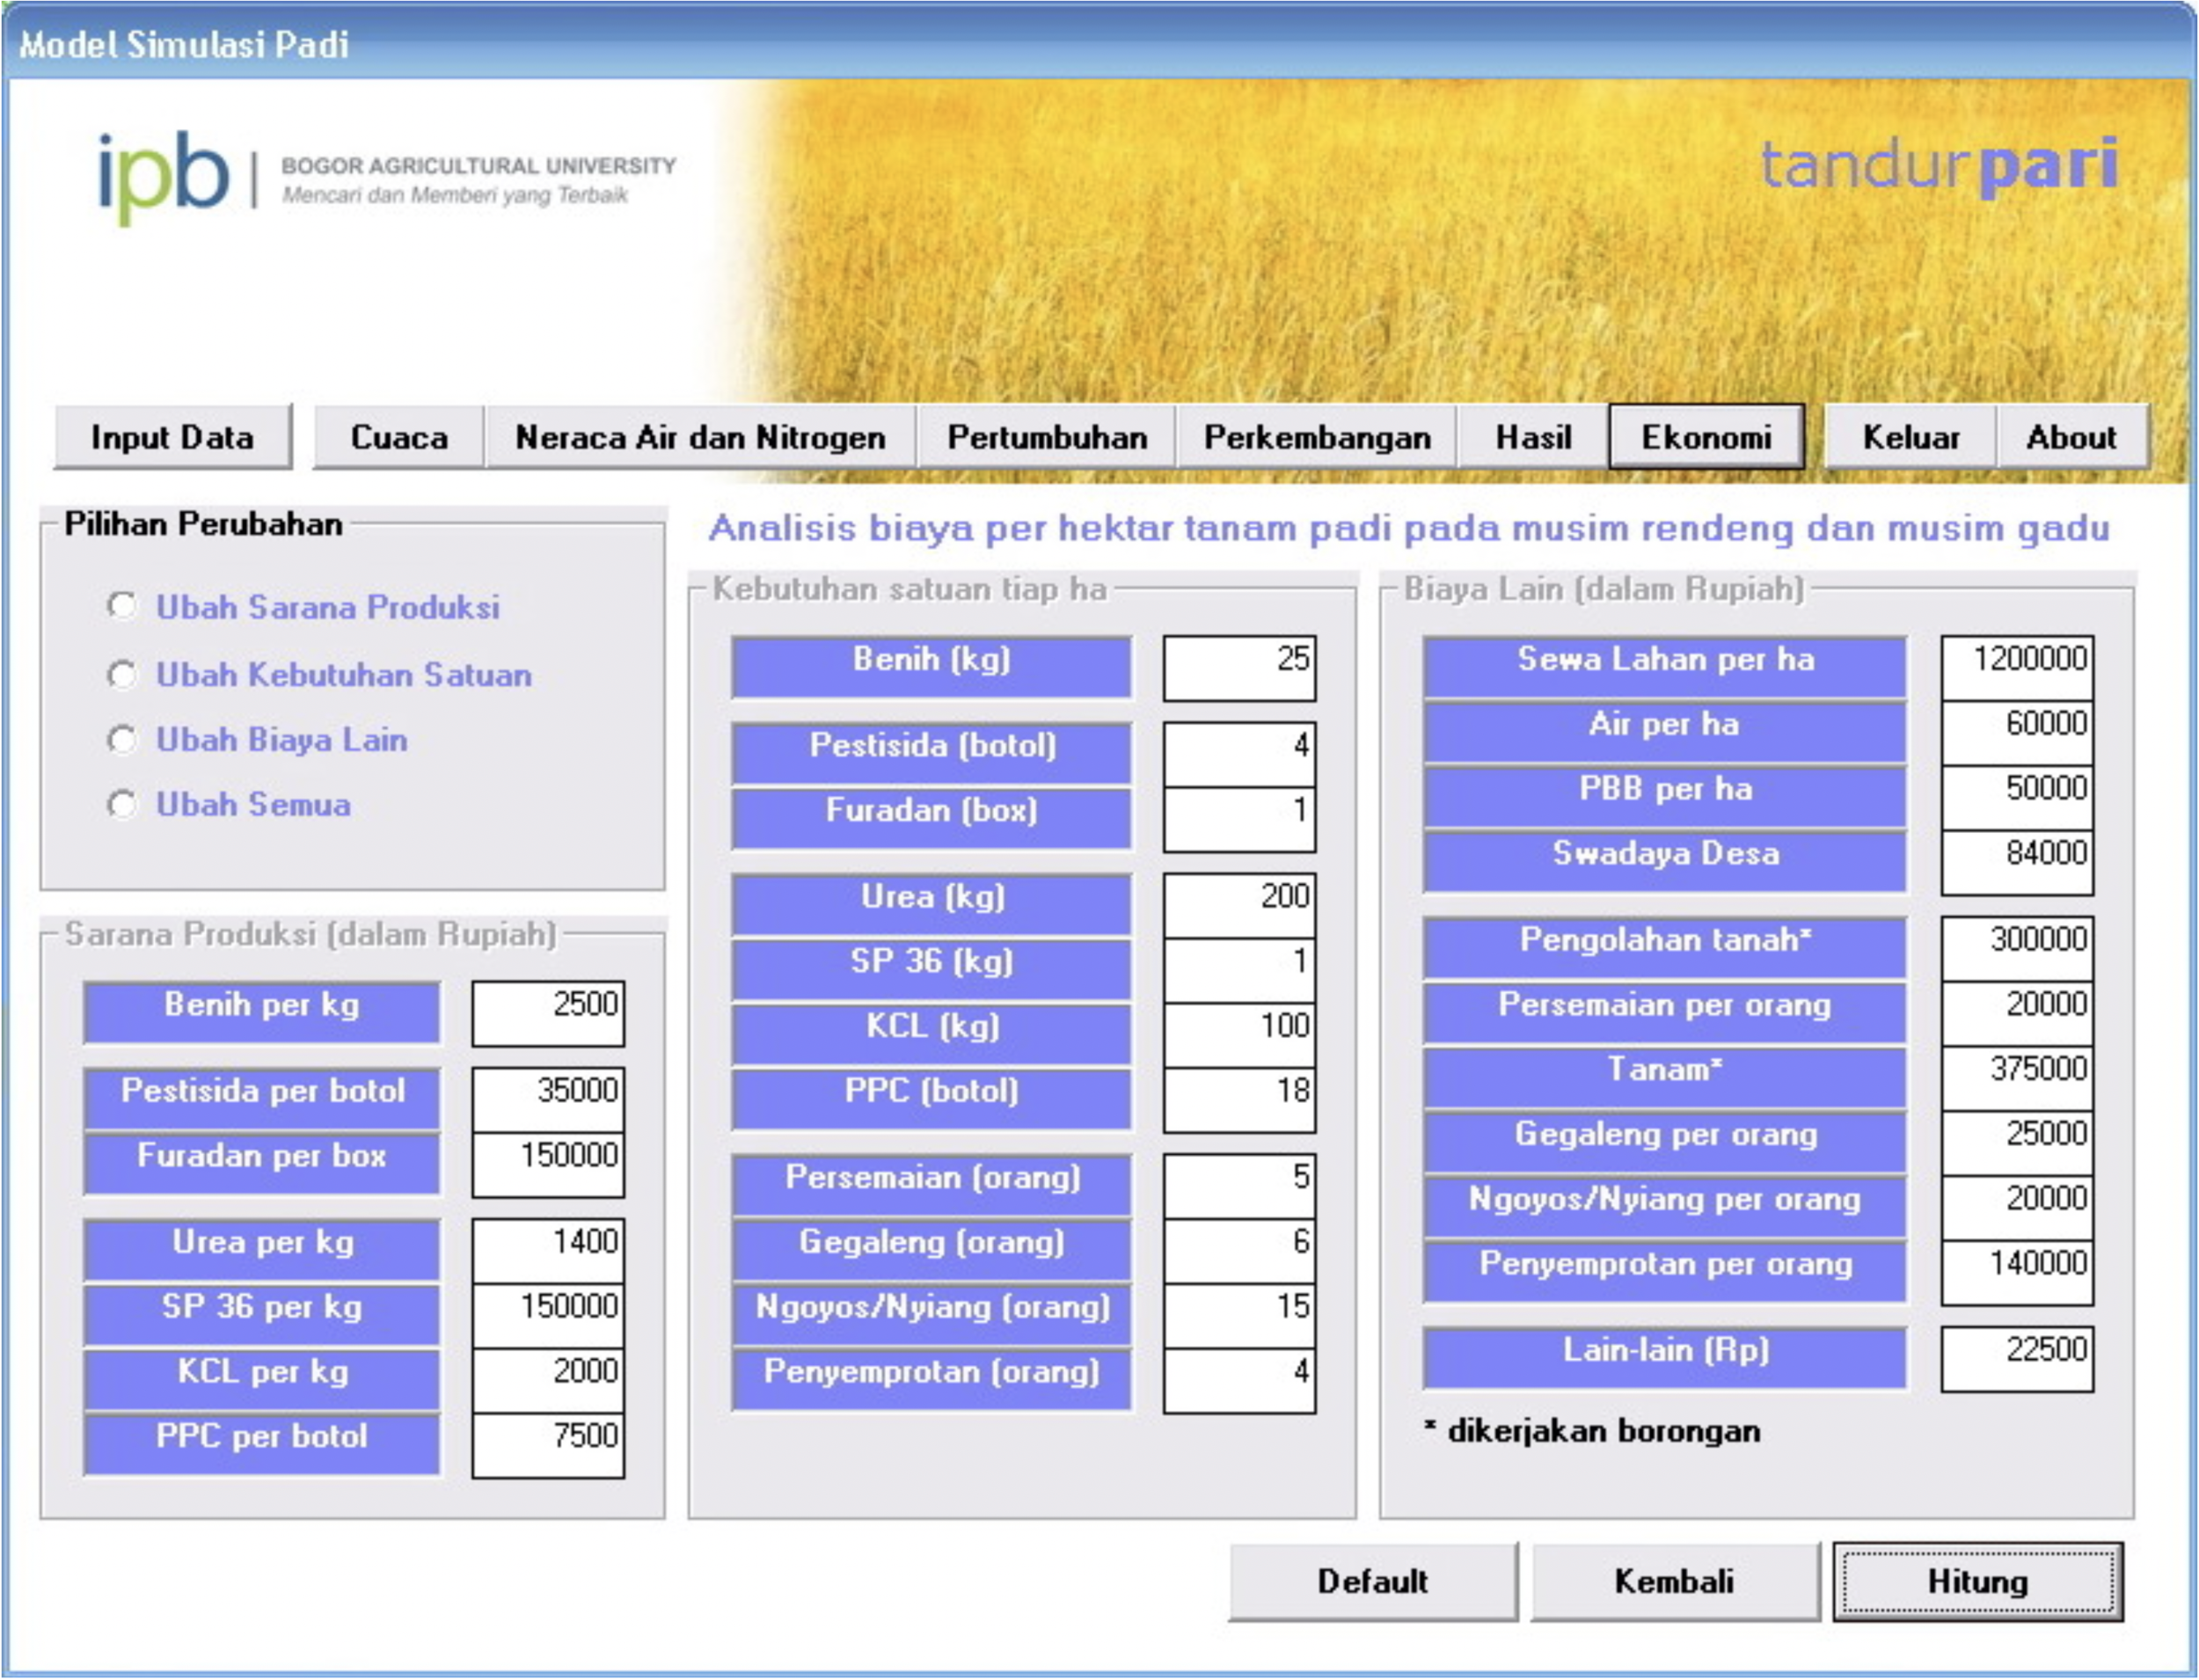
The magnitude of the component cost of farming has been made default when the simulation is run. If you want to make modifications to the cost components can be done on a separate page.
In addition to simulations for one point, simulation can also be done for the region. Area simulations are carried out only on locations with paddy land cover, so previously the map that would be used as well as administrative also land cover maps. As an example of regional simulation, for the January 1 planting scenario (representing rainy season conditions) with 250 kg nitrogen treatment and rainfed paddy conditions and Ciliwung paddy varieties, most of the Karawang region in the northern part is only likely to produce 1-2 tons / ha. While in the southern part of Karawang, the yield potential is higher at more than 6 tons/ha. Whereas for the July 1 planting scenario (representing dry season conditions) with the same treatment, most of the Karawang region only has the potential to produce 2-3 tons/ha, only a small portion in the southern region has the potential to produce more than 6 tons.
The agricultural sector has an important role in Indonesia. Therefore, businesses that support agricultural development are needed. The paddy growth and development simulation model presented spatially is very useful for the government in making program policies for certain areas, looking at the distribution of potential yields, and determining priority target areas. In addition, this model is expected to be useful for farmers to determine planting strategies such as the selection of varieties, determining the optimum planting time and capital preparation based on the estimated cost components and estimated profits obtained.
Reference
Binh ND, Murty VVN, Hoan DX. 1994. Evaluation of the possibility for rainfed agriculture using a soil moisture simulation model. Agric.Water.Manage, 26, 187-199.
Brisson N, Bernard S, Patrick B. 1992. Agrometeorological Soil Water Balance for Crop Simulation Models. Agric.For.Meteorol, 59, 267-287.
Chang J. 1974. Climate and Agriculture: an Ecological Survey.Third Edition. University of Hawaii. ALDINE Publishing Company. Chicago.
Doraiswamy DC, Thomson DR. 1982. A crop moisture stress index for large areas and its application in the prediction of spring wheat phenology. Agric.Meteorol, 27, 1-15.
Handoko, Risdiyanto, 1. dan Sugiarto, Y. 1998. Model simulasi tanman padi Shierary-Rice untuk estimasi produksi potensial padi di Indonesia. Makalah pada Lokakarya Sistem Pemantauan dan Prediksi Produksi Padi di Indonesia, BPPT. Jakarta, 22 Juli 1998.
Handoko, I. 1994. Dasar Penyusunan dan Aplikasi Model Simulasi Komputer untuk Pertanian. Jurusan GEOMET FMIPA IPB. Bogor.
Hillel, D. 1972. The Field Water Balanced and Water Use Efficiency. In: D. Hillel (ed.) Optimizing the Soil Physical Environment Toward Greater Crop Yields. Academic Press. New York.
Back to top