Blending Satellite Precipitation and Gauge Observations
Blending of point and grid data
I have some station data! Can I blend it with the remote sensing data? How?
- The answer is Yes, and you must have: enough data, reasonable relationship between ground data and remote sensing parameter
On different situations:
- Long term point and long-term gridded data: station rainfall data and satellite precipitation estimates (SPE)
- Long term point and average gridded data: station temperature data and WorldClim average temperature grid
- Average point data and average gridded data
Possible pairs:
- Rainfall – SPE
- Temperature – Land Surface Temperature
Method
Regression - Kriging
- Define regression between point data and pixel values of a number of related/useful GRIDDED variables, e.g.
- \(T_{\text{air}} = f(\text{altitude}, \text{LST}, \text{NDVI}, \text{coast distance}, \text{other})\)
- \(\text{Rain} = f(\text{SPE}, \text{other})\)
Produce modelled parameter and residuals, e.g.
- \(\text{Rain}_{\text{Estimates}} = 1.43 \times \text{SPE}\)
- \(\text{residual} = \text{Rain}_{\text{Estimates}} - \text{Rain}\)
Interpolate residuals then Add back to the initial estimate
Example
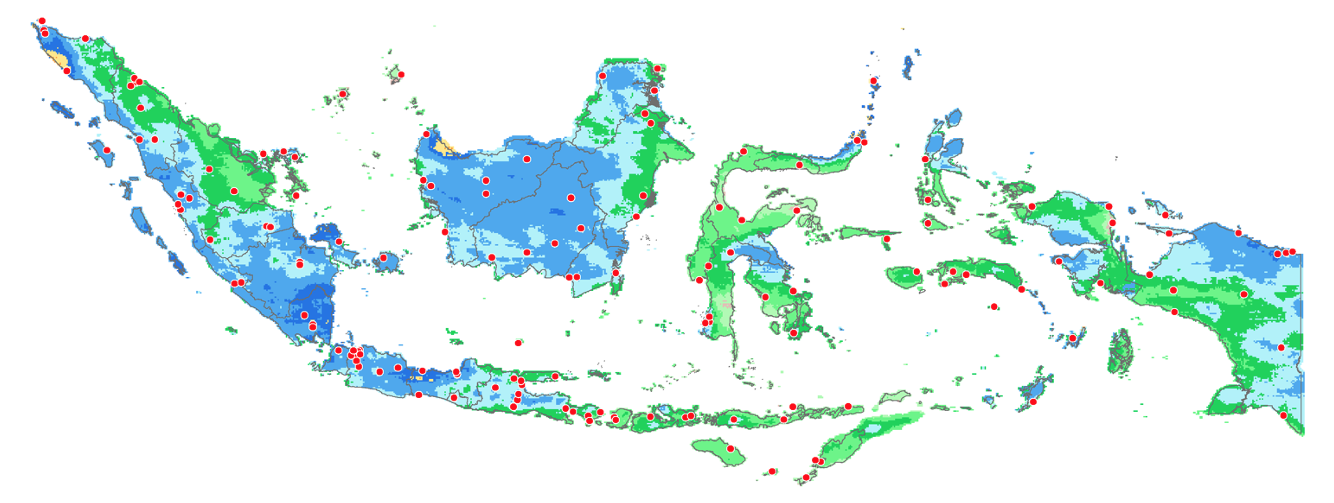
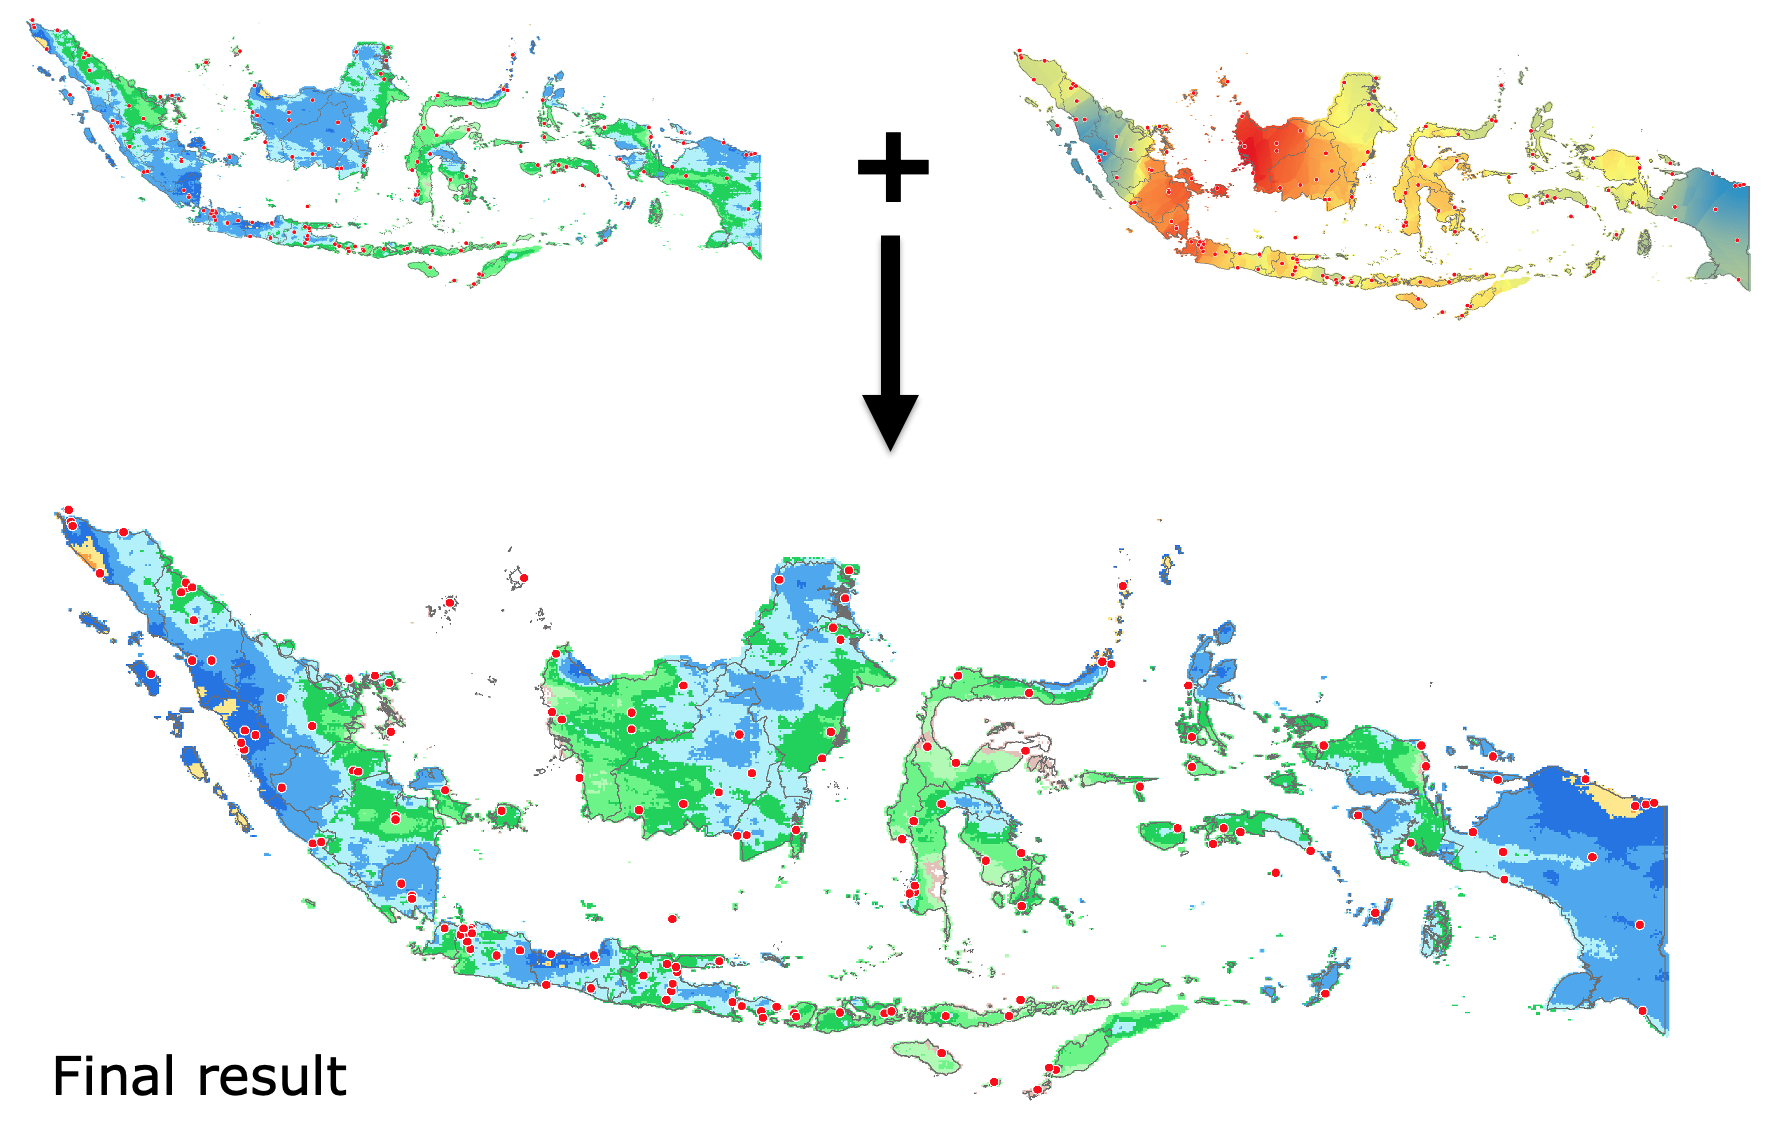
Extract SPE values at 152 station location: X, Y, Obs, SPE
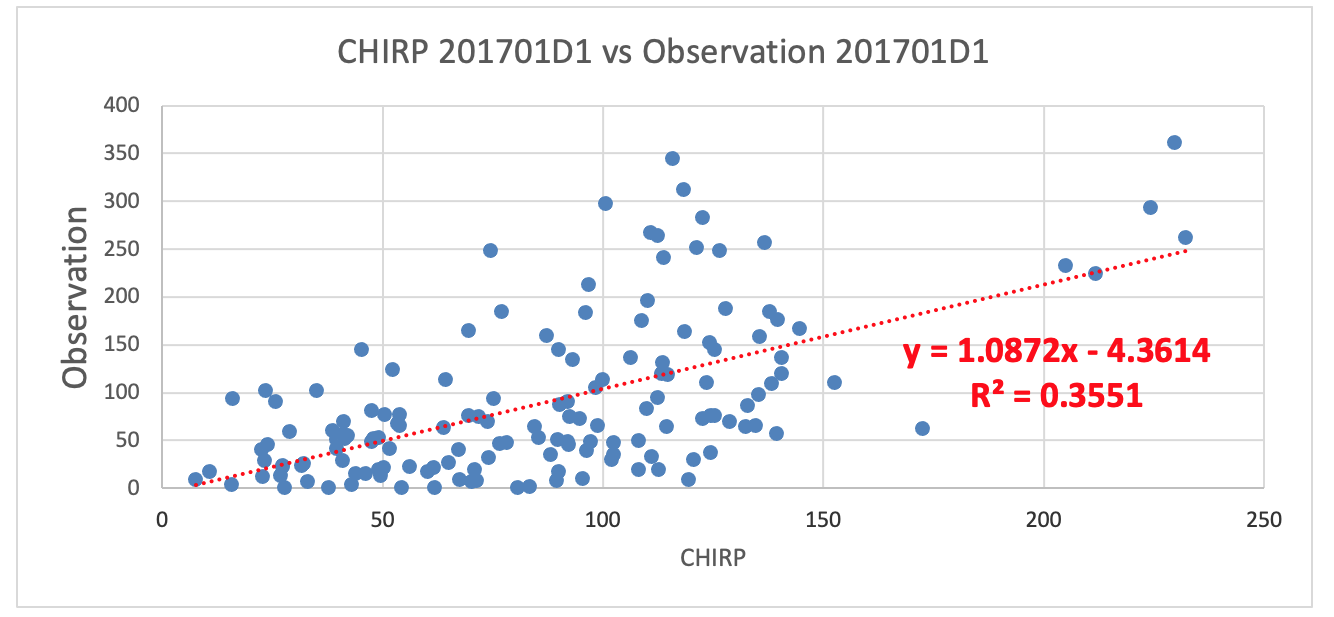
Regression model Rainfall - SPE
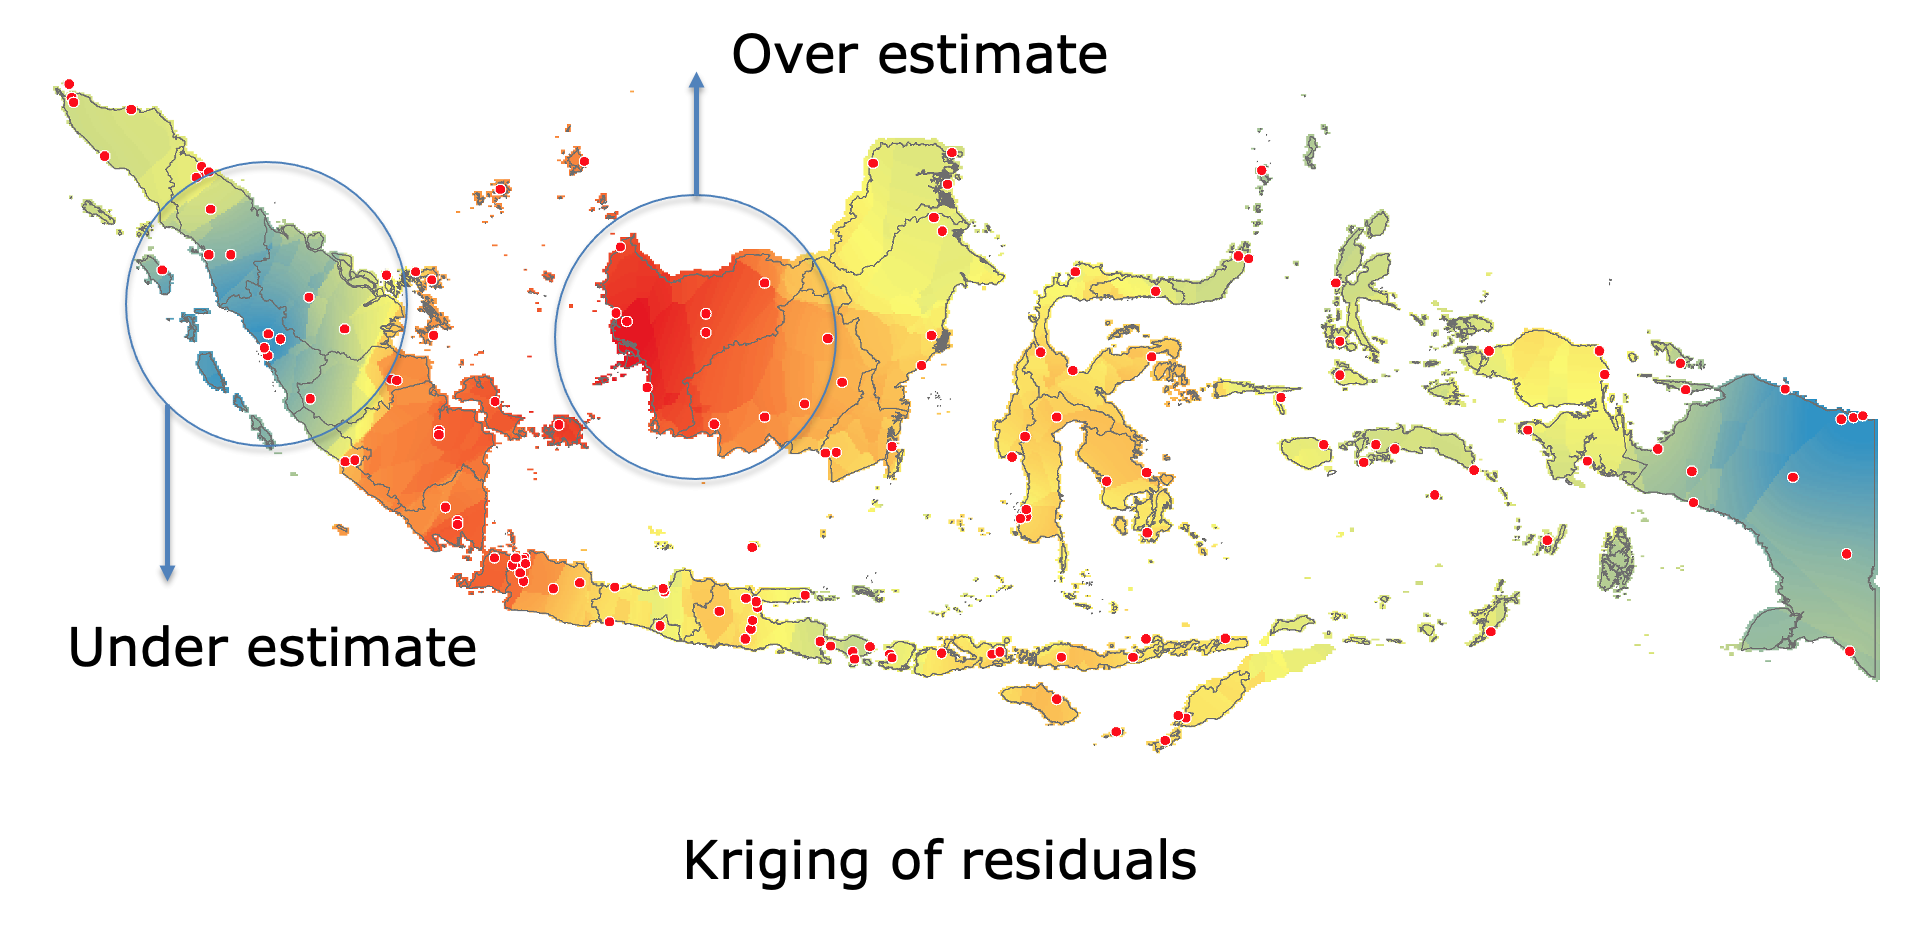
Modelled rainfall grid and residuals
Add back to the initial estimate
Exercise
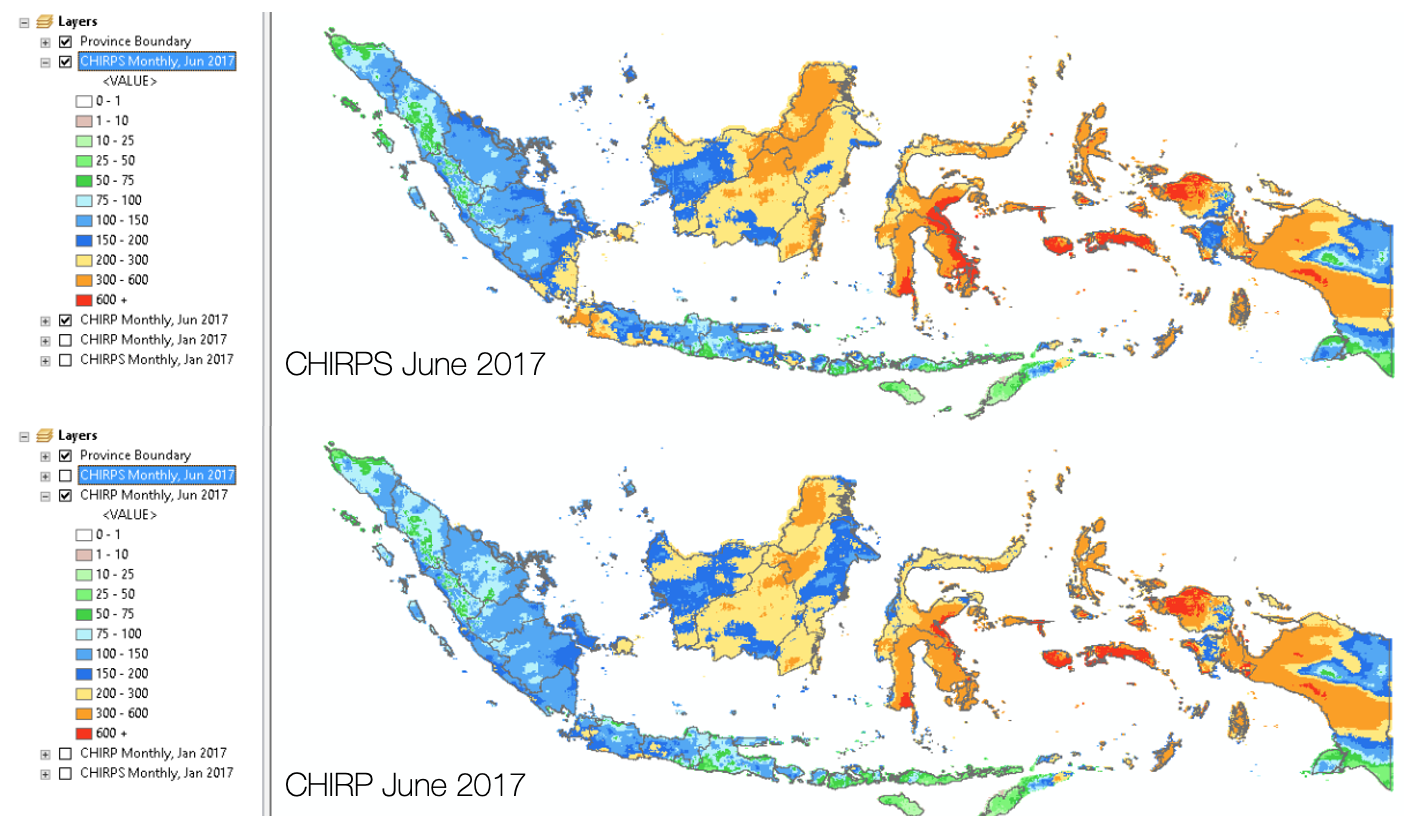
I am sure that you are familiar with and frequently use CHIRPS data in your climate-related analyses. But have you ever used CHIRP data?
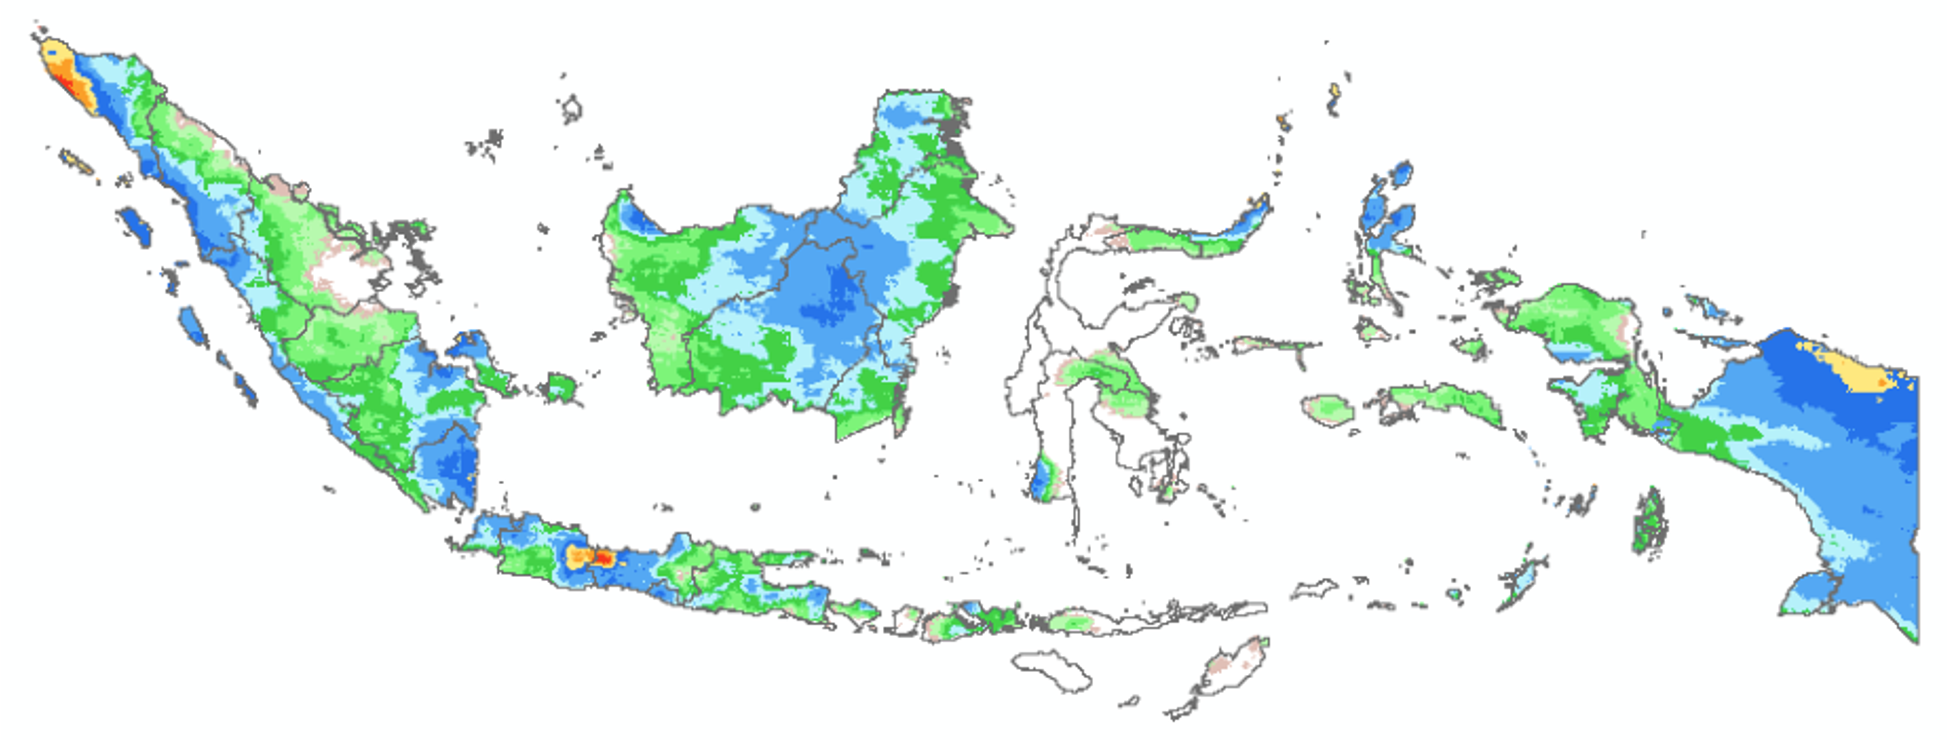
CHIRP and CHIRPS are gridded rainfall time series product from Climate Hazard Group of University California Santa Barbara, and the difference between the two data is CHIRPS incorporates station data. Let see comparison on below maps.
Prepare observation data
Let’s try the exercise on blending data using CHIRP and station rainfall from BMKG.
In this exercise, BMKG provide the daily rain gauge data in spreadsheet format and have two worksheet: Station and Data Original.
Folder 01_Download/BMKG
Open file BMKG_152station_dailyobs_2017_Dekad.xlsx
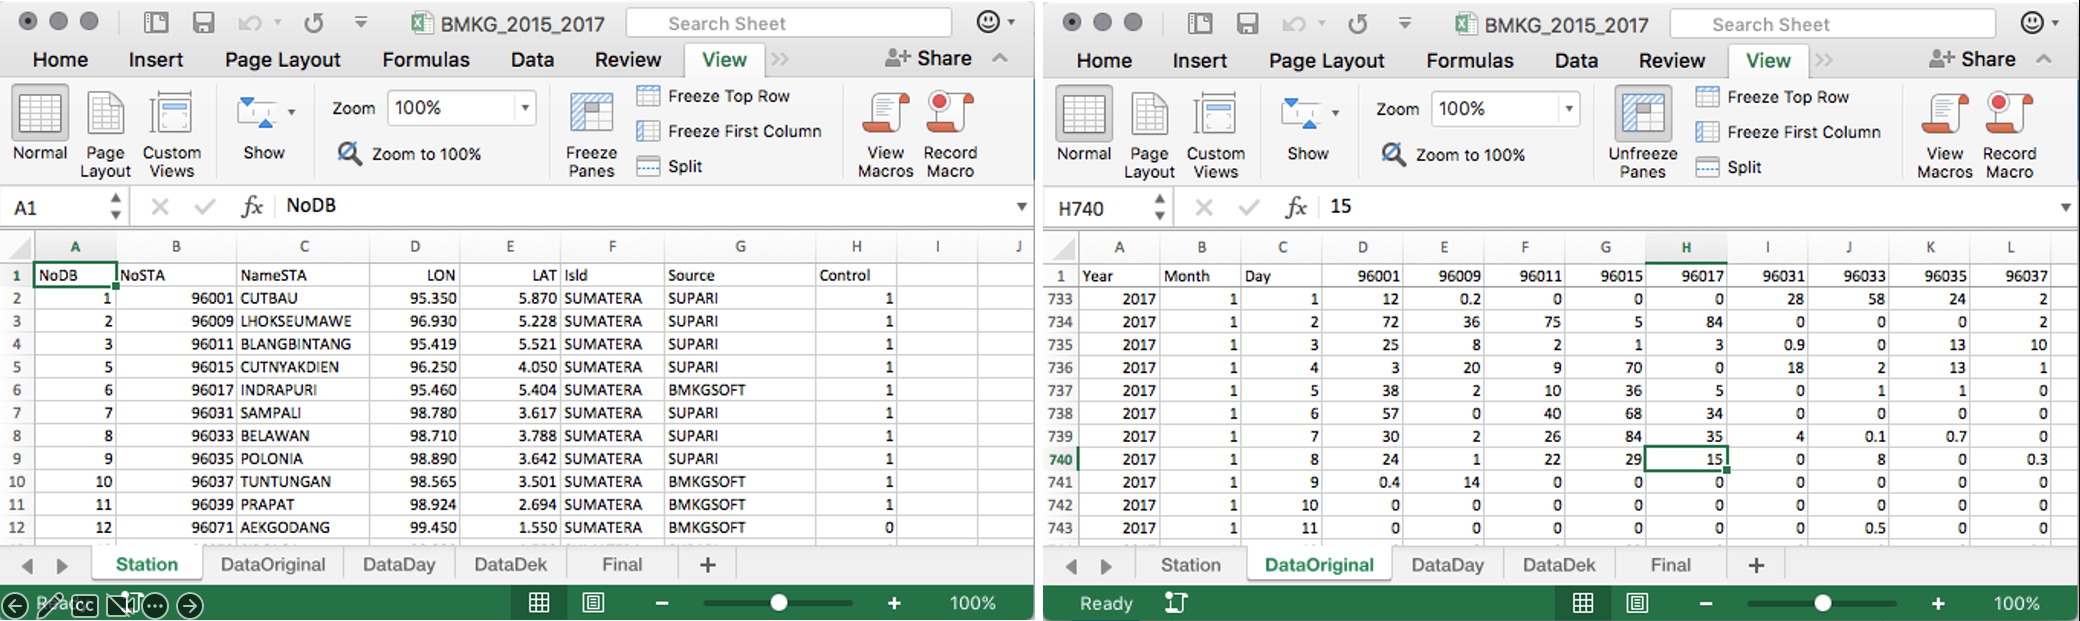
We will calculate dekad value from daily data. This can be done in many ways, we can use PIVOT or just using other simple formula.
Assign Dekad value on every Date
Merge year, month and day column into Date: YYYYMMDD
Merge year, month and dekad date into Date: YYYYMMDekad
Calculate the accumulation rainfall on each dekad. Try SUM IF with aray formula.
{SUM(IF(WORKSHEET!DATARANGE= DEKADDATE, WORKSHEET!DATARANGE))}
If using an array formula, make sure to confirmed with ctrl+shift+enter (not just enter) so that curly brackets appear around it {}. Those brackets can not be entered manually.
TRANSPOSE your data, and the format will be Station ID, Dekad Date, ..
You can add coordinate column using VLOOKUP, right after the Station ID. And your data are ready to add into GIS software.
Before adding to GIS software, copy final workbook into new one using PASTE VALUE. This is to make sure the final workbook doesn’t contain any formula. For the rainfall value, leave it only 2017 Dekad 1 data.
Load data as XY table
This step will use ArcGIS Desktop, but it is also possible to use other GIS software i.e. QGIS.
- ArcToolbox > Conversion Tools > Excel > Excel to Tables
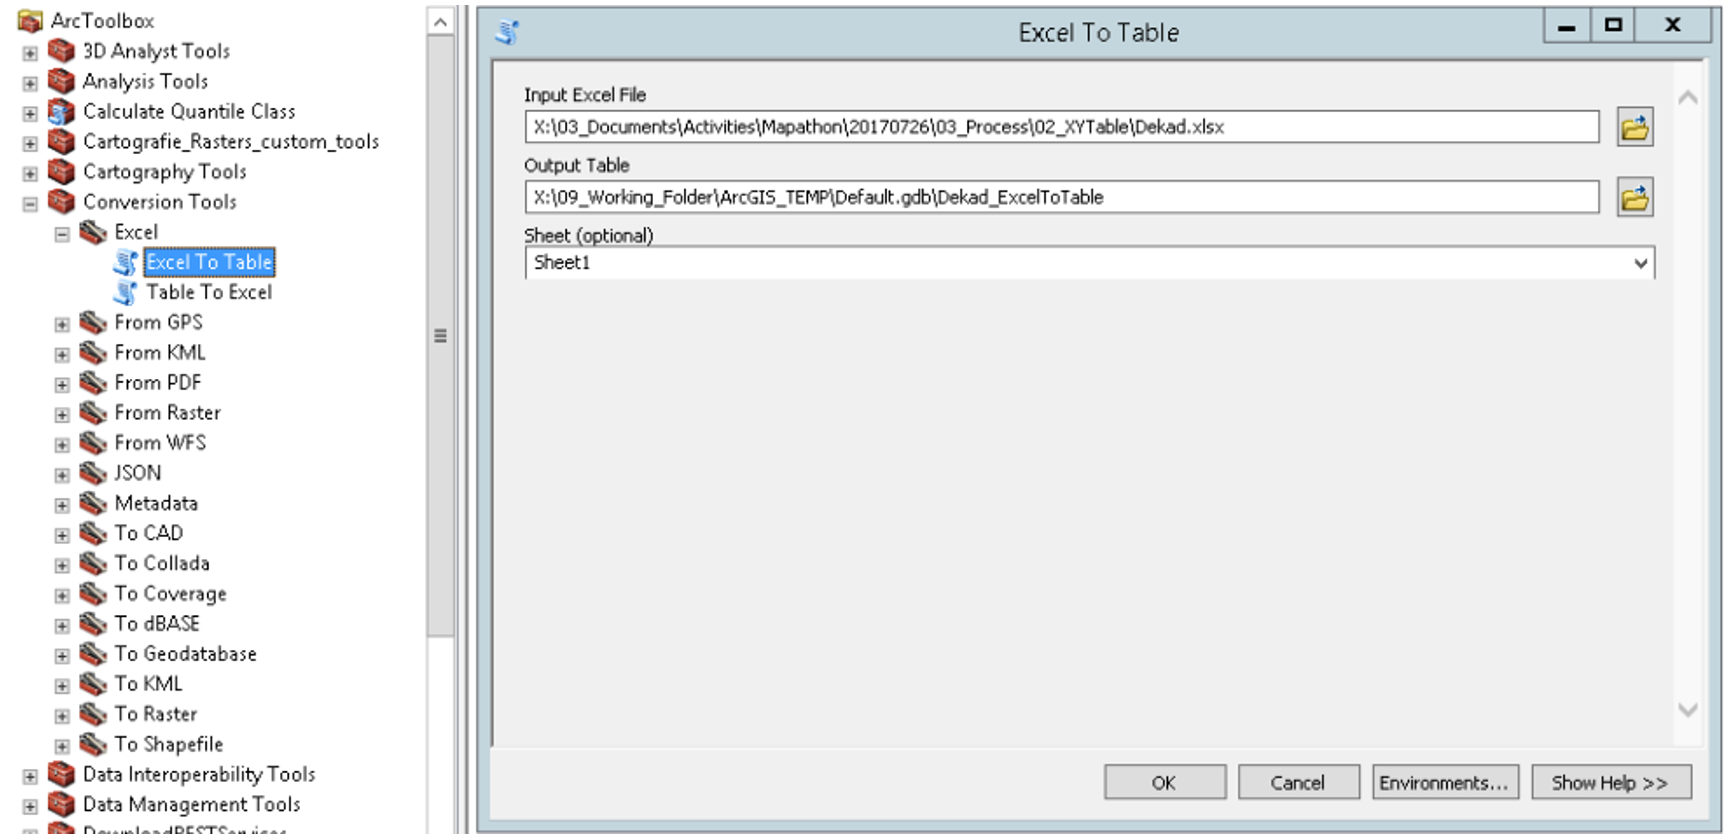
From table of content, right click > Display XY Data.
X Field for Longitude and Y Field for Latitude, and make sure the coordinate system of input is set to GCS_WGS_1984.
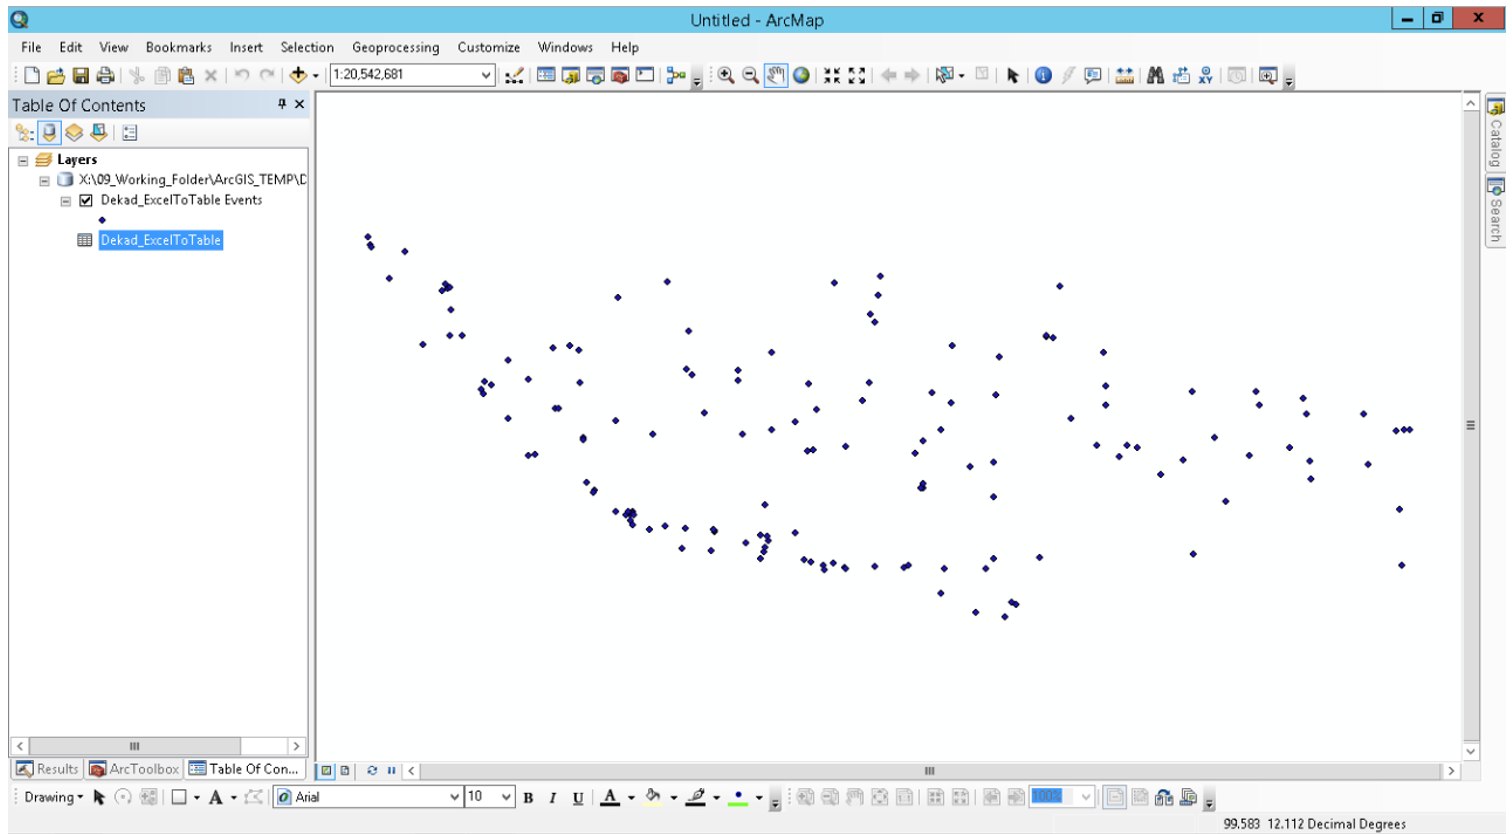
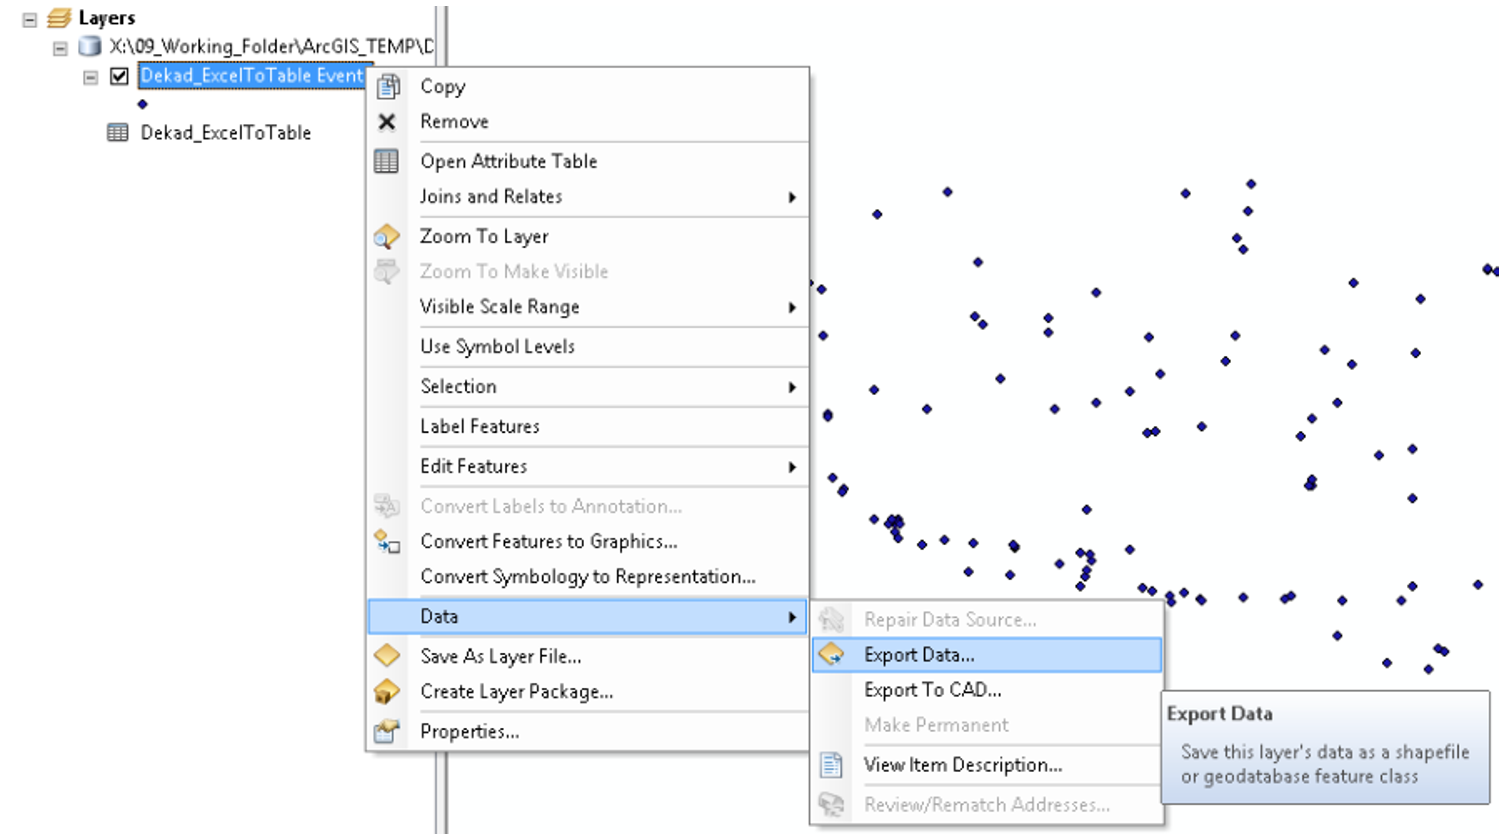
- Save the table events to shapefile. From Table of Content, right click the table events > Data > Export Data. Save as idn_cli_rpg_201701d1_bmkg_p.shp
Extract SPE value at station location
Load CHIRP data for Dekad 1, Jan 2017 and station data from the previous step.
- Extract RFE value at station location using ArcToolbox
- Spatial Analyst Tools > Extraction > Extract Values to Points
- Put observation data as Input point feature and CHIRP data as Input raster
- Save as CHIRP_Obs_point_extraction.shp
- After completed, open the attribute of CHIRP_Obs_point_extraction.shp by right click on the table of contents and Open Attribute Table.
- New column RASTERVALU added next to Observation data “201701D1”
- From ArcToolbox, go to Conversion Tools > Excel > Table to Excel. Convert CHIRP_Obs_point_extraction.shp table to spreadsheet.
Open the spreadsheet from previous step.
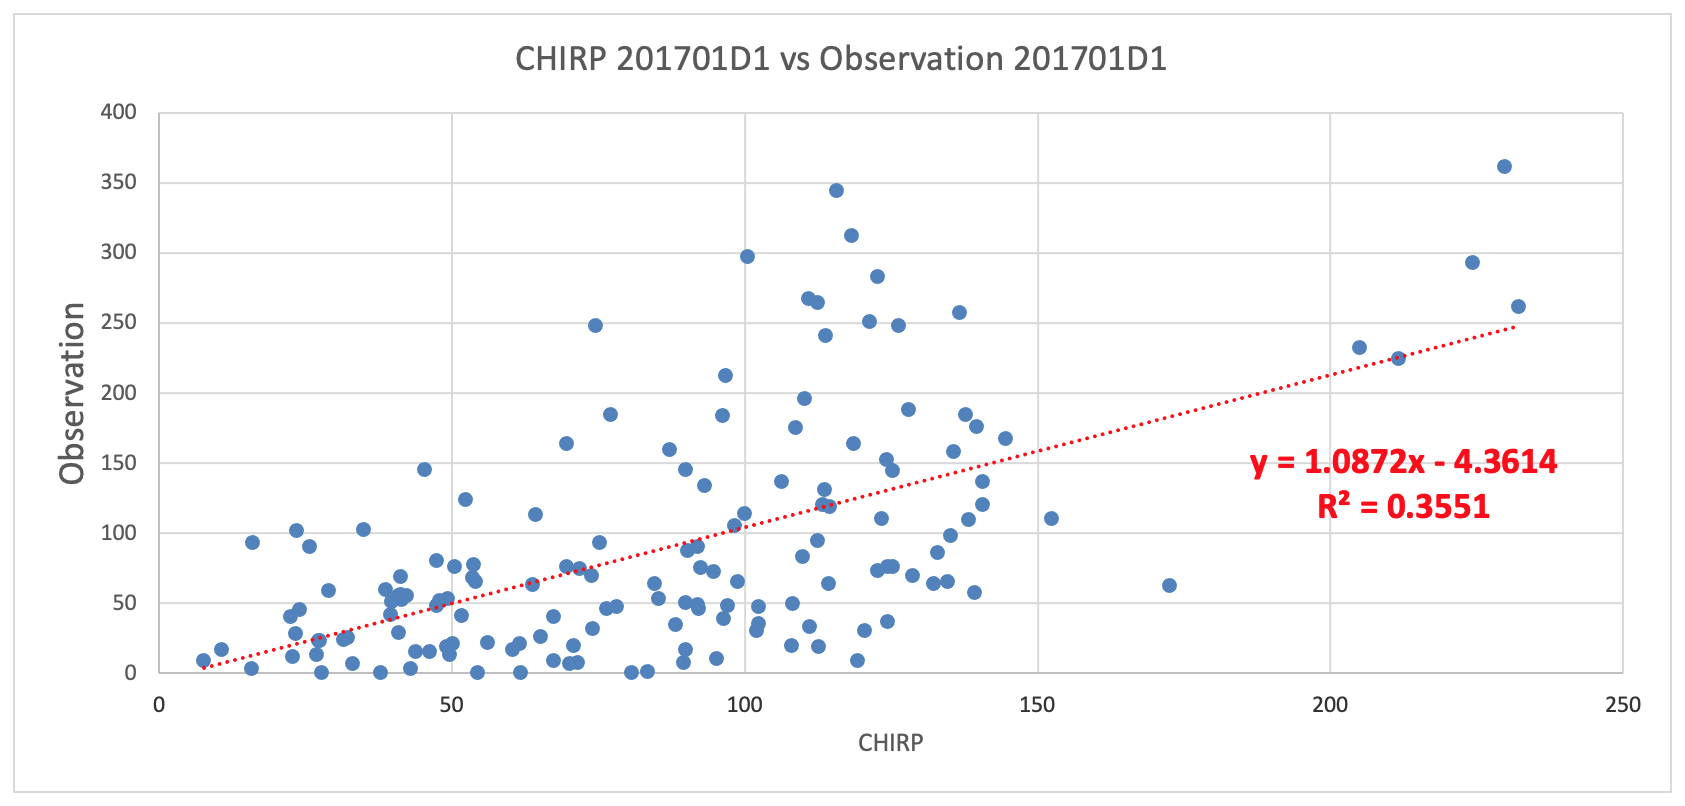
- Create scatter chart with observation data as Vertical axis and CHIRP data as Horizontal axis.
- Add Linear trendline and display equation on chart.
Regression model rainfall - SPE
Using the same spreadsheet,
- Add new column “Residual” next to CHIRP column.
- Using the equation on the chart, calculate the residuals value. Residu = Observation-(1.0872*CHIRP-4.3614)
- Add a new column again, called “ObsMinRFE”. Calculate the difference between Observation and CHIRP data.
- Compare the result.
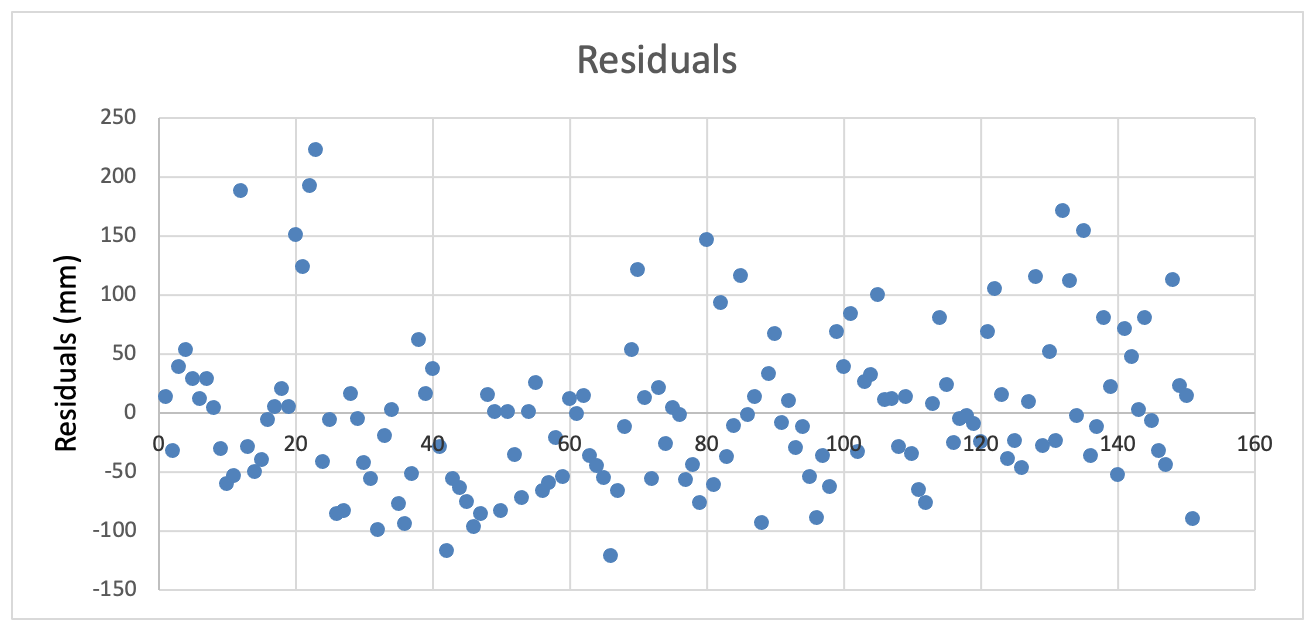
- You can also create Residual scatter chart, to see distribution from the data.
Kriging of residuals
Copy the data to new workbook, and save as new spreadsheet.

- Convert the new spreadsheet to table using ArcToolbox > Conversion Tools > Excel > Excel to Tables.
- From table of content, right click > Display XY Data.
- X Field for Longitude and Y Field for Latitude, and make sure the coordinate system of input is set to GCS_WGS_1984.
- Save the table events to shapefile. From Table of Content, right click the table events > Data > Export Data. Save as Residual.shp
Load Indonesia boundary file to ArcMap.
- Do Kriging Interpolation using Residual.shp as Input features and Residual column as Z value.
- ArcToolbox > Spatial Analyst Tools > Interpolation > Kriging
- Kriging method: Ordinary
- Output cell size: 0.05
- Klik Environments button. Find Processing Extent > Mask > Choose the Indonesia boundary – idn_bnd_adm1_2013_bps_a.shp. And Snap raster > idn_cli_CHIRP.2017.01.1.tif
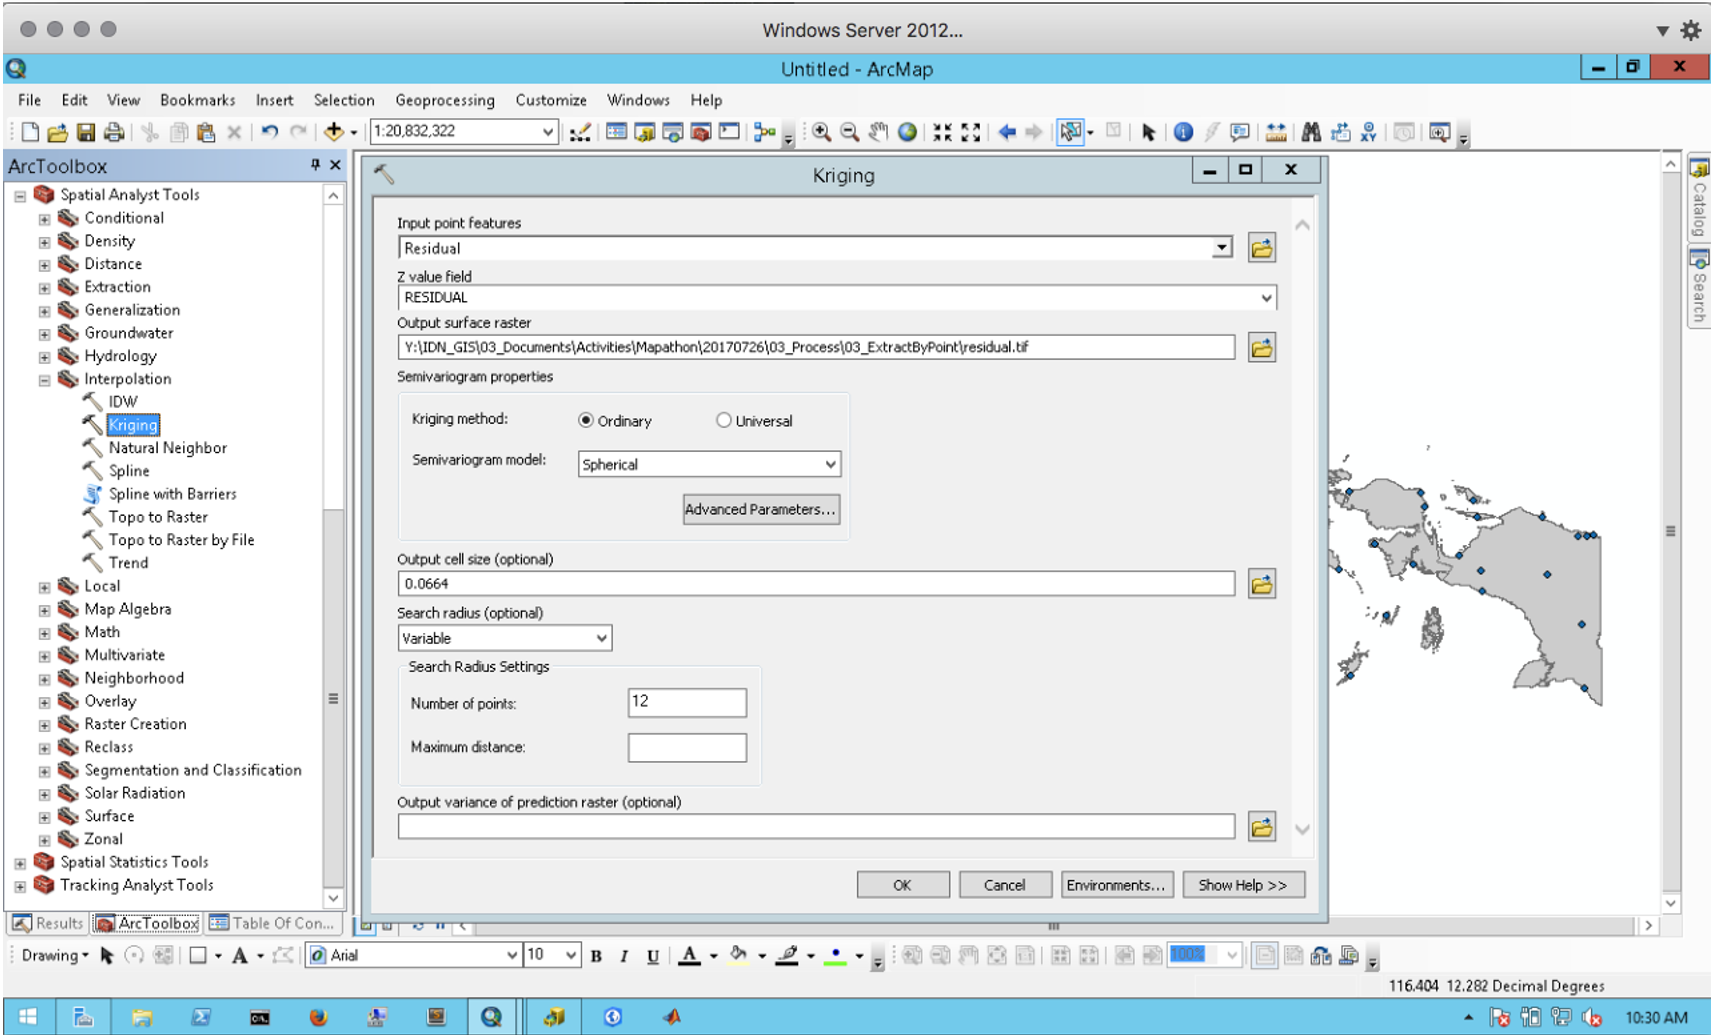
- After the interpolation result appears, you need to clip the result to remove data outside the boundary. Spatial Analyst Tools > Extraction > Extract by Mask.
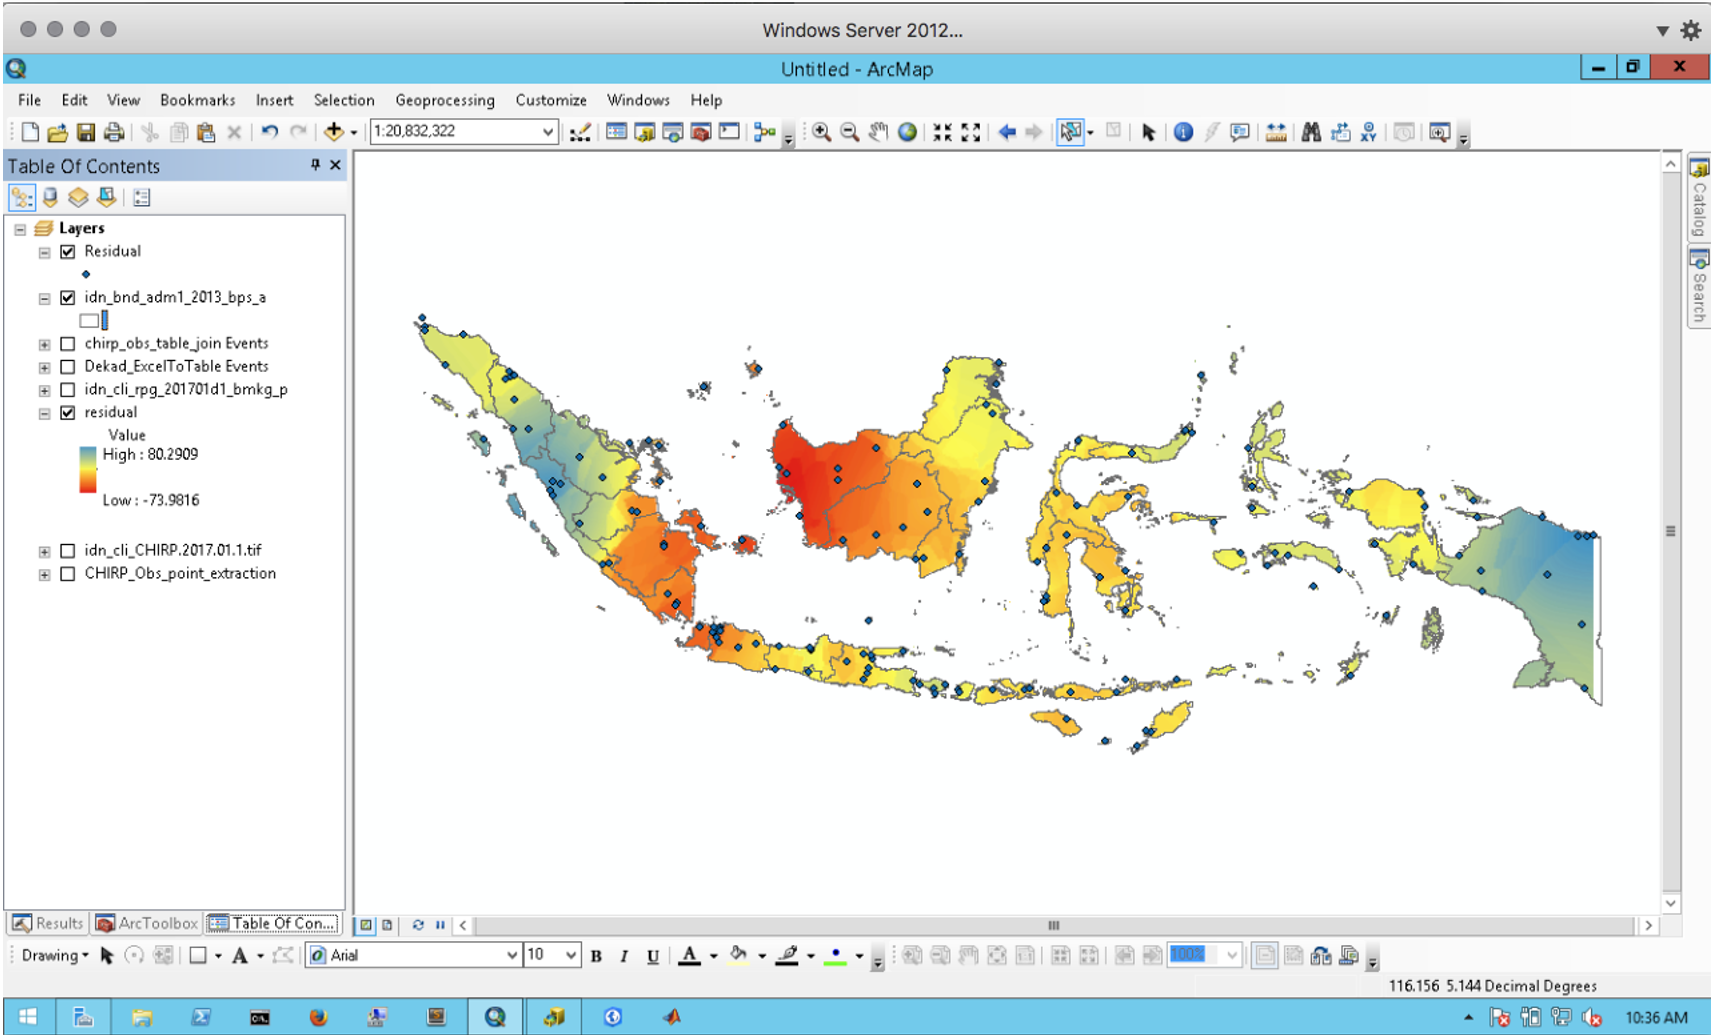
- Put residual.tif as Input raster, and idn_bnd_adm1_2013_bps_a.shp as Input raster or feature mask data
Blending Observation and CHIRP
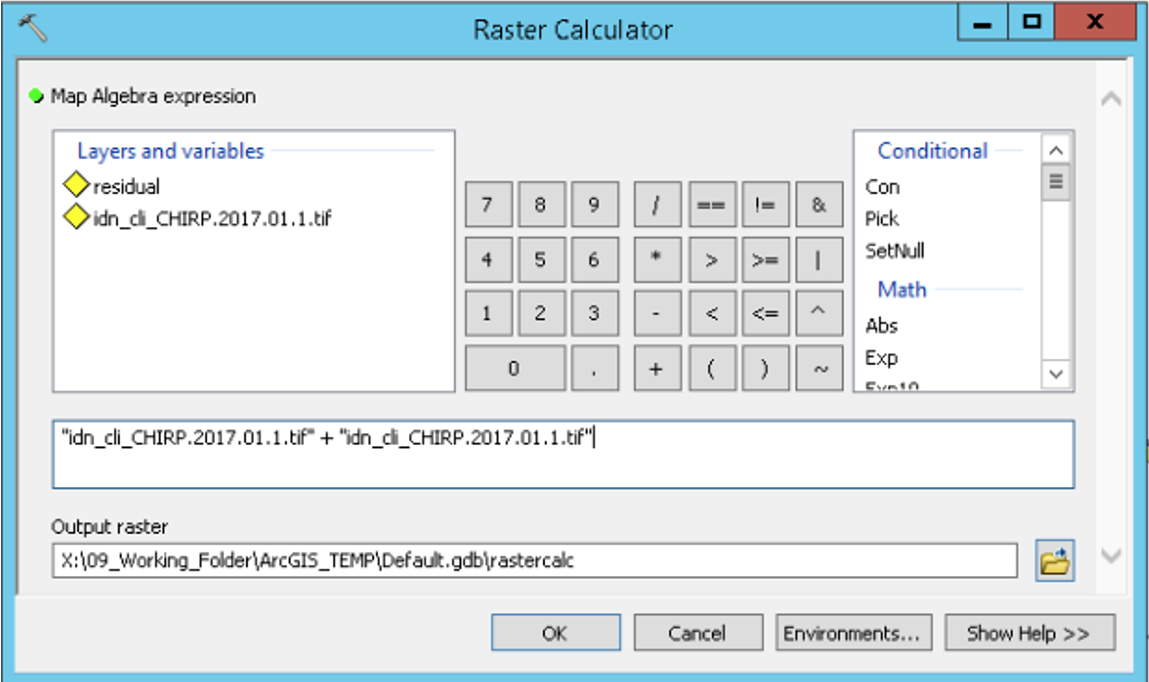
Final step is adding the residual to the SPE data.
- There are two ways to do the calculation, using Plus tool from Spatial Analysts Tools > Math > Plus. And using Raster Calculator from Spatial Analysts Tools > Map Algebra > Raster Calculator.
- Below is using Raster Calculator.
Final Result
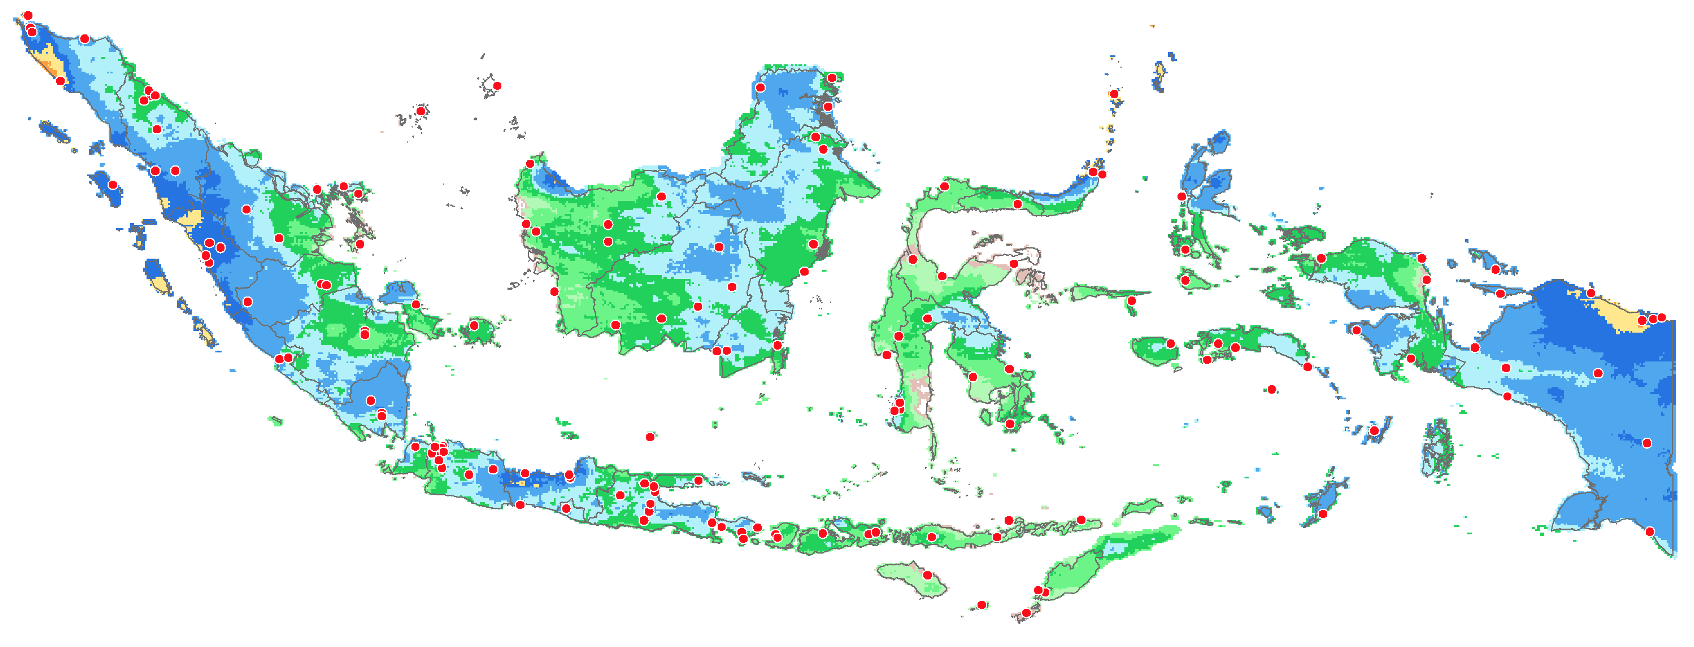
More station data?
Previous blending analysis used 152 station data. What if you have more than 1000 station data. Can you imagine the result?
Dekad 1, Jan 2017. Data 1000 station https://cl.ly/lhvm