OpenStreetMap Mapathon in Atambua
My office frequently conduct an OpenStreetMap (OSM) Mapathon series, to improve the quality and speed of disaster preparedness, response and recovery in Indonesia through the development of an up to date and detailed base map for decision-makers and planners.
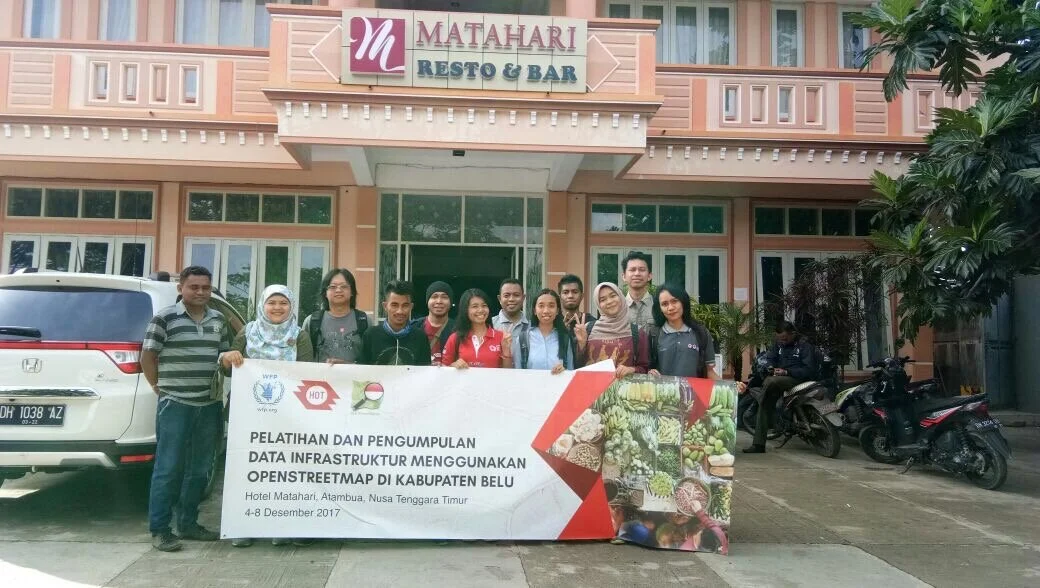
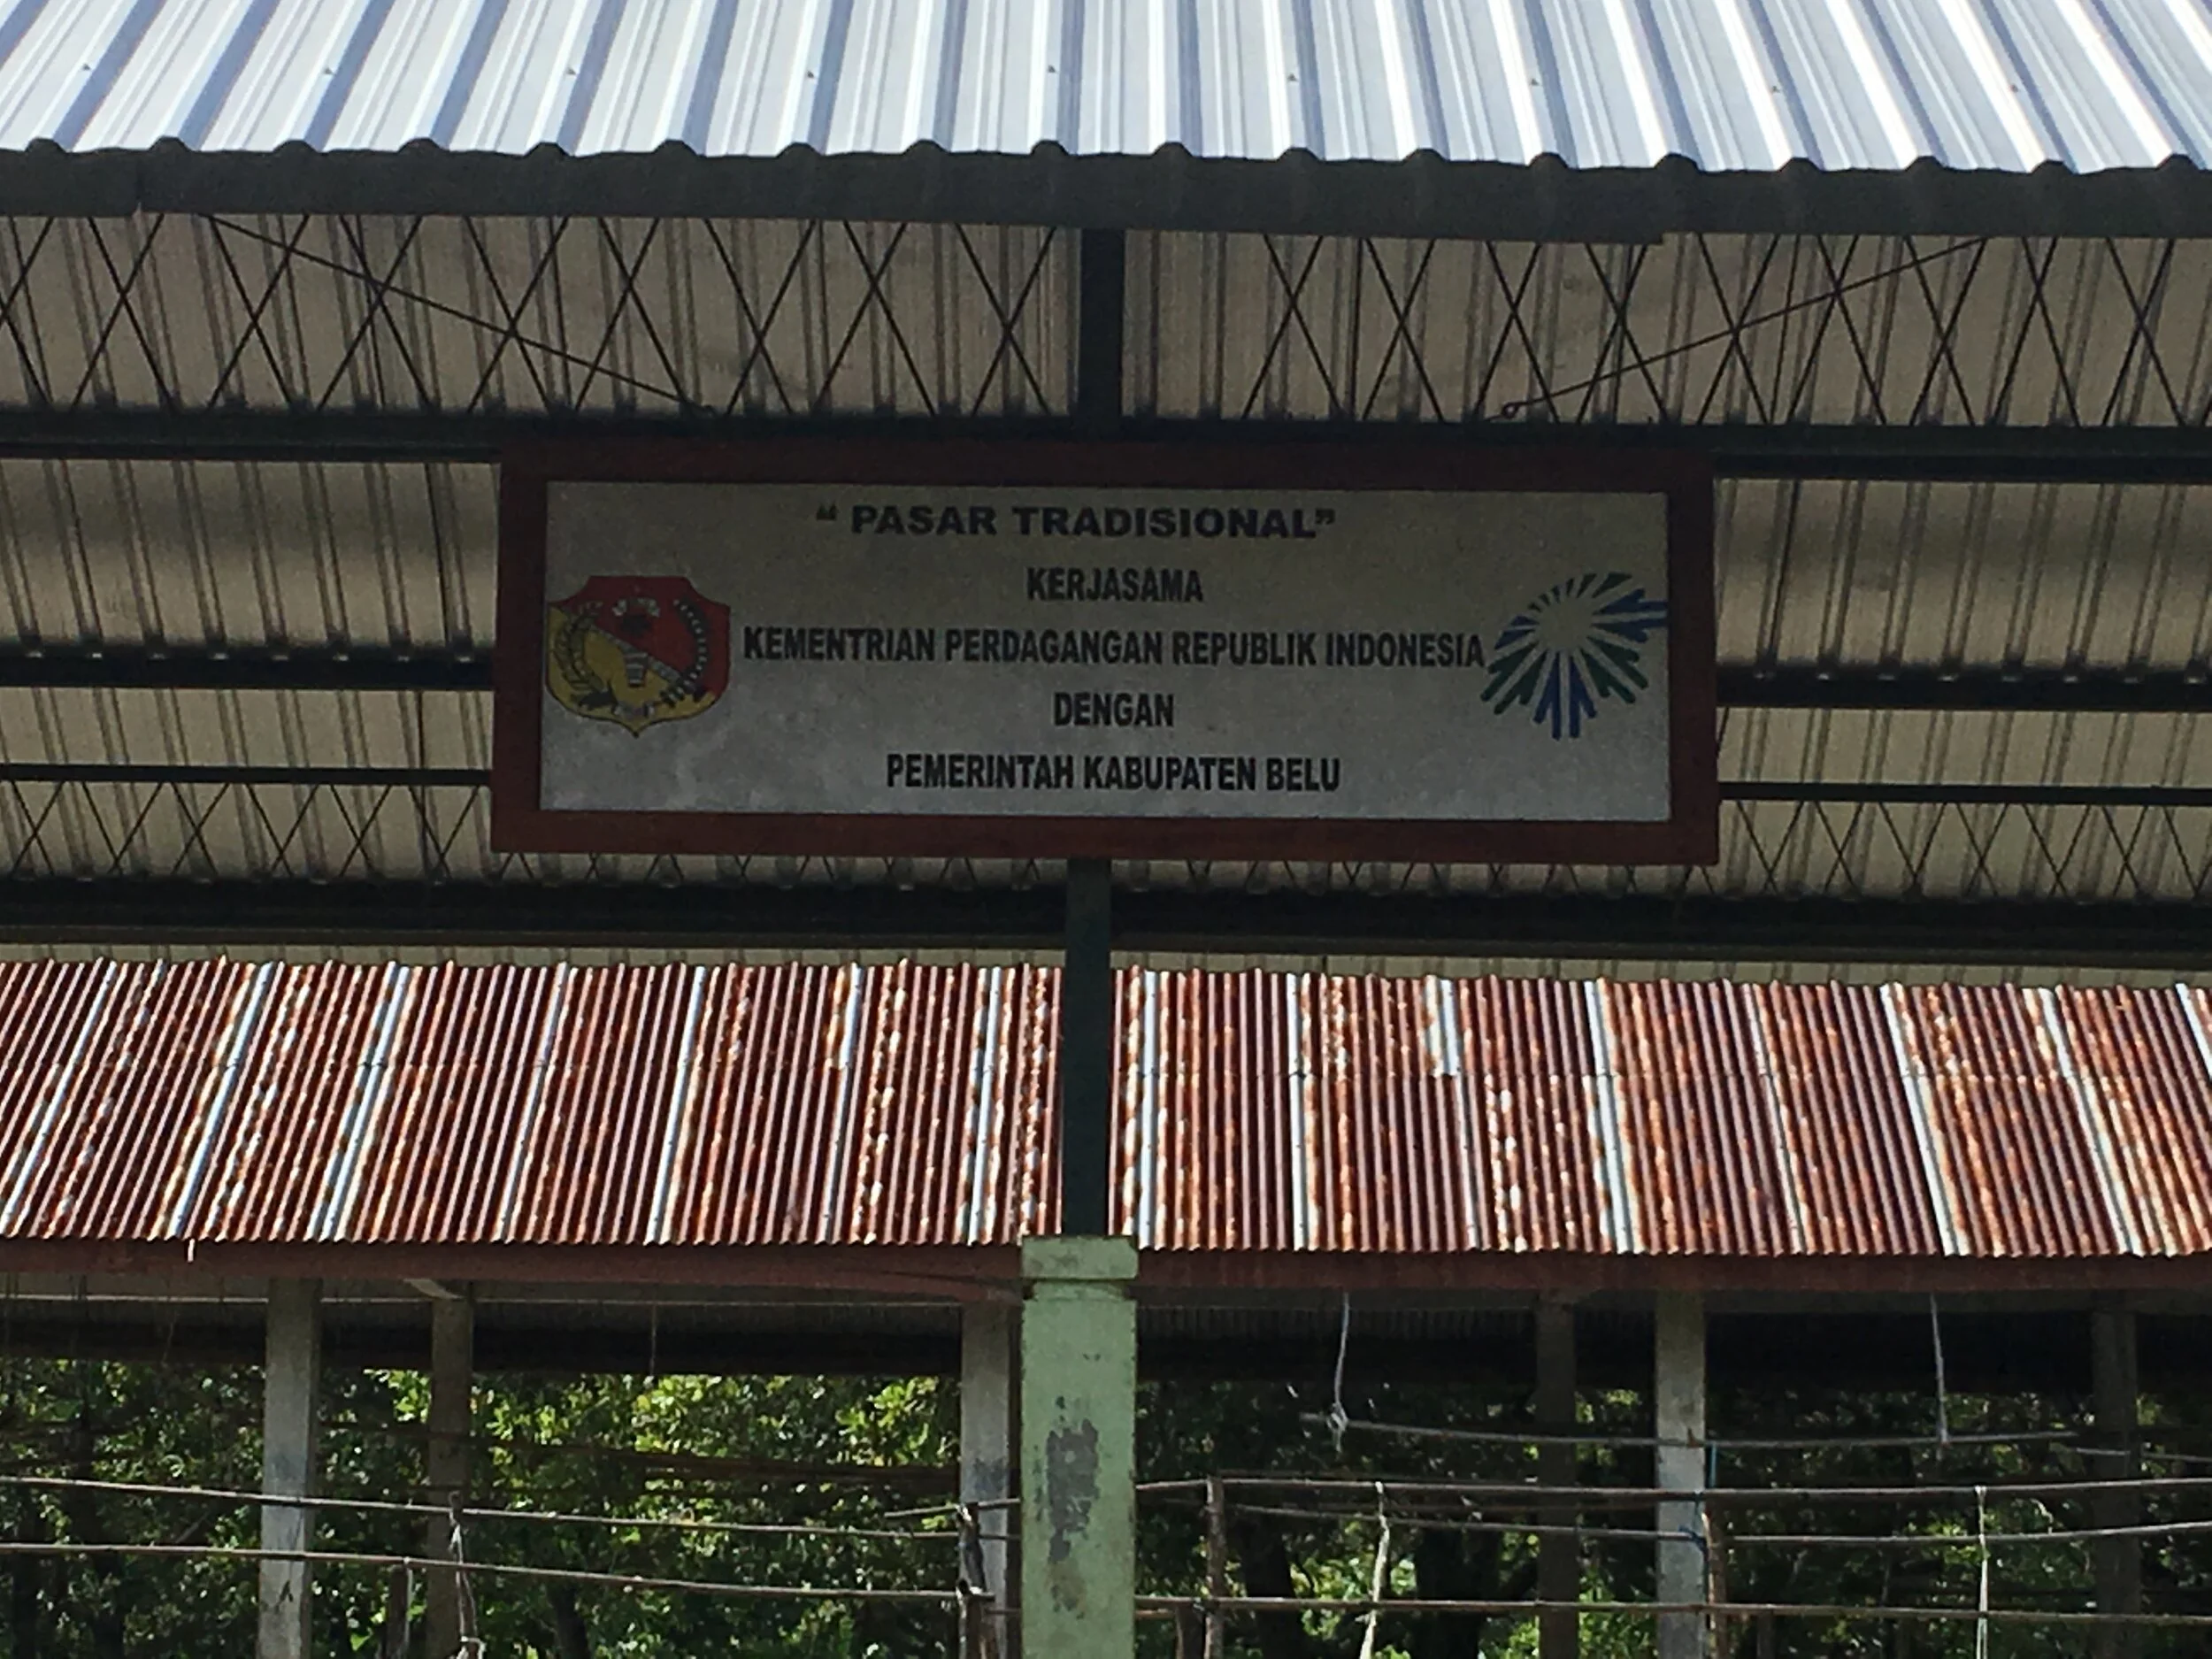
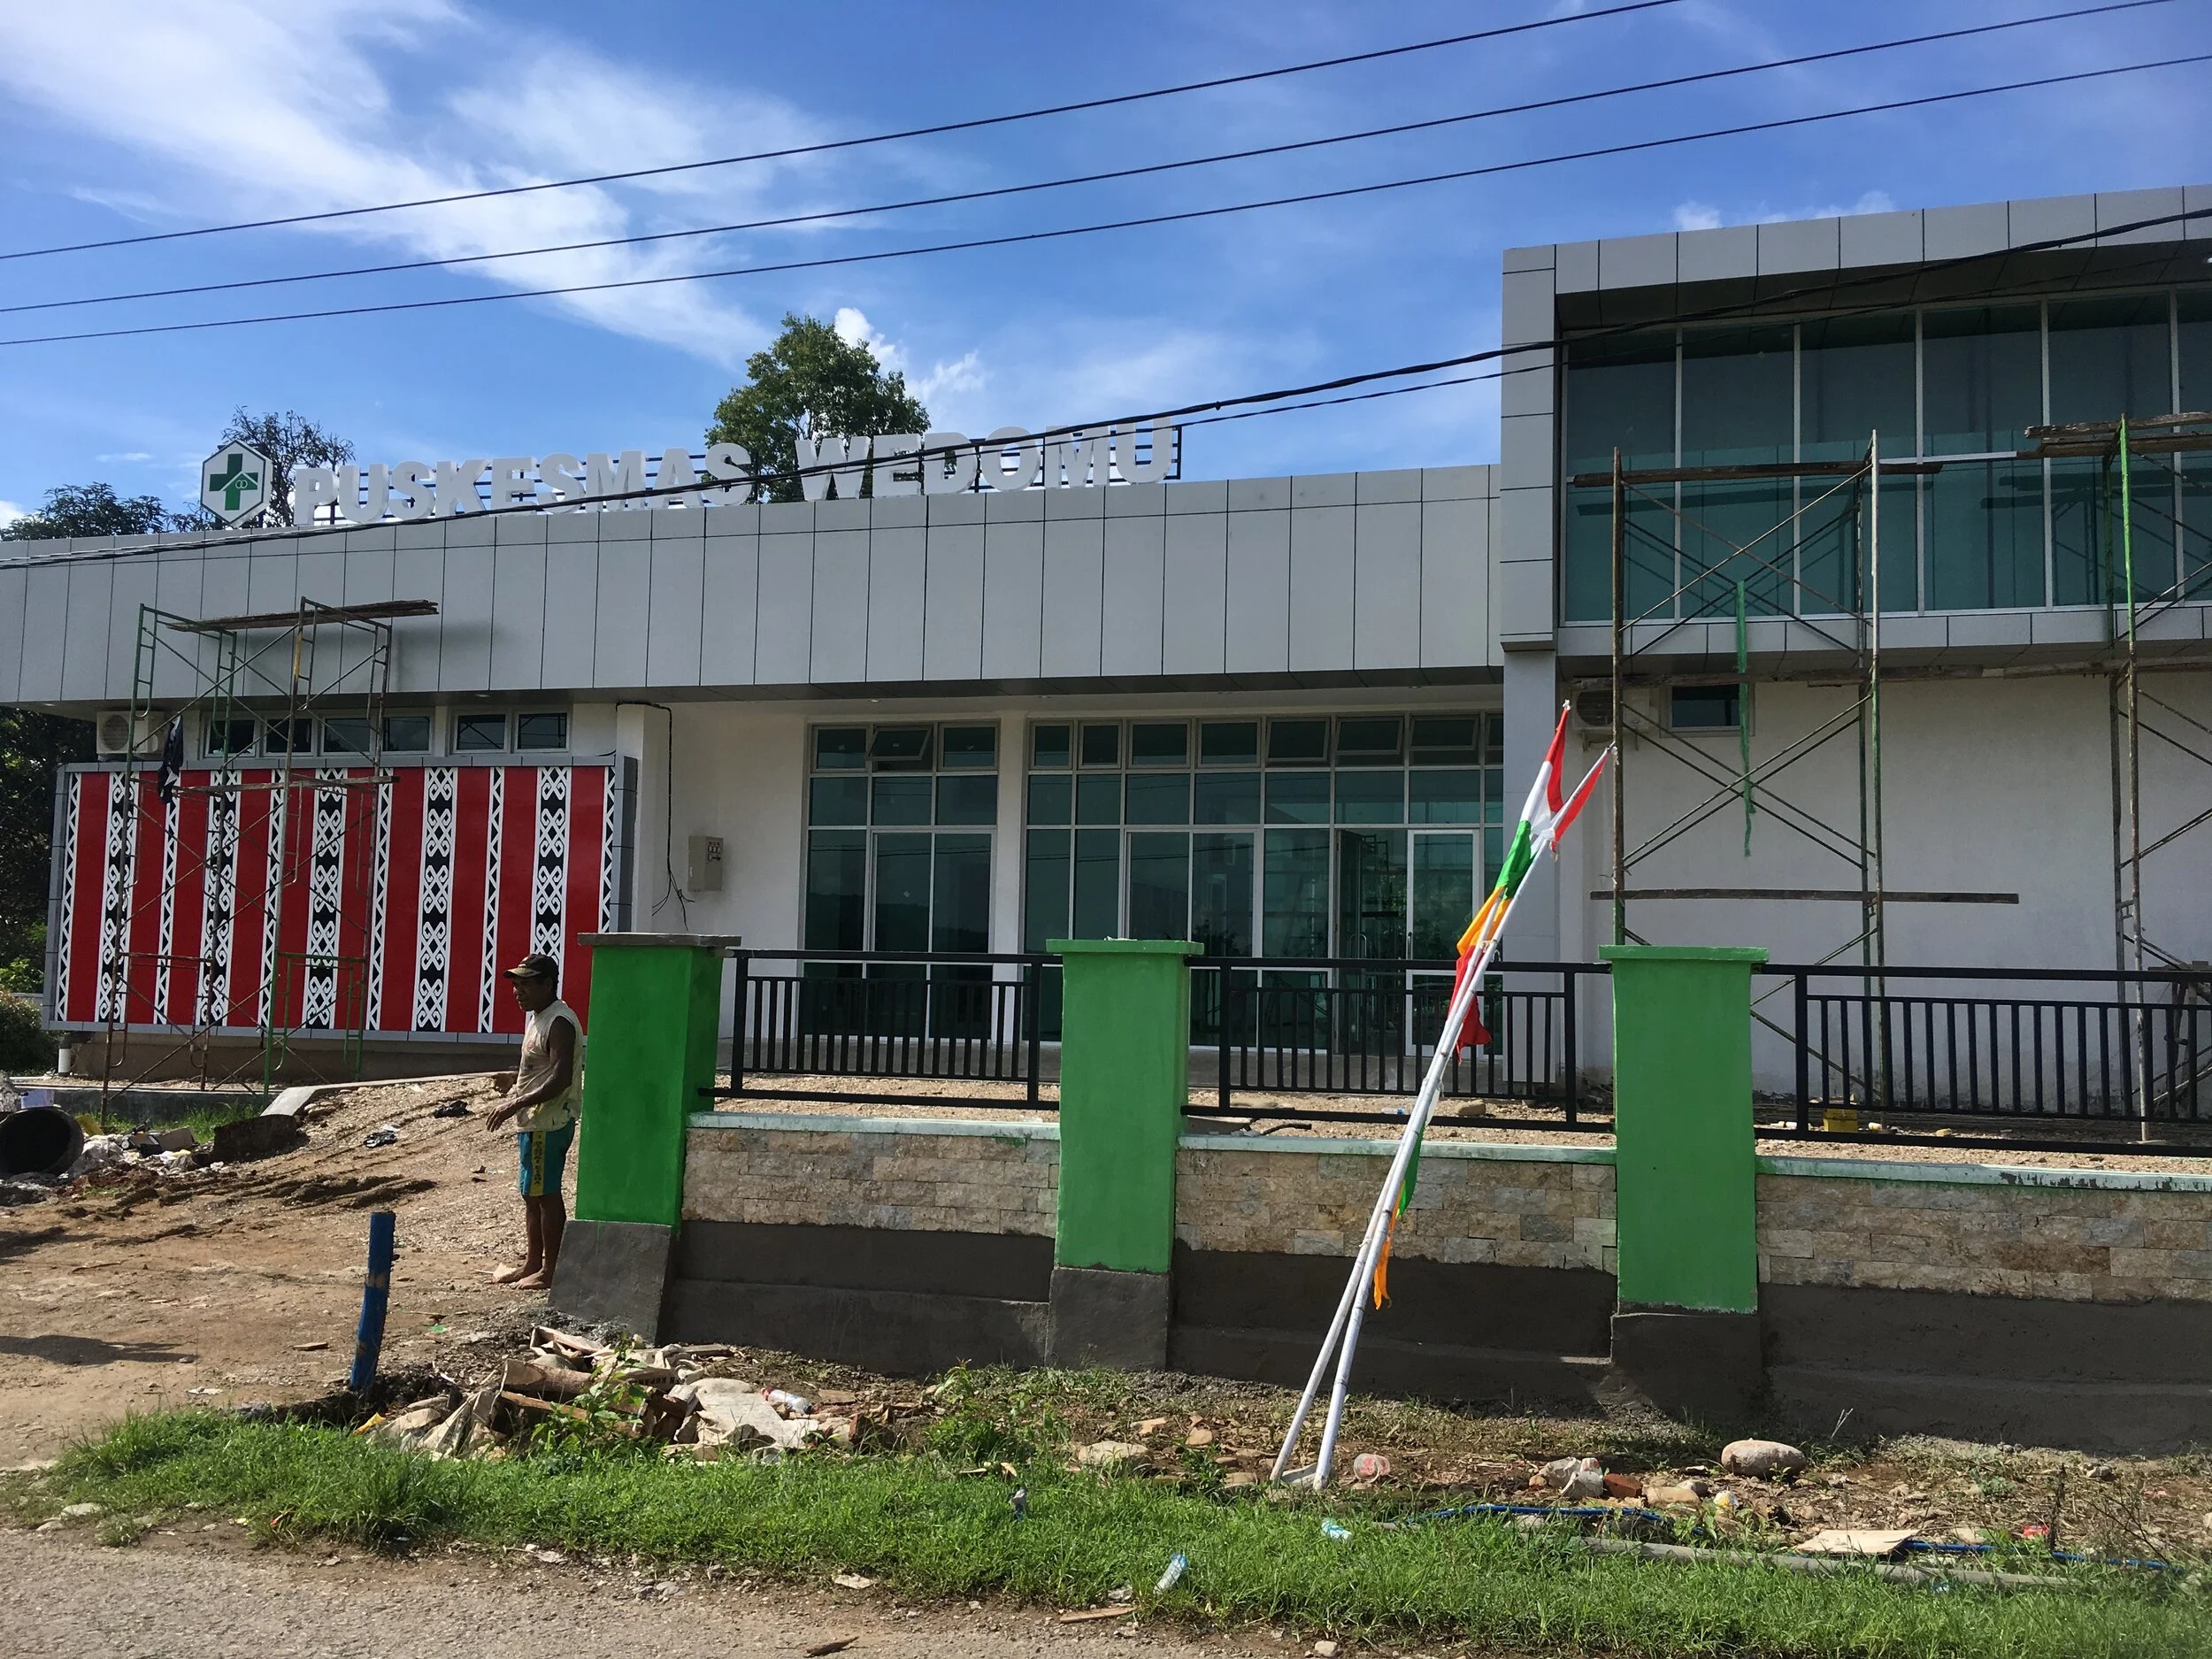
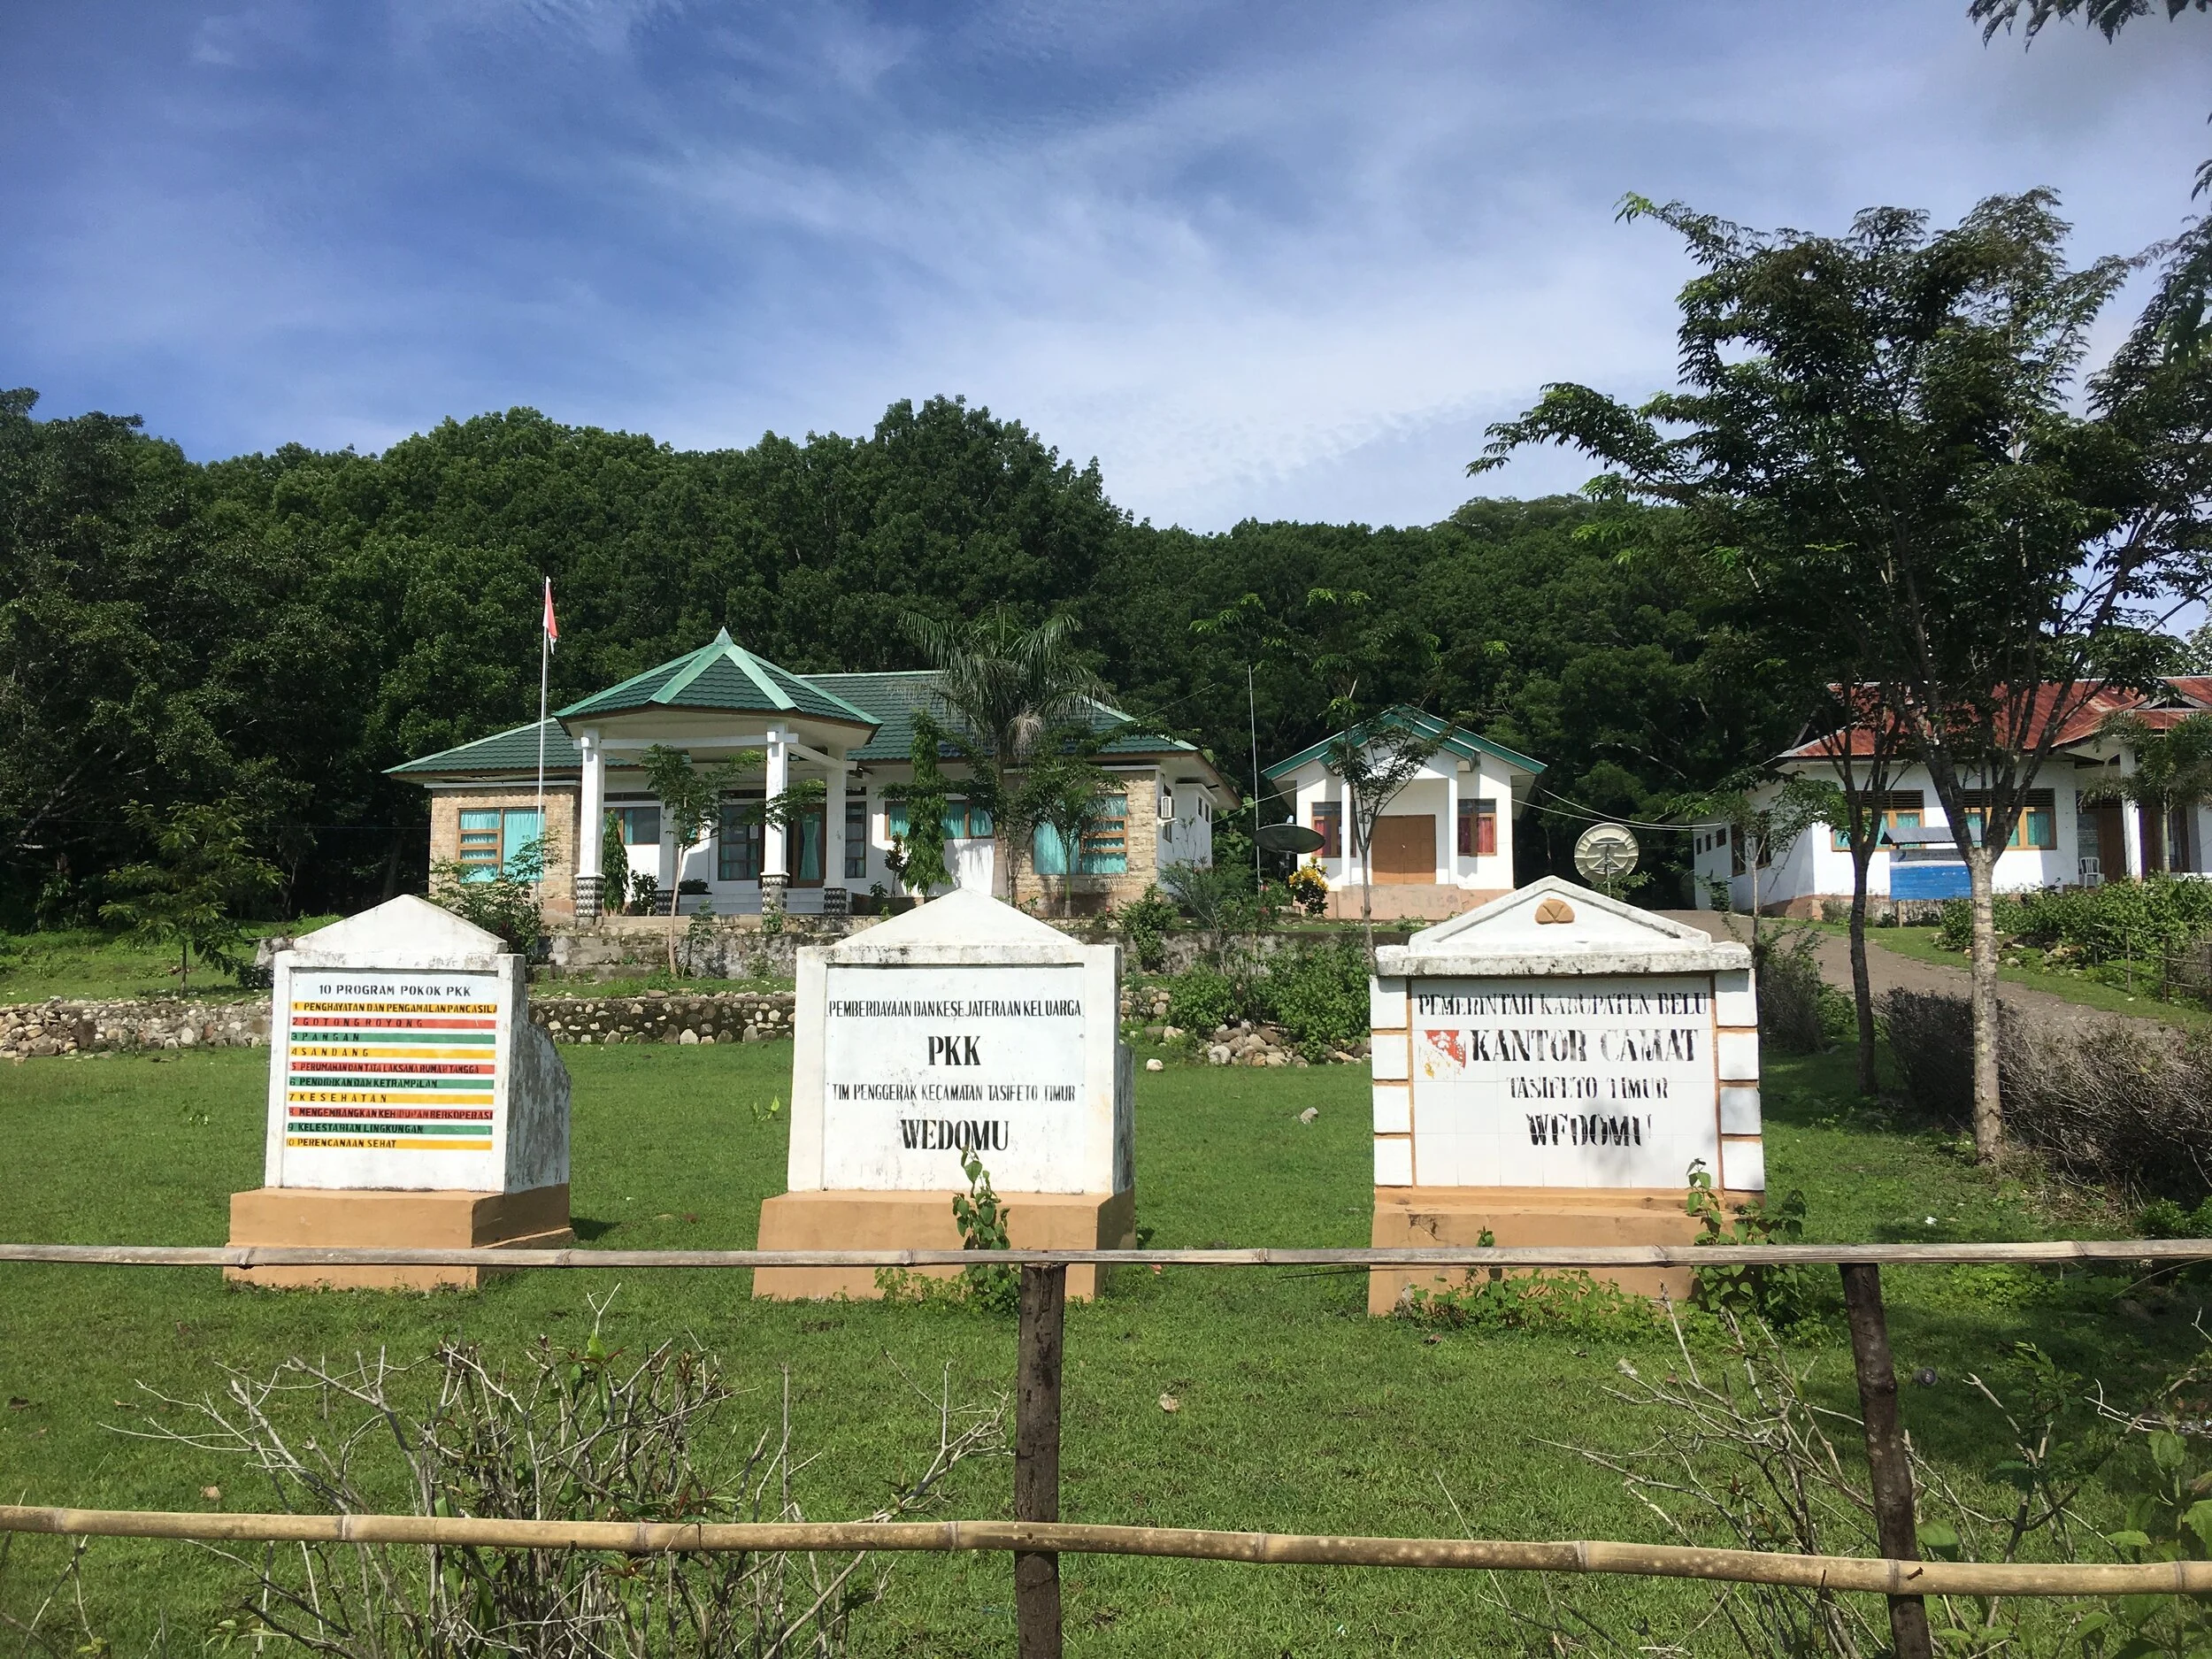
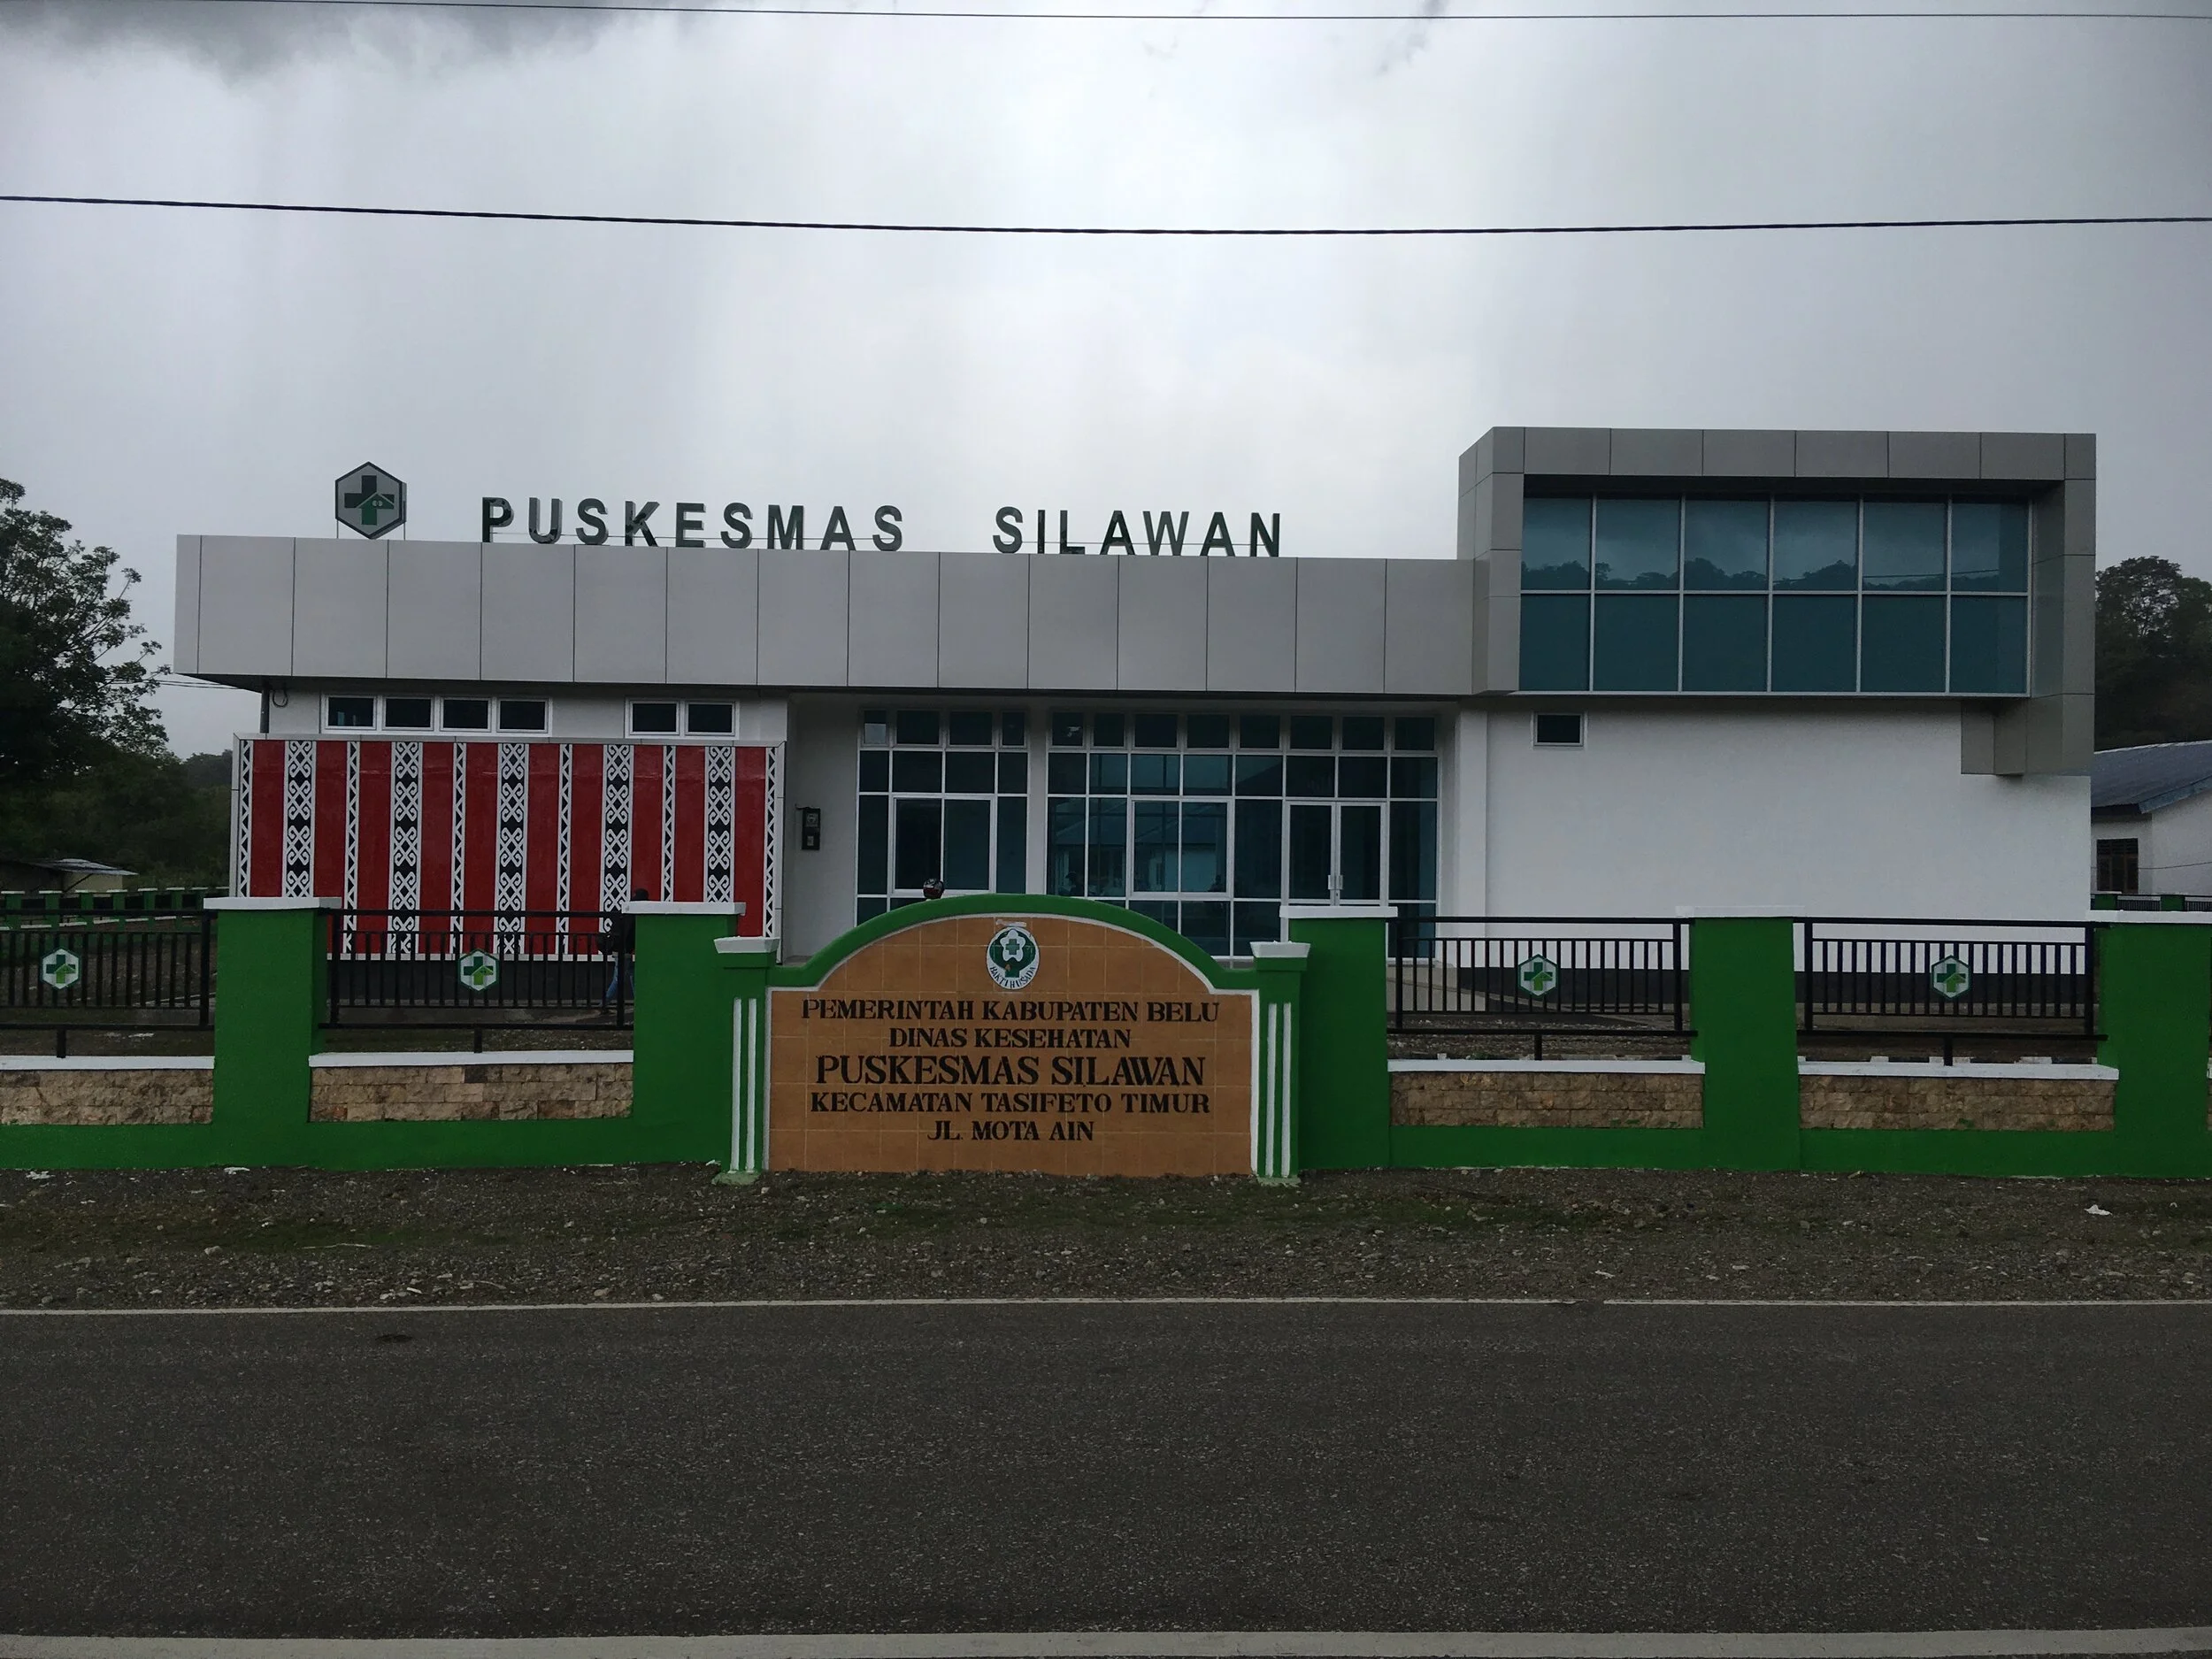
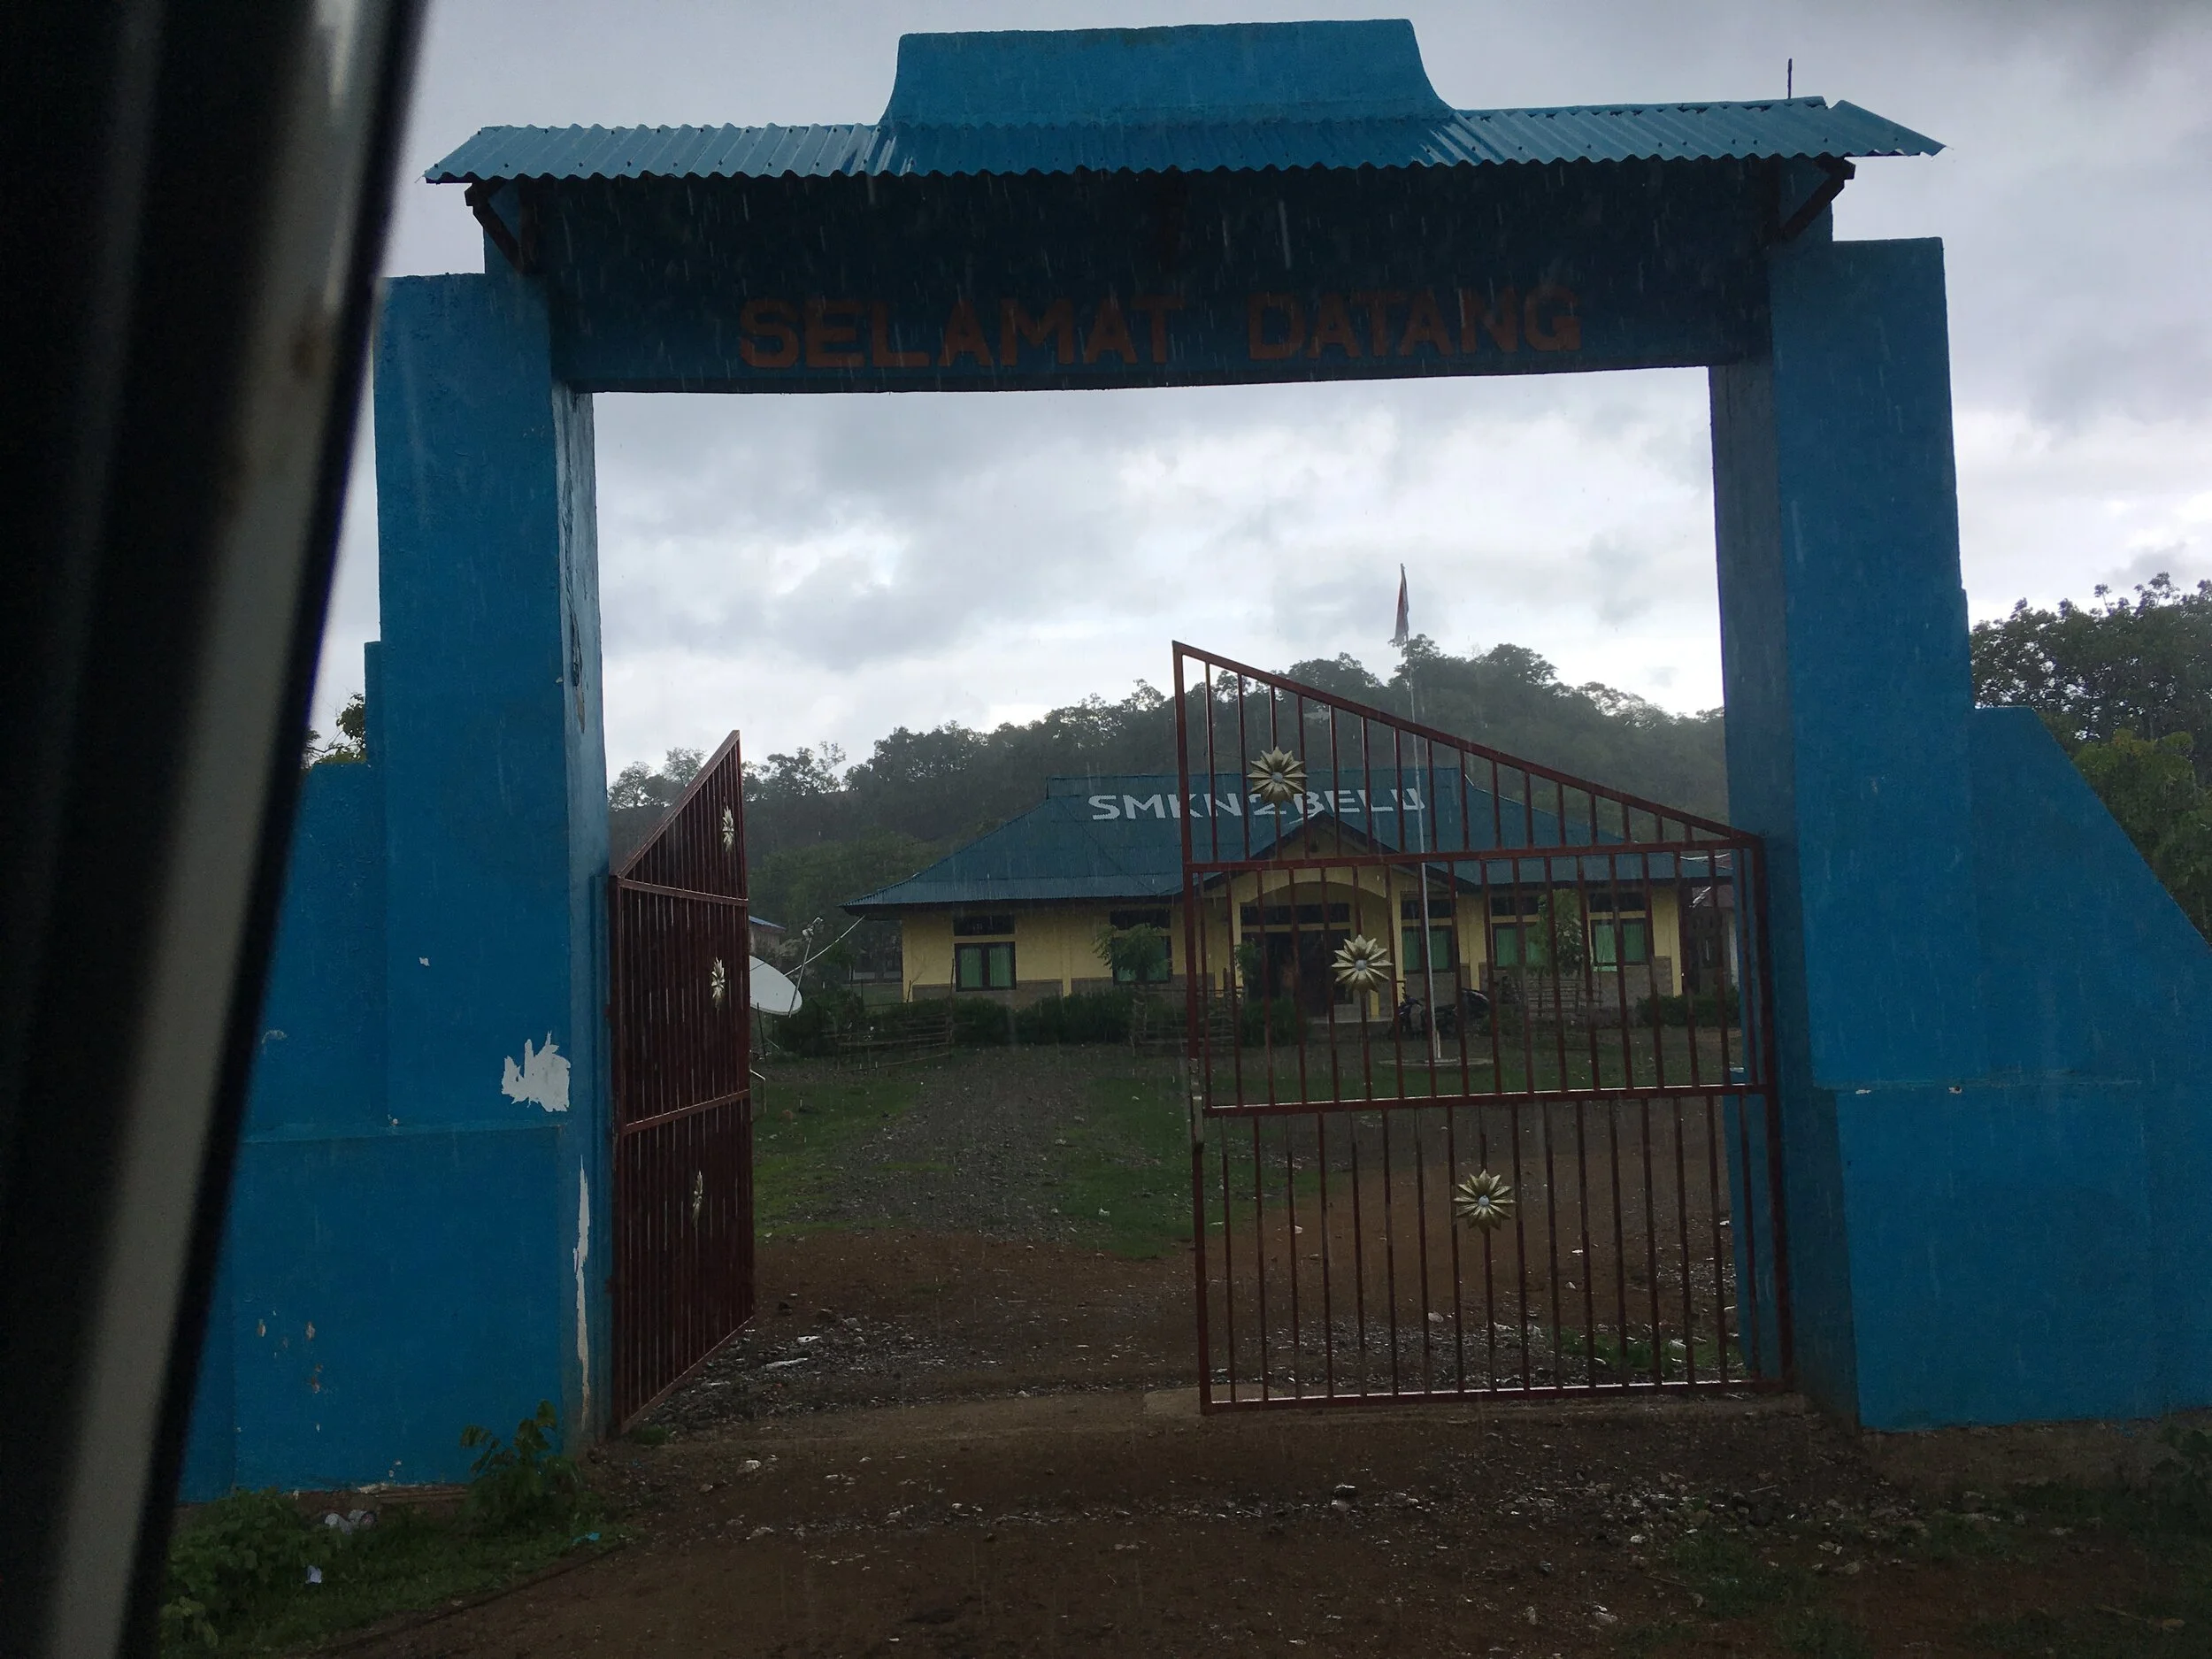
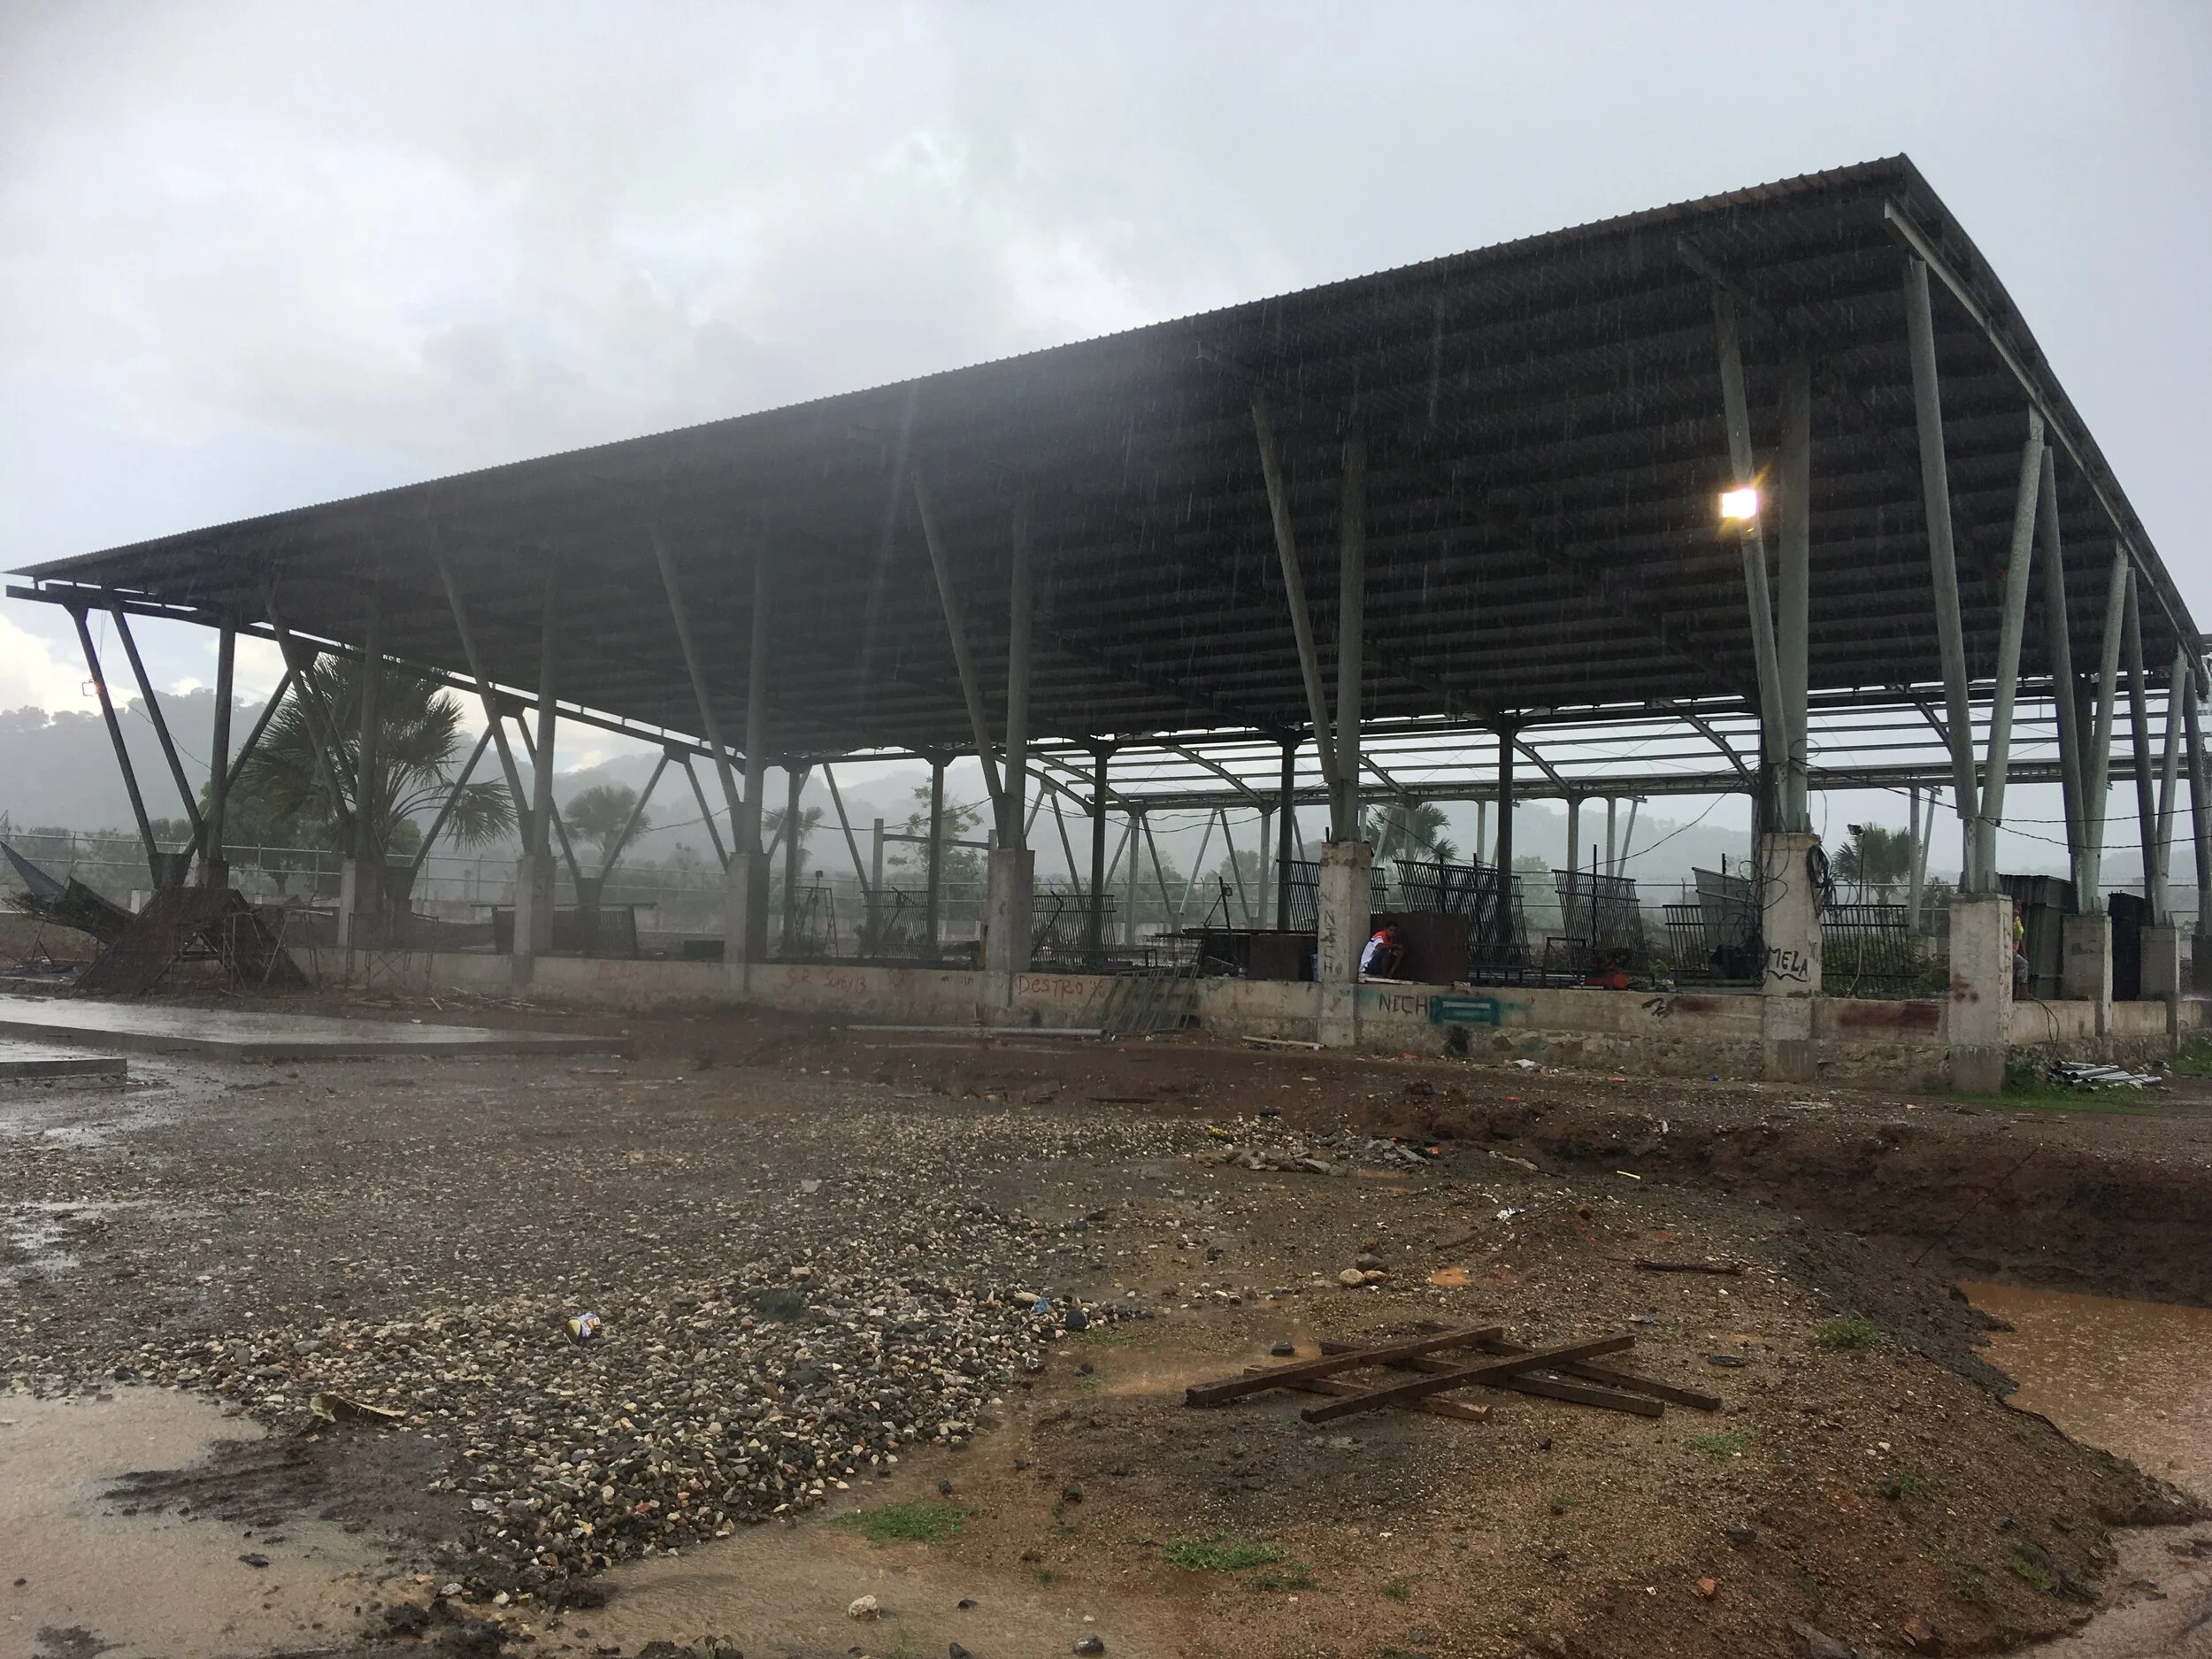
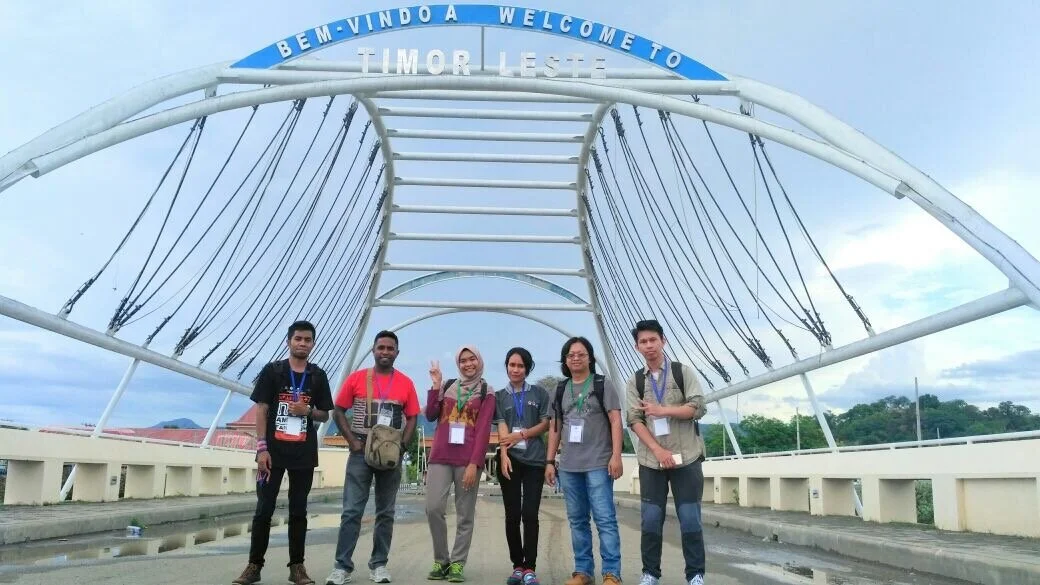
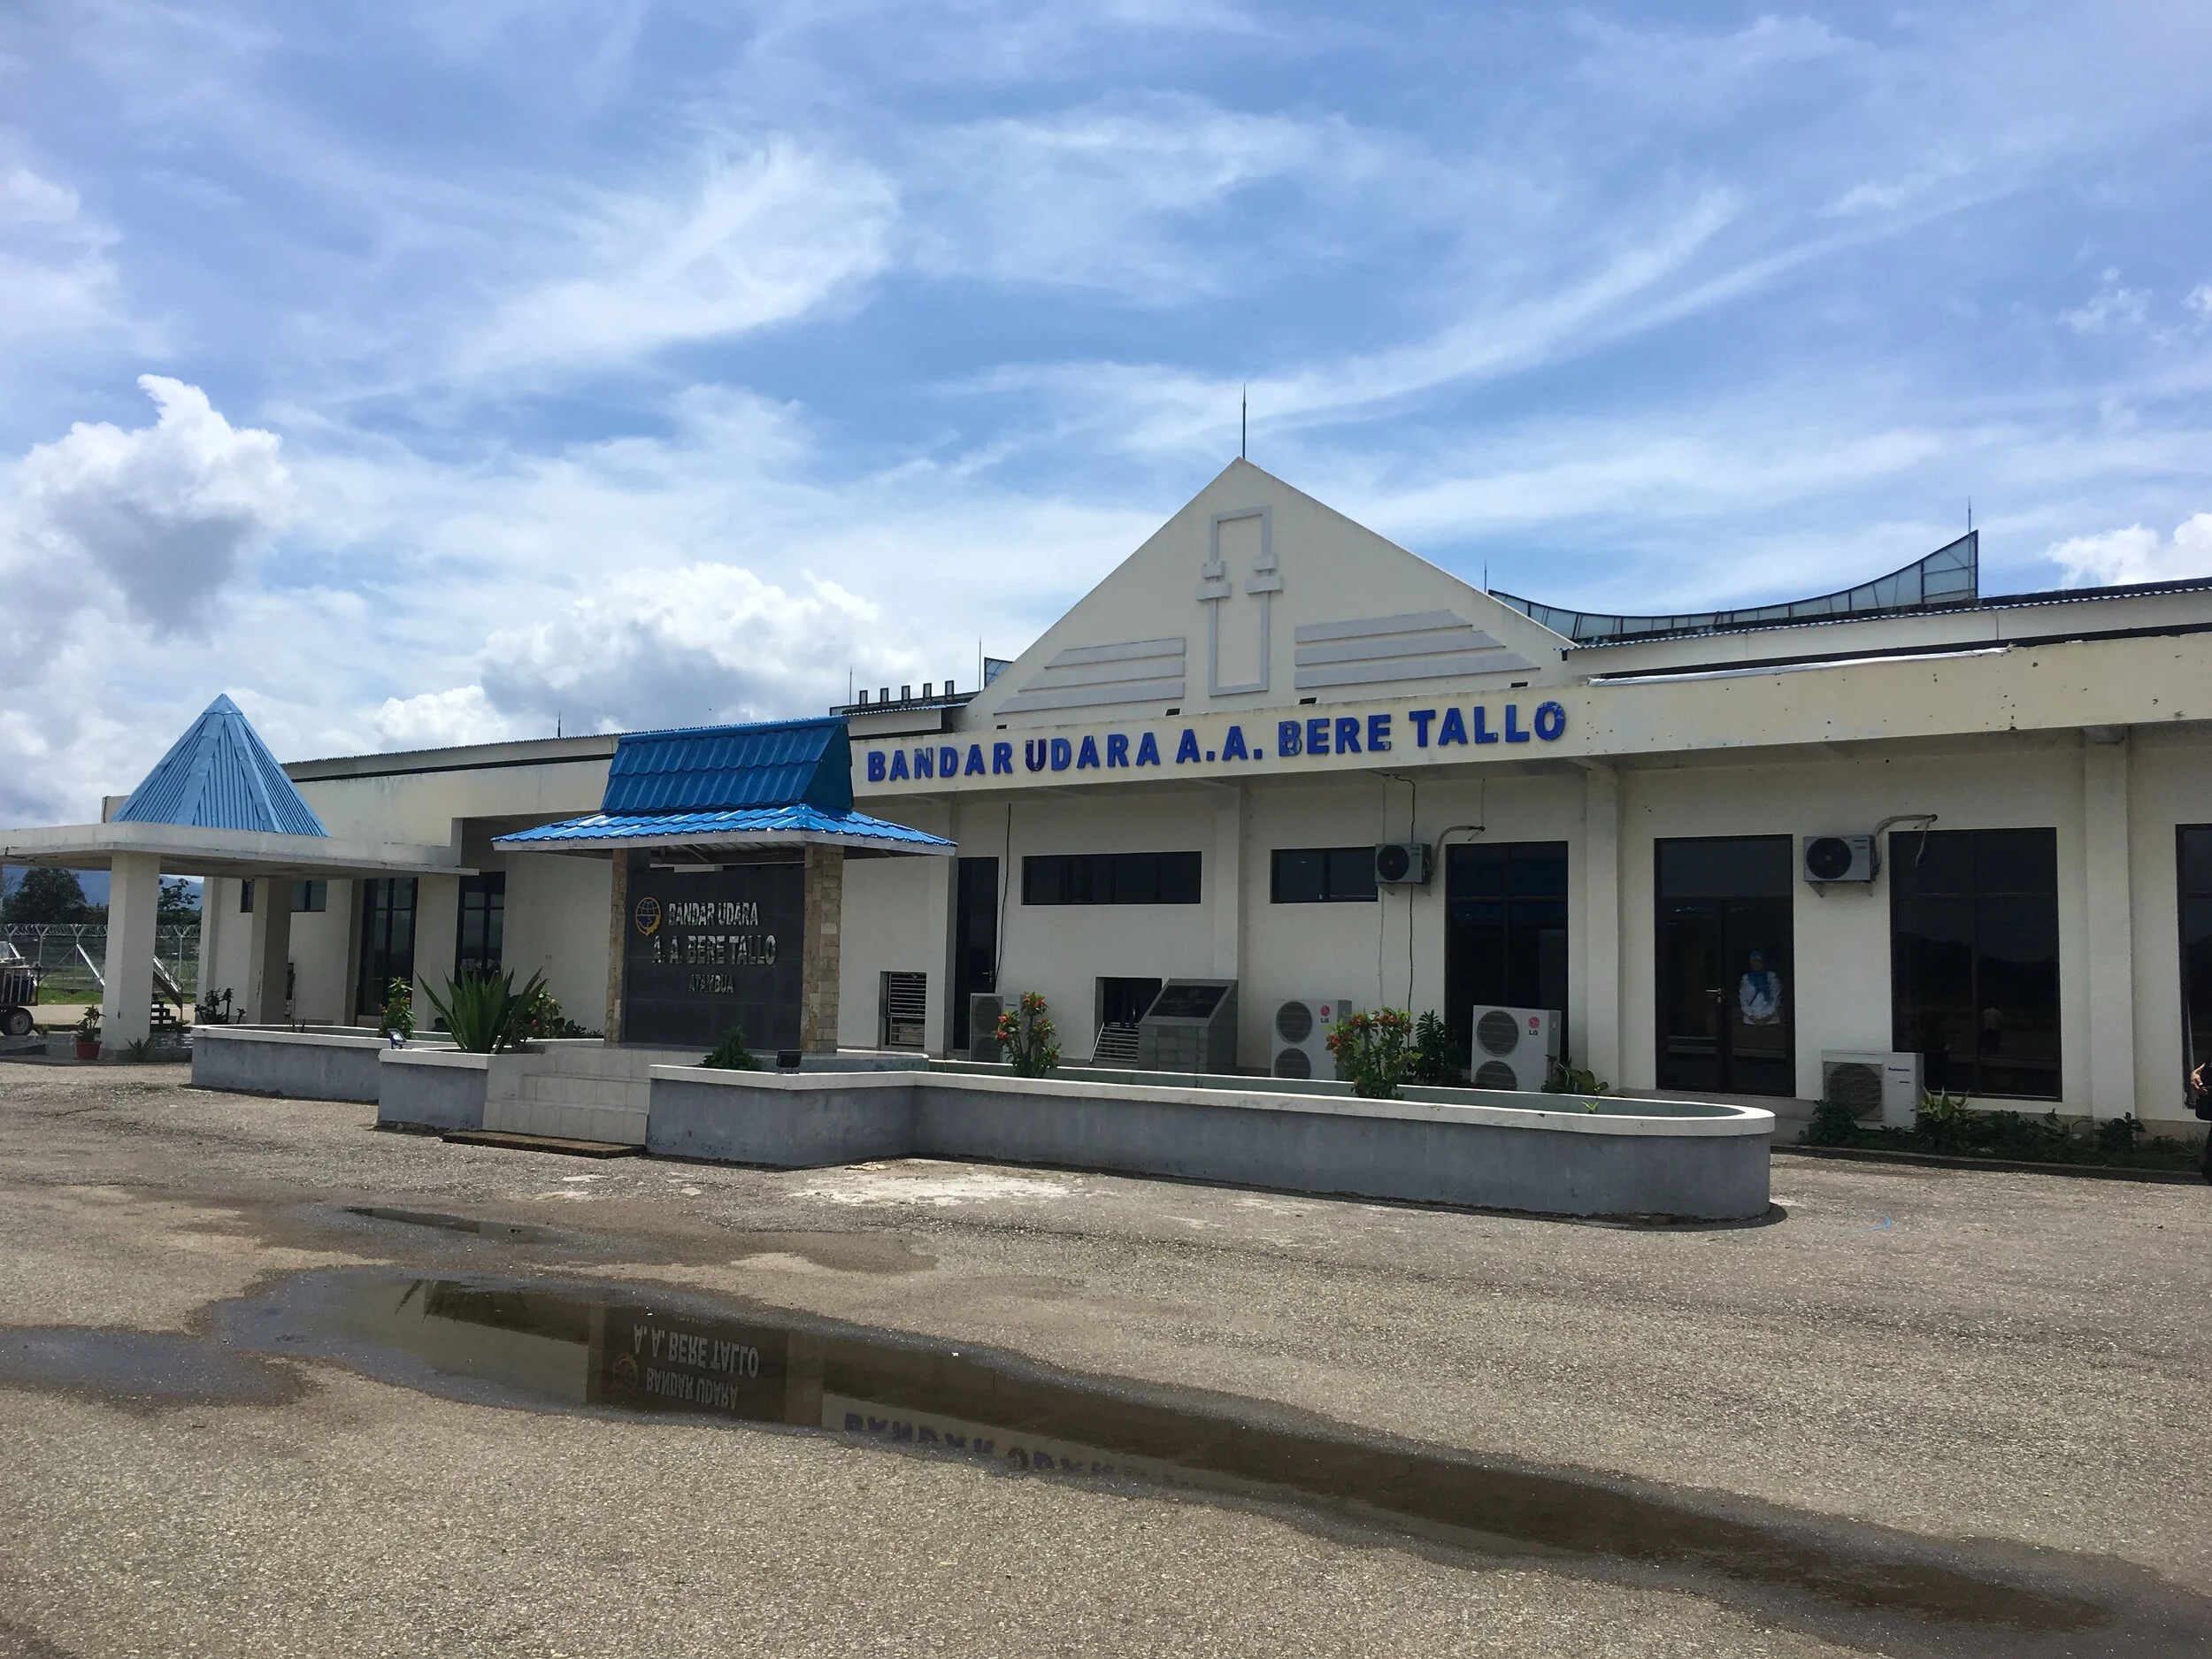
Last week, I went to Atambua, Belu District, East Nusa Tenggara to conduct the OSM Mapathon with the OSM Indonesia Association (POI) folks from Jakarta. This activity is designed to complement attribute data collection of the building footprints and road network already mapped on OpenStreetMap. The results of this mapping will be further analysed by the World Food Programme (WFP) for food security and other humanitarian issues. The survey will particularly collect information on public facilities and infrastructures, such as traditional markets, road networks, health facilities (clinics, maternal and child health services, hospitals), educational facilities, houses of worship, and government offices. The POI worked with WFP and Indonesian Red Cross (PMI) - Belu office, to map public infrastructures in Belu District. Previously, PMI has organized their own mapping programme using GPS and drones in four priority villages in Belu, including Sarabau, Ranrua, Fatuketi, and Rafae Villages.
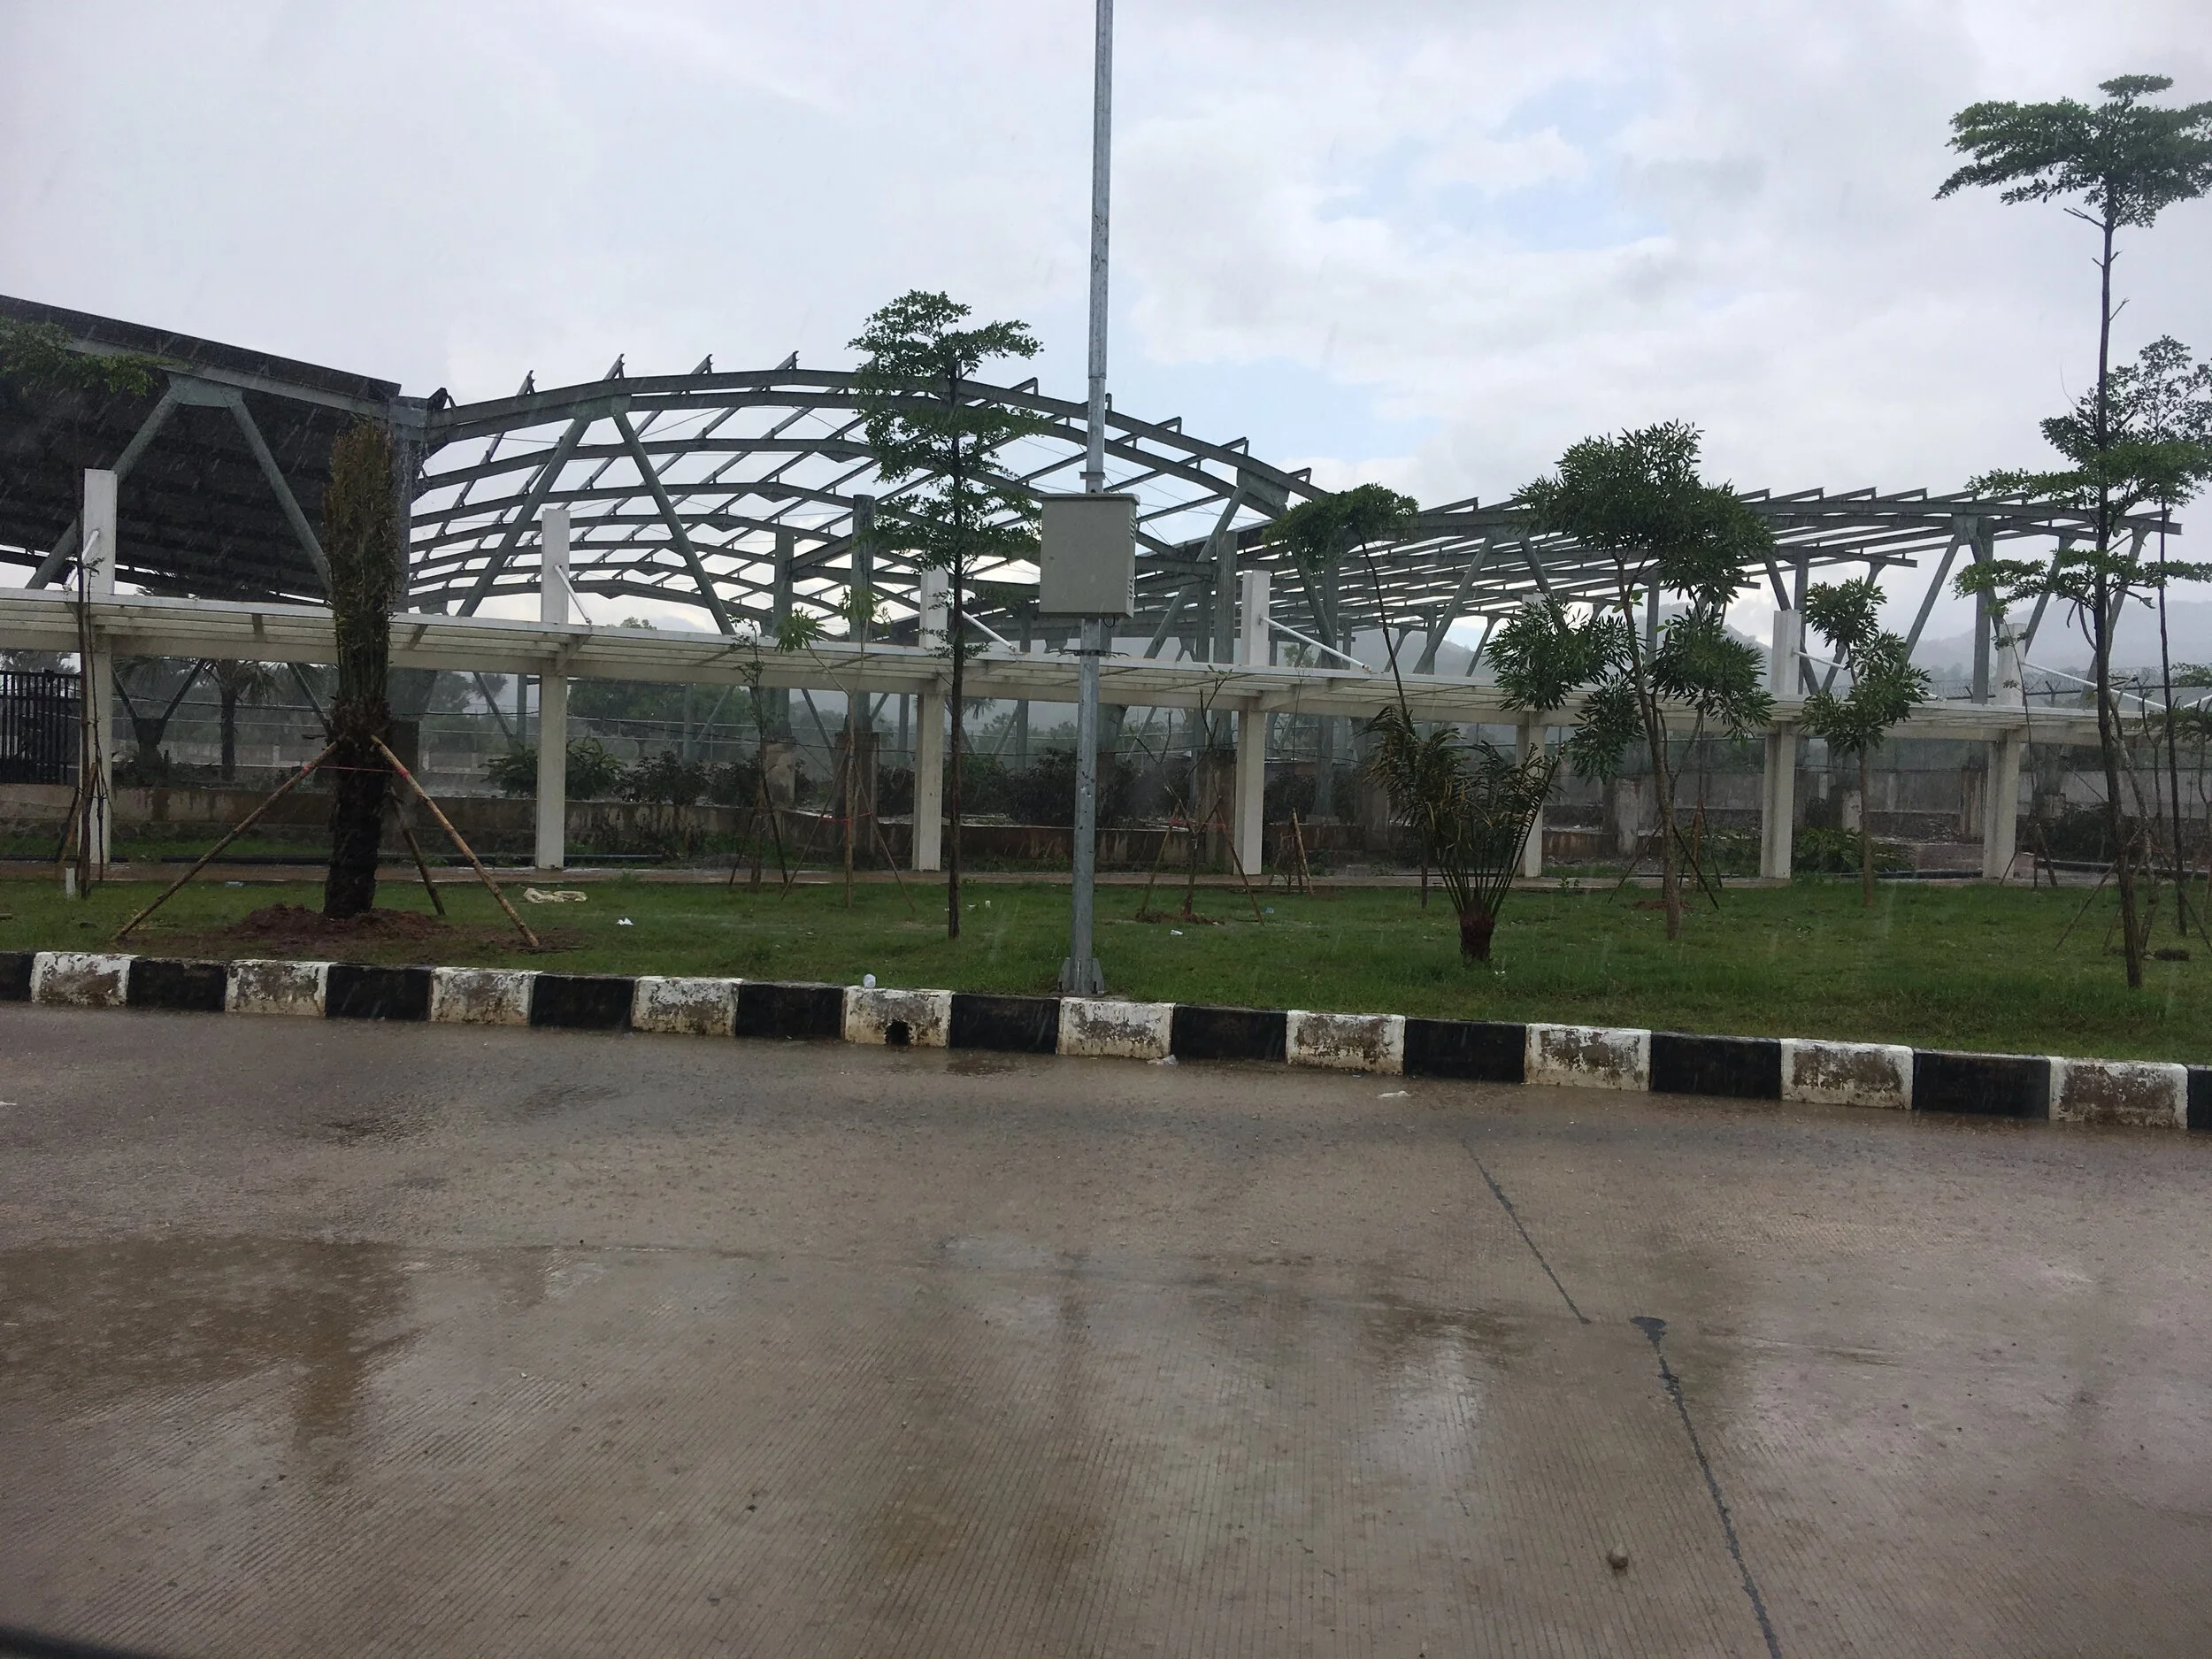
Belu District consists of 12 subdistricts directly adjacent to East Timor. It is a mountainous area with the Atambua City takes place at its city centre. These places were among the main priorities during the survey so it can reach out to all areas in Belu. Before starting the survey, participants were equipped with basic OSM trainings for two days, and it continued with QGIS training on the last day.
The first day was started with training courses on the introduction to OSM, creating account, operating JOSM, operating Tasking Manager, and an introduction to surveying tools, such as GPS, OSMTraker, OMK, and ODK Collect. Some of the participants already have experience using GPS for field surveys in their respective villages for Red Cross activities, making them familiar with field survey training materials. The session was concluded with assigning participants into smaller groups for exercises to survey the areas nearby the training venue using the newly introduced tools.
Participants were divided into four smaller groups, each consisting of one trainer, one participant from Belu Red Cross, and 1 from Red Cross from outside of Belu. The group assignment remains the same for the infrastructure surveys in Day 3 and 4.
In the second day, the training was started with a survey exercise surrounding the training venue within 2 km. In the exercise, each group brings smartphones with pre-downloaded satellite imagery for the survey area, complete with its administration boundaries.
The field survey exercise lasted for about 40-50 minutes and was continued with data entry exercise using JOSM. After inputting all survey data to OSM, participants inputted GPX data from their respective area that are not yet available on OSM.
Participants had previously digitized their villages using Tasking Manager created by PMI, this makes the process of adding attribute data run smoothly. In the second day’s sessions, the training was continued with conflict resolution and quality assurance on OSM. Courses on resolving conflict is an additional courses as some participants experienced data conflict from their survey outcomes. The sessions were concluded with a briefing for field survey Day 3 and 4. The infrastructure data that were collected, include:
- Traditional markets
- Road networks
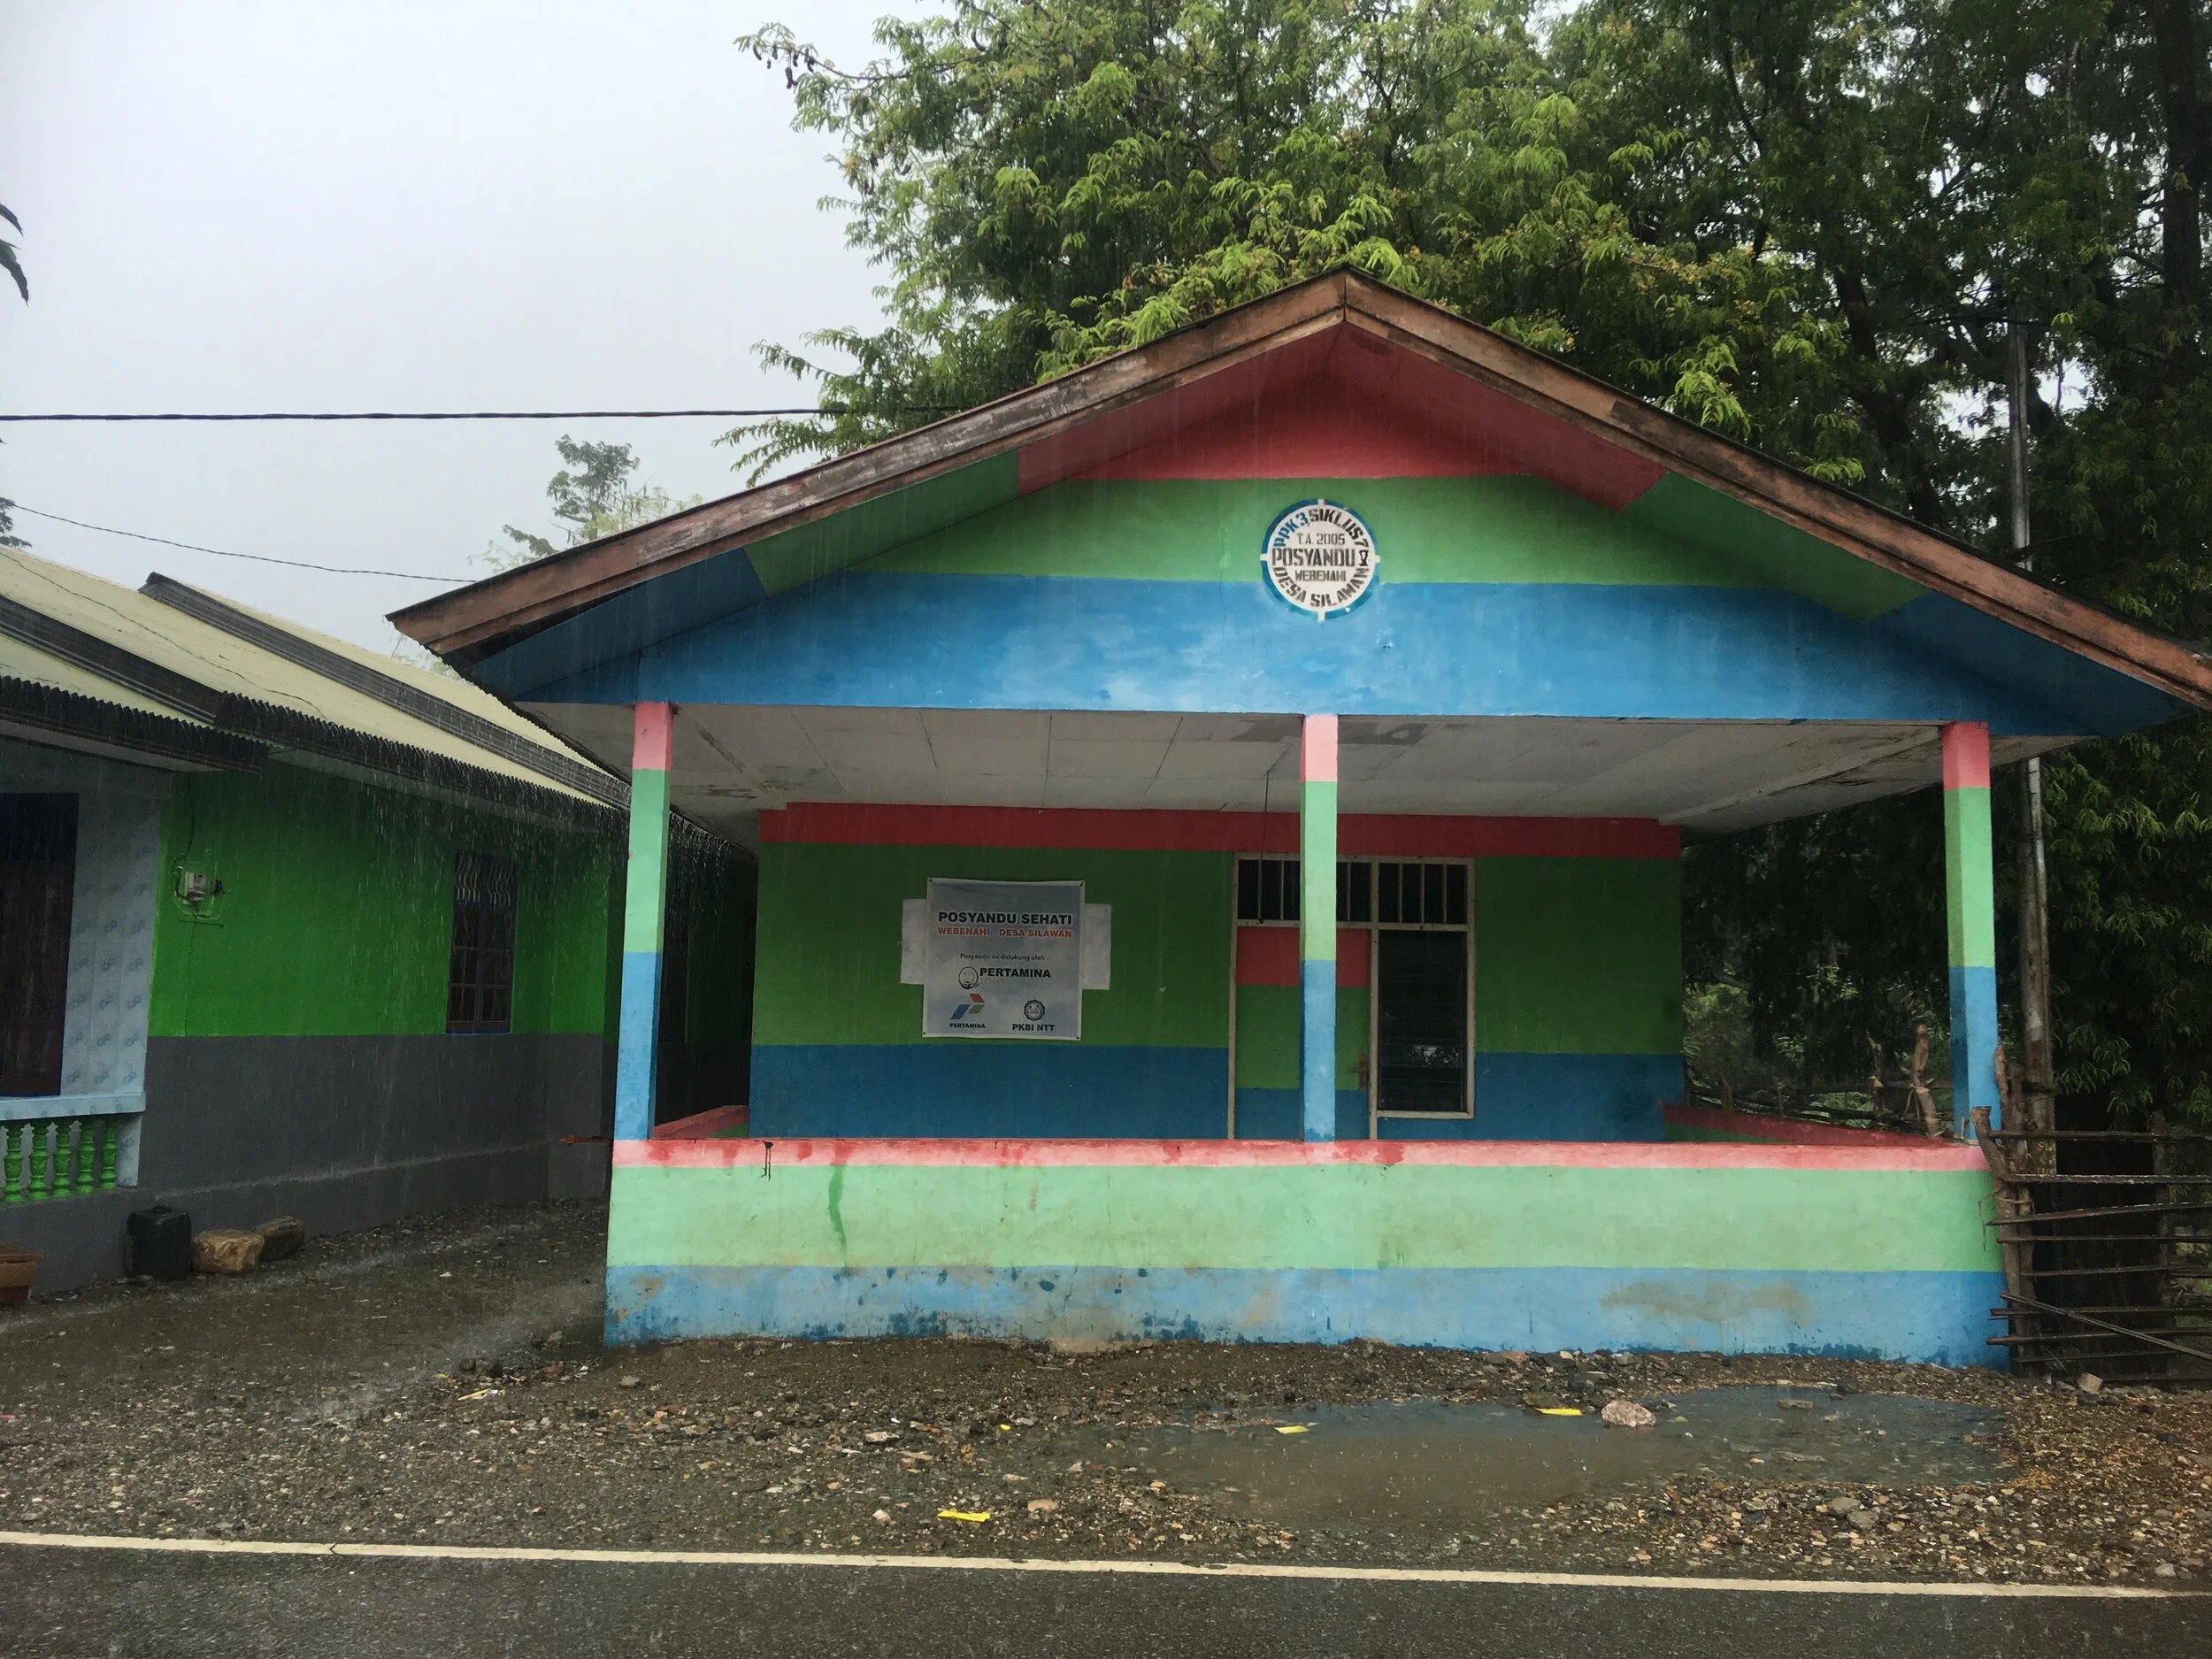
- Health facilities, especially small maternal and child health services
- Education facilities
- Houses of worship
- Government offices
Participants collect infrastructure data for the whole Belu Regency on the Day 3 and 4 using rented cars. There are 12 subdistricts, divided among the four groups.
The field survey run efficiently, as each group traveled with one group member who are from the local PMI community members that can help navigate and who already recognize the objects that become the field survey priority objects. The following is the outcome of the survey:
Participants will continue with uploading their *.gpx data from their respective area as the training venue’s internet connection could not support large files upload, there are still several objects data already collected but are yet to be uploaded to the OSM. Once participants thoroughly understand how to map with little difficulties, we continued with training how to download OSM data using HOT Export so they can use the data to make their own maps. Participants then learned how to process the data using QGIS. These data will then be customised with symbology and labels. The session ended with map making with Map Composer QGIS. Participants went through this course fairly smoothly as they already understood Geographic Information System and are comfortable using laptops.
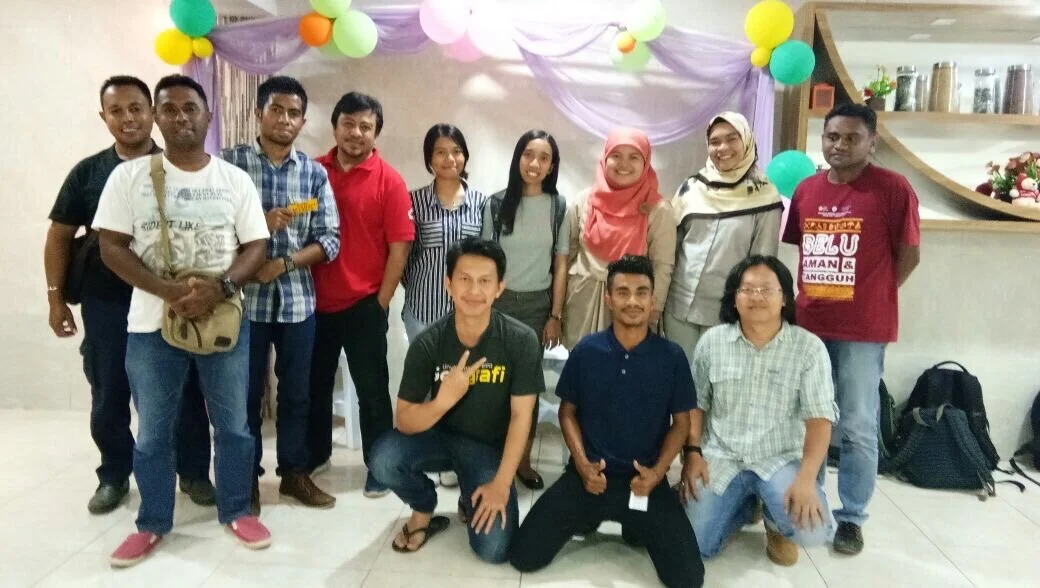
The data collection training was concluded by announcing the winners, evaluated with the following criteria:
- Participants with the highest points at the post test and the highest margin between post and pre test points.
- Participants with the best map composing skills and was most active during the training.
- Participants who could answer impromptu questions in the forum
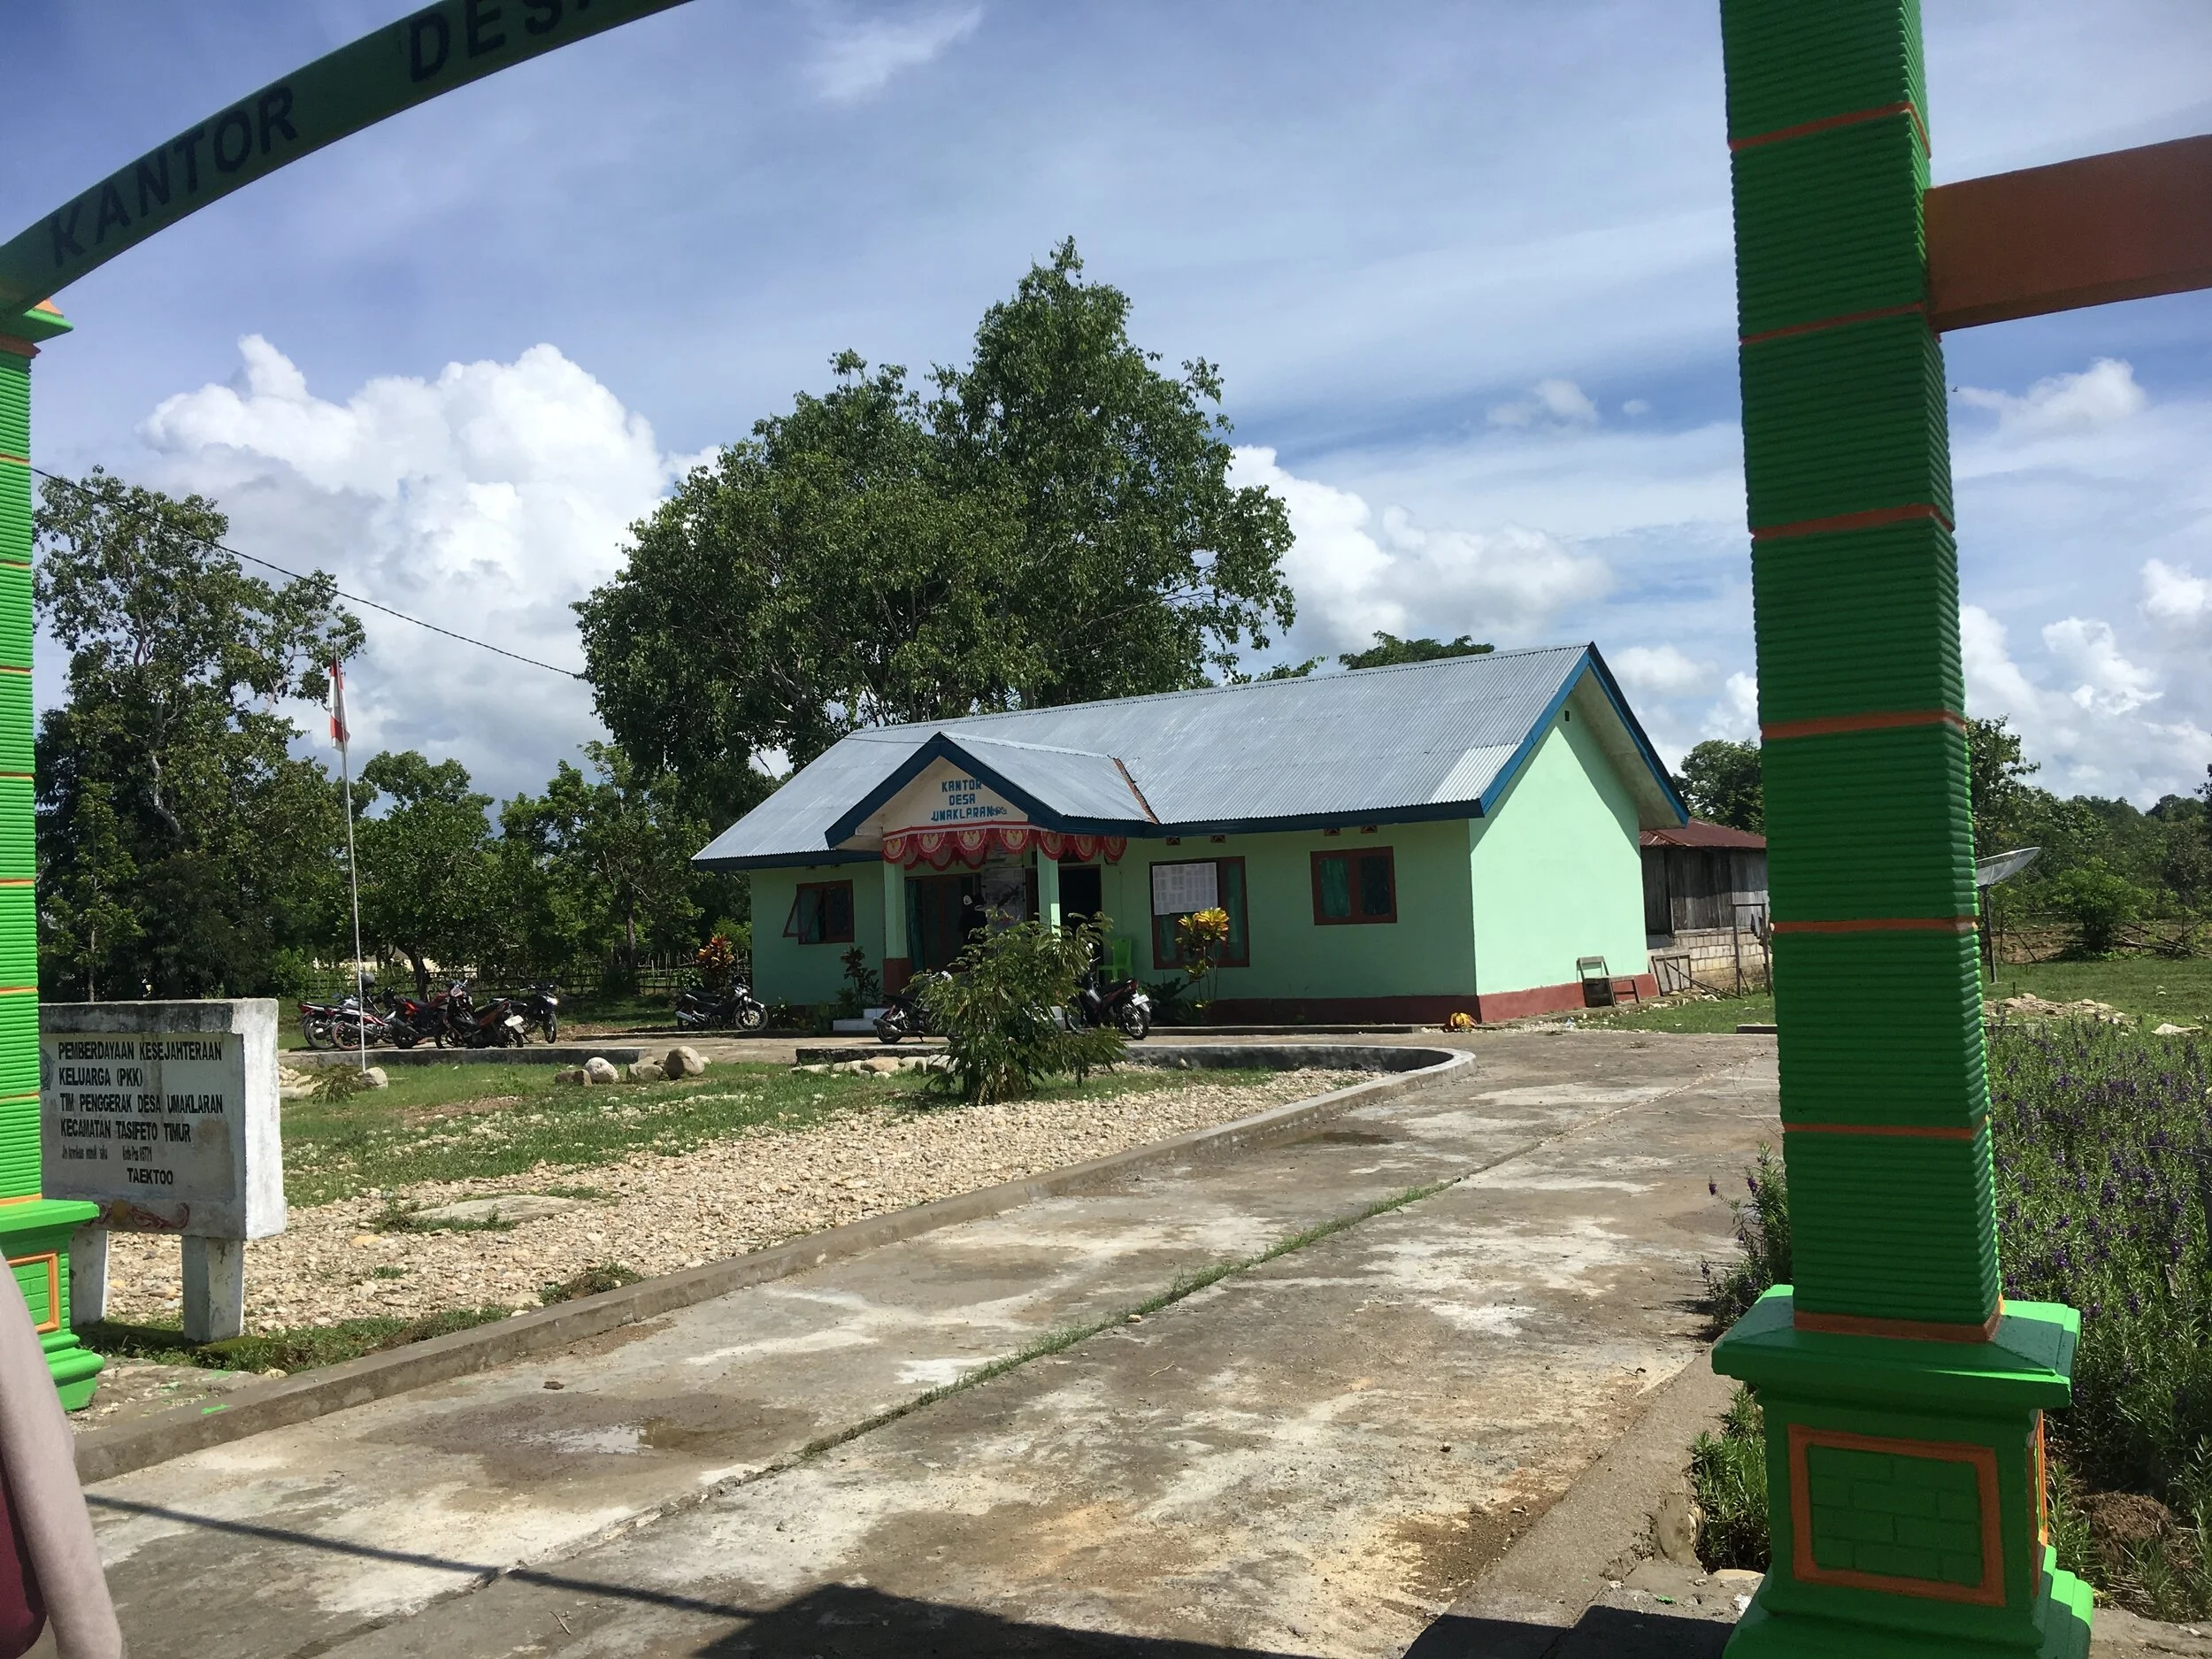
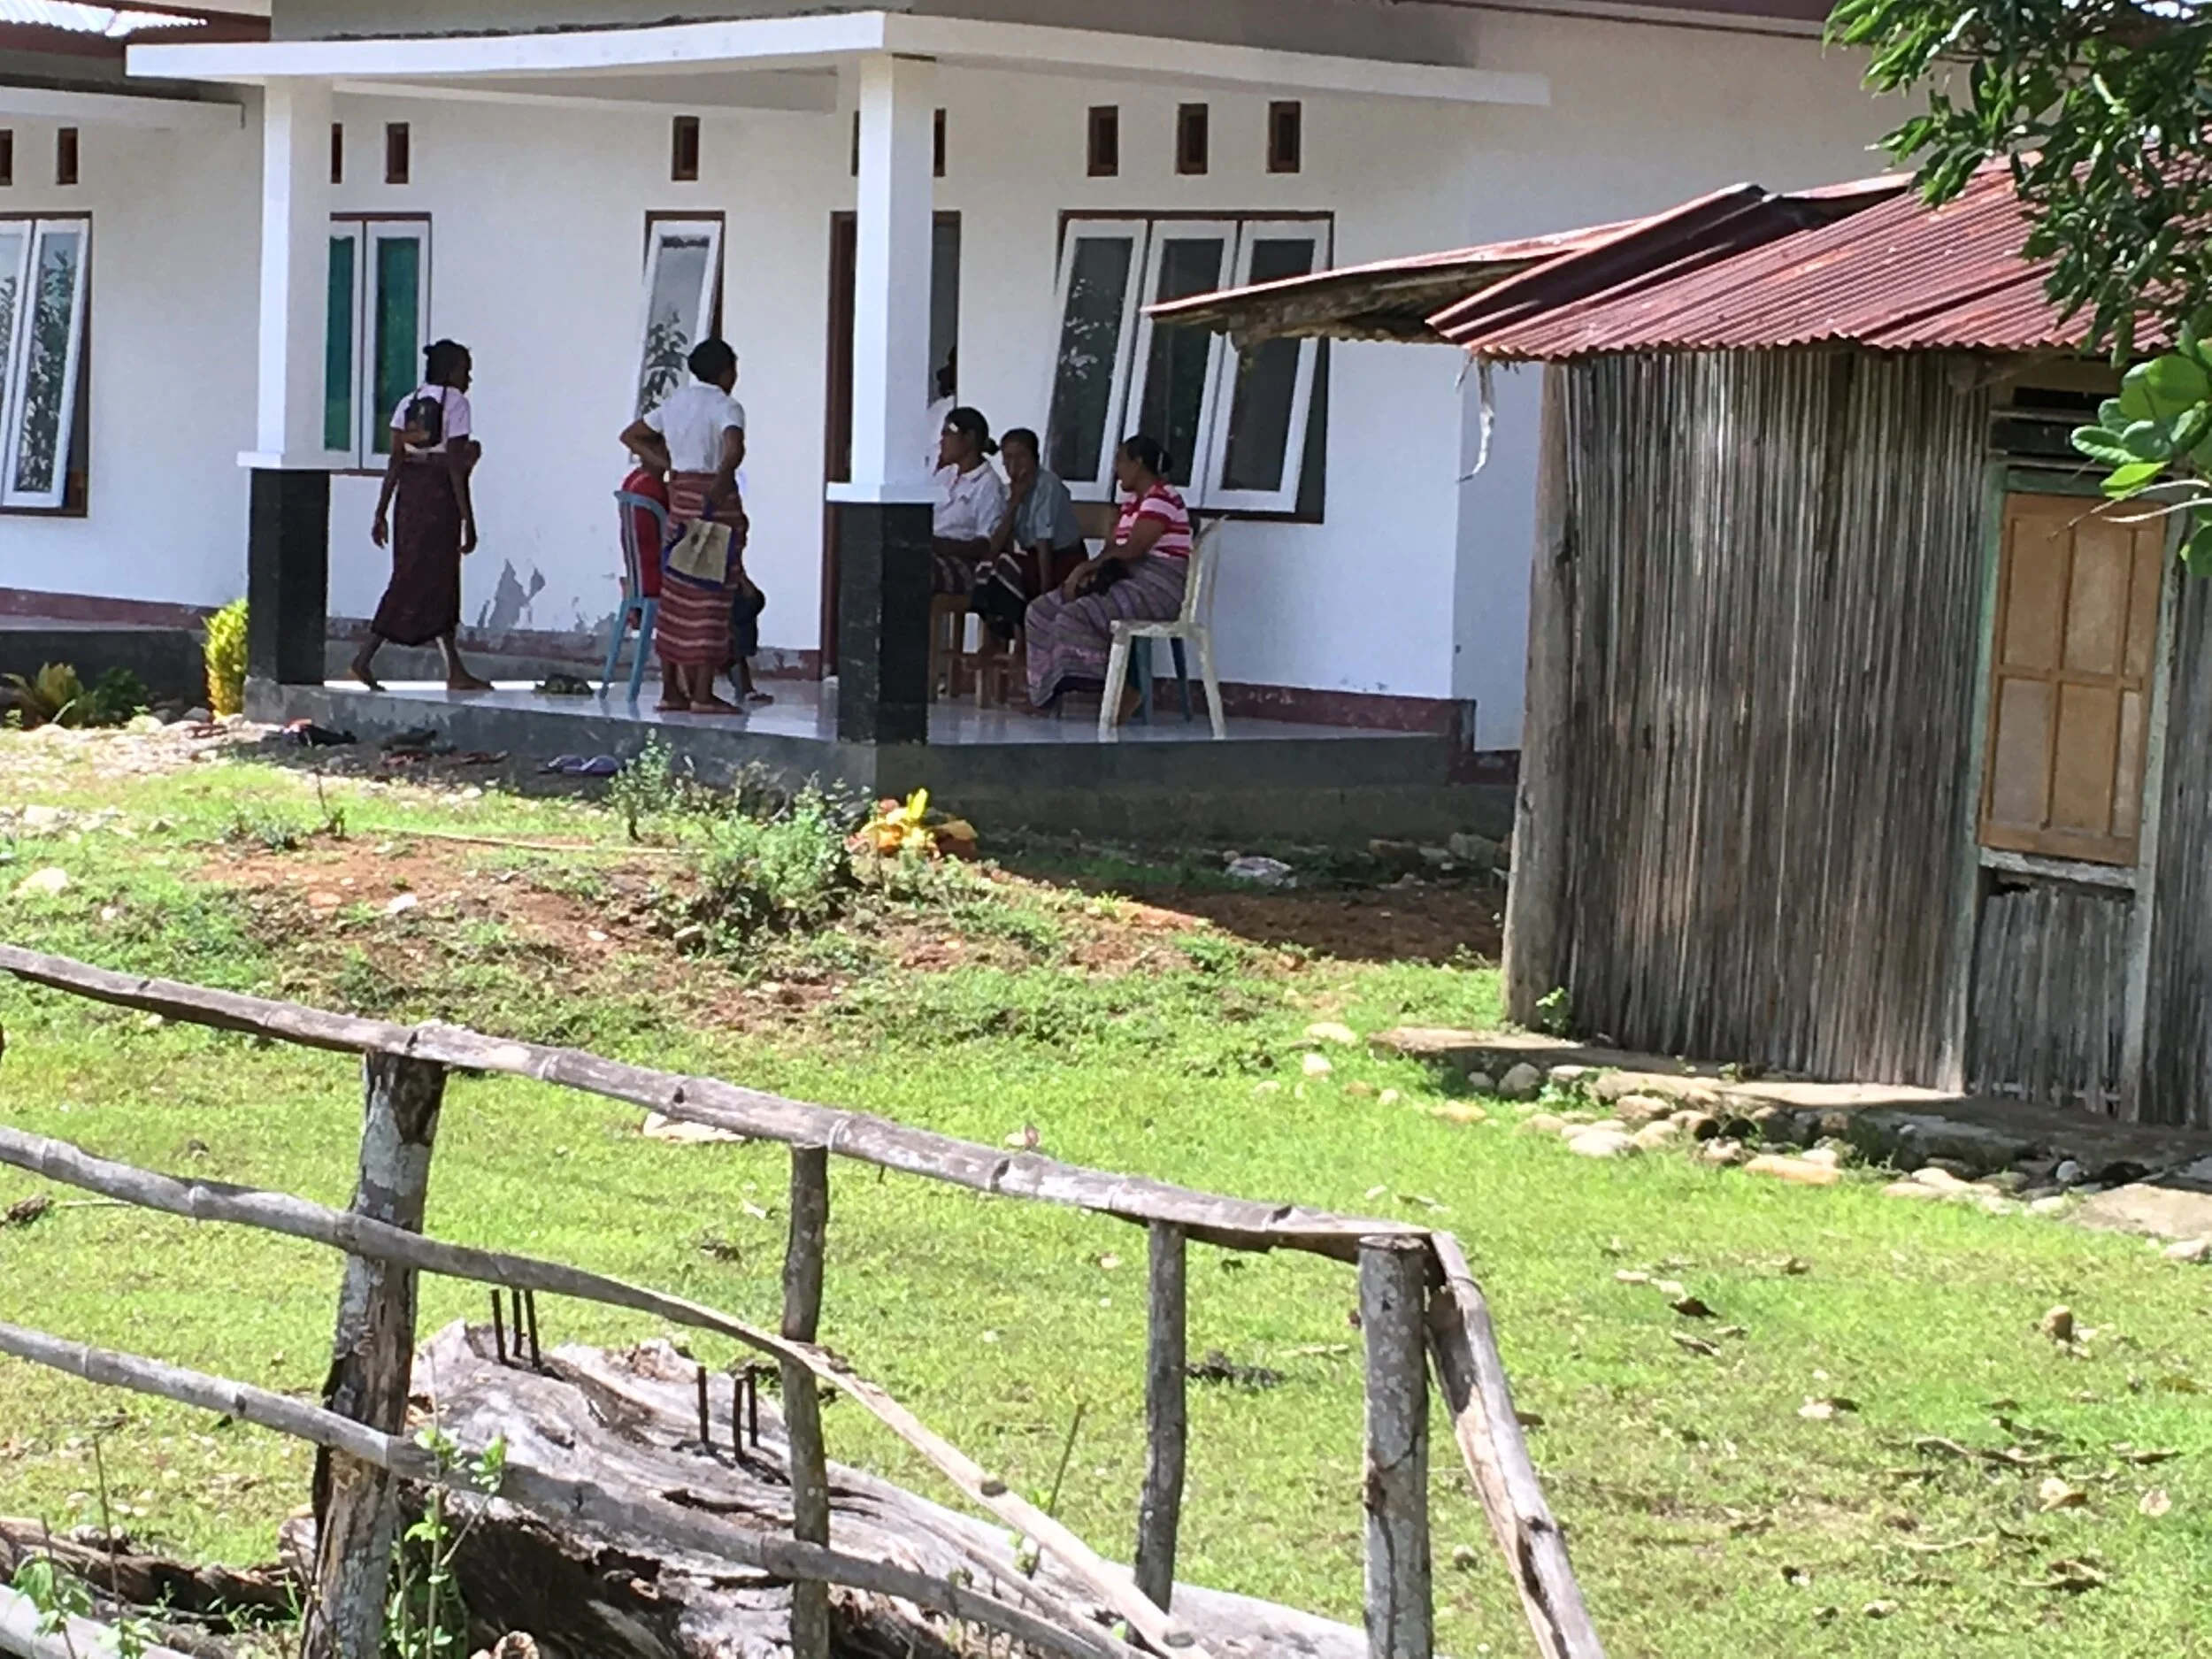
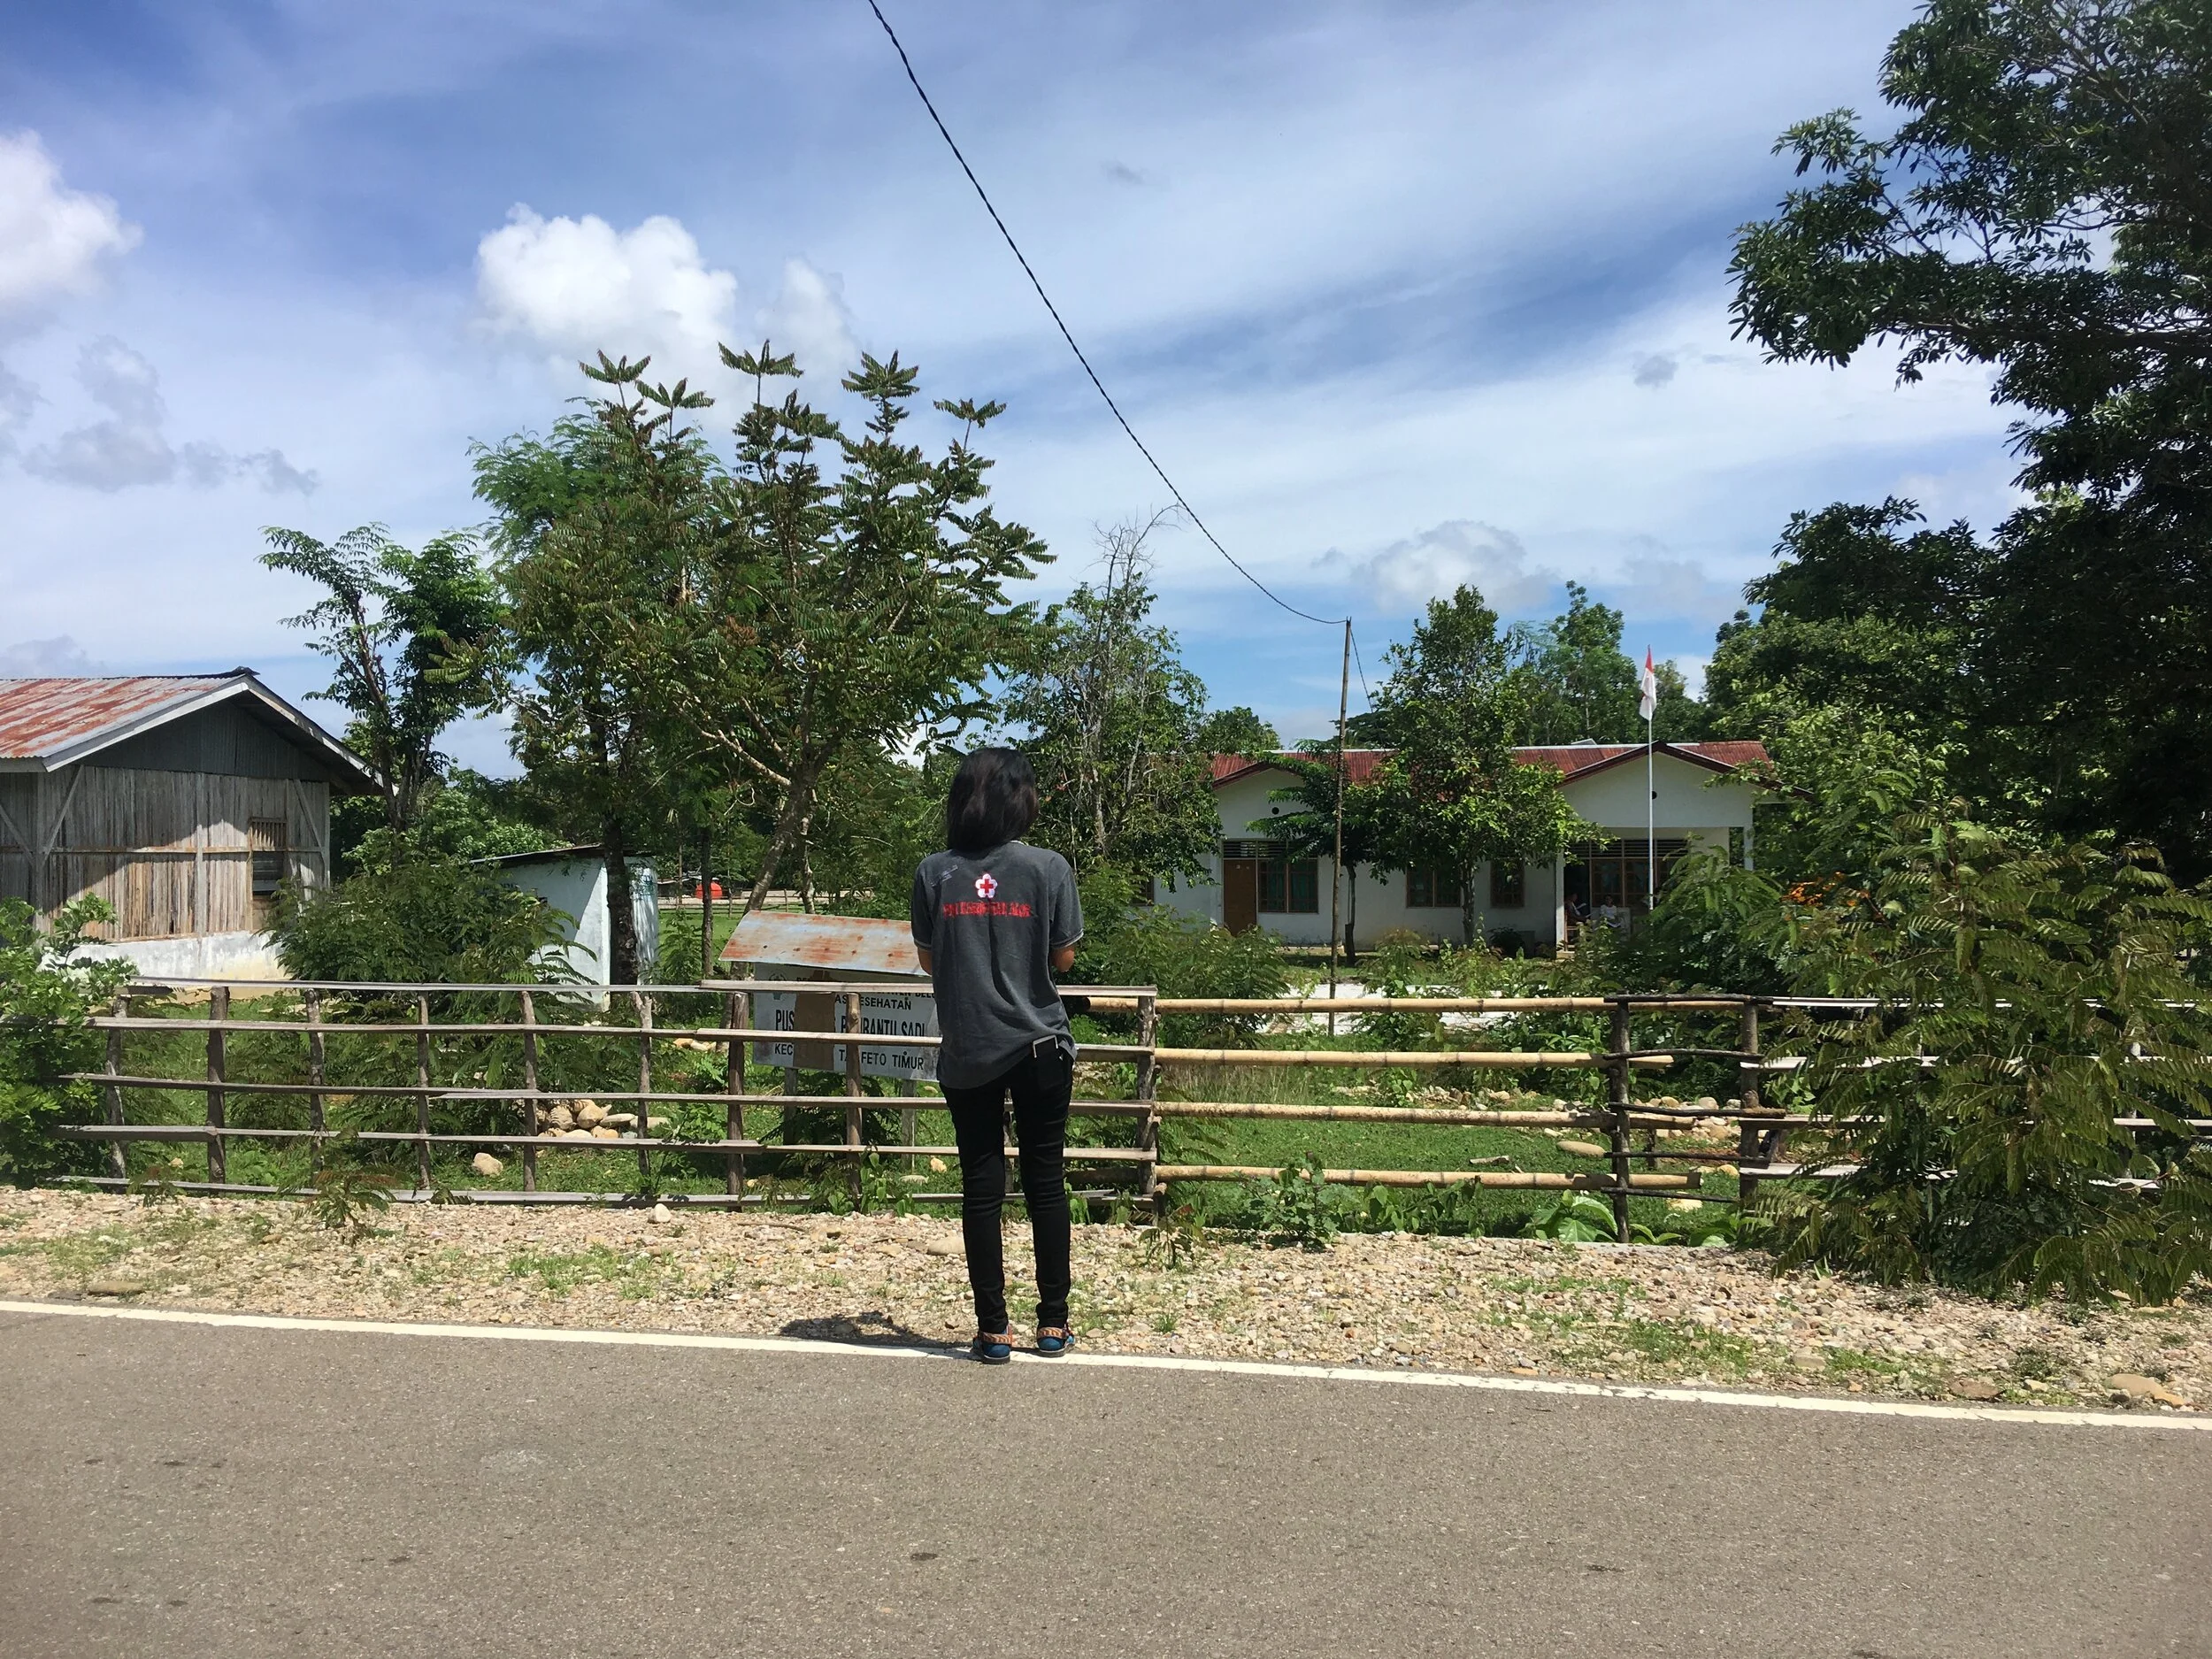
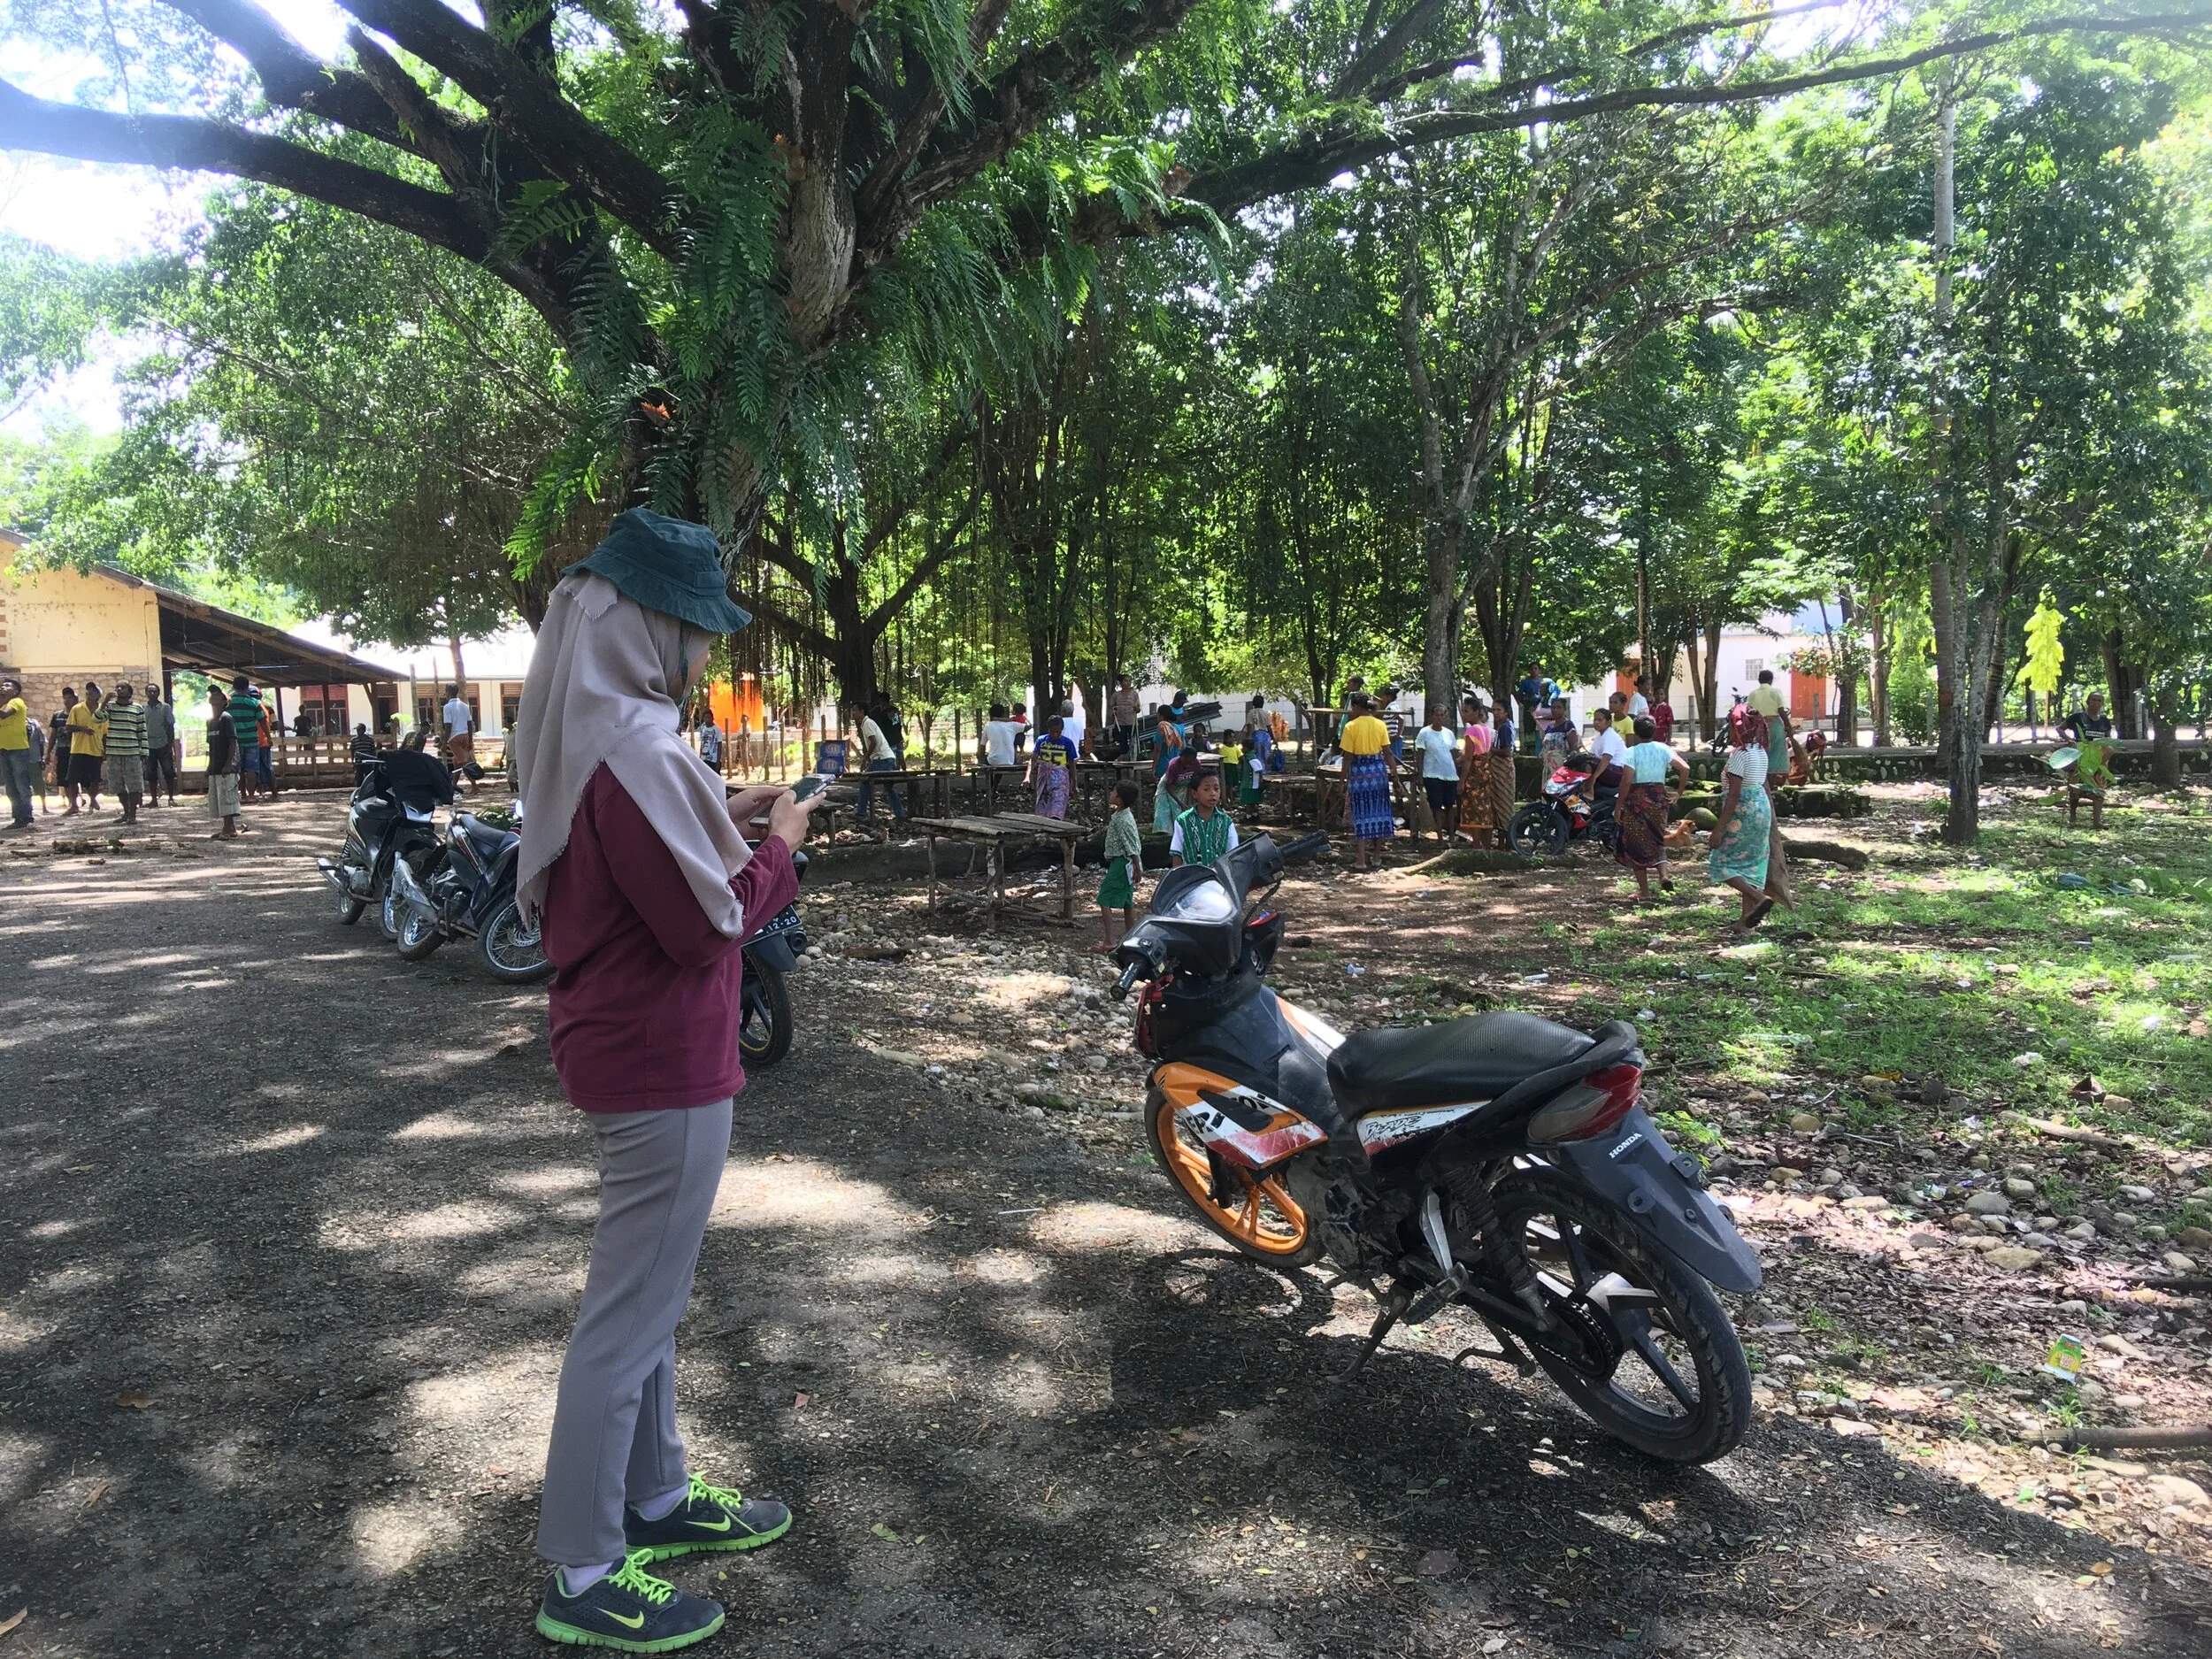
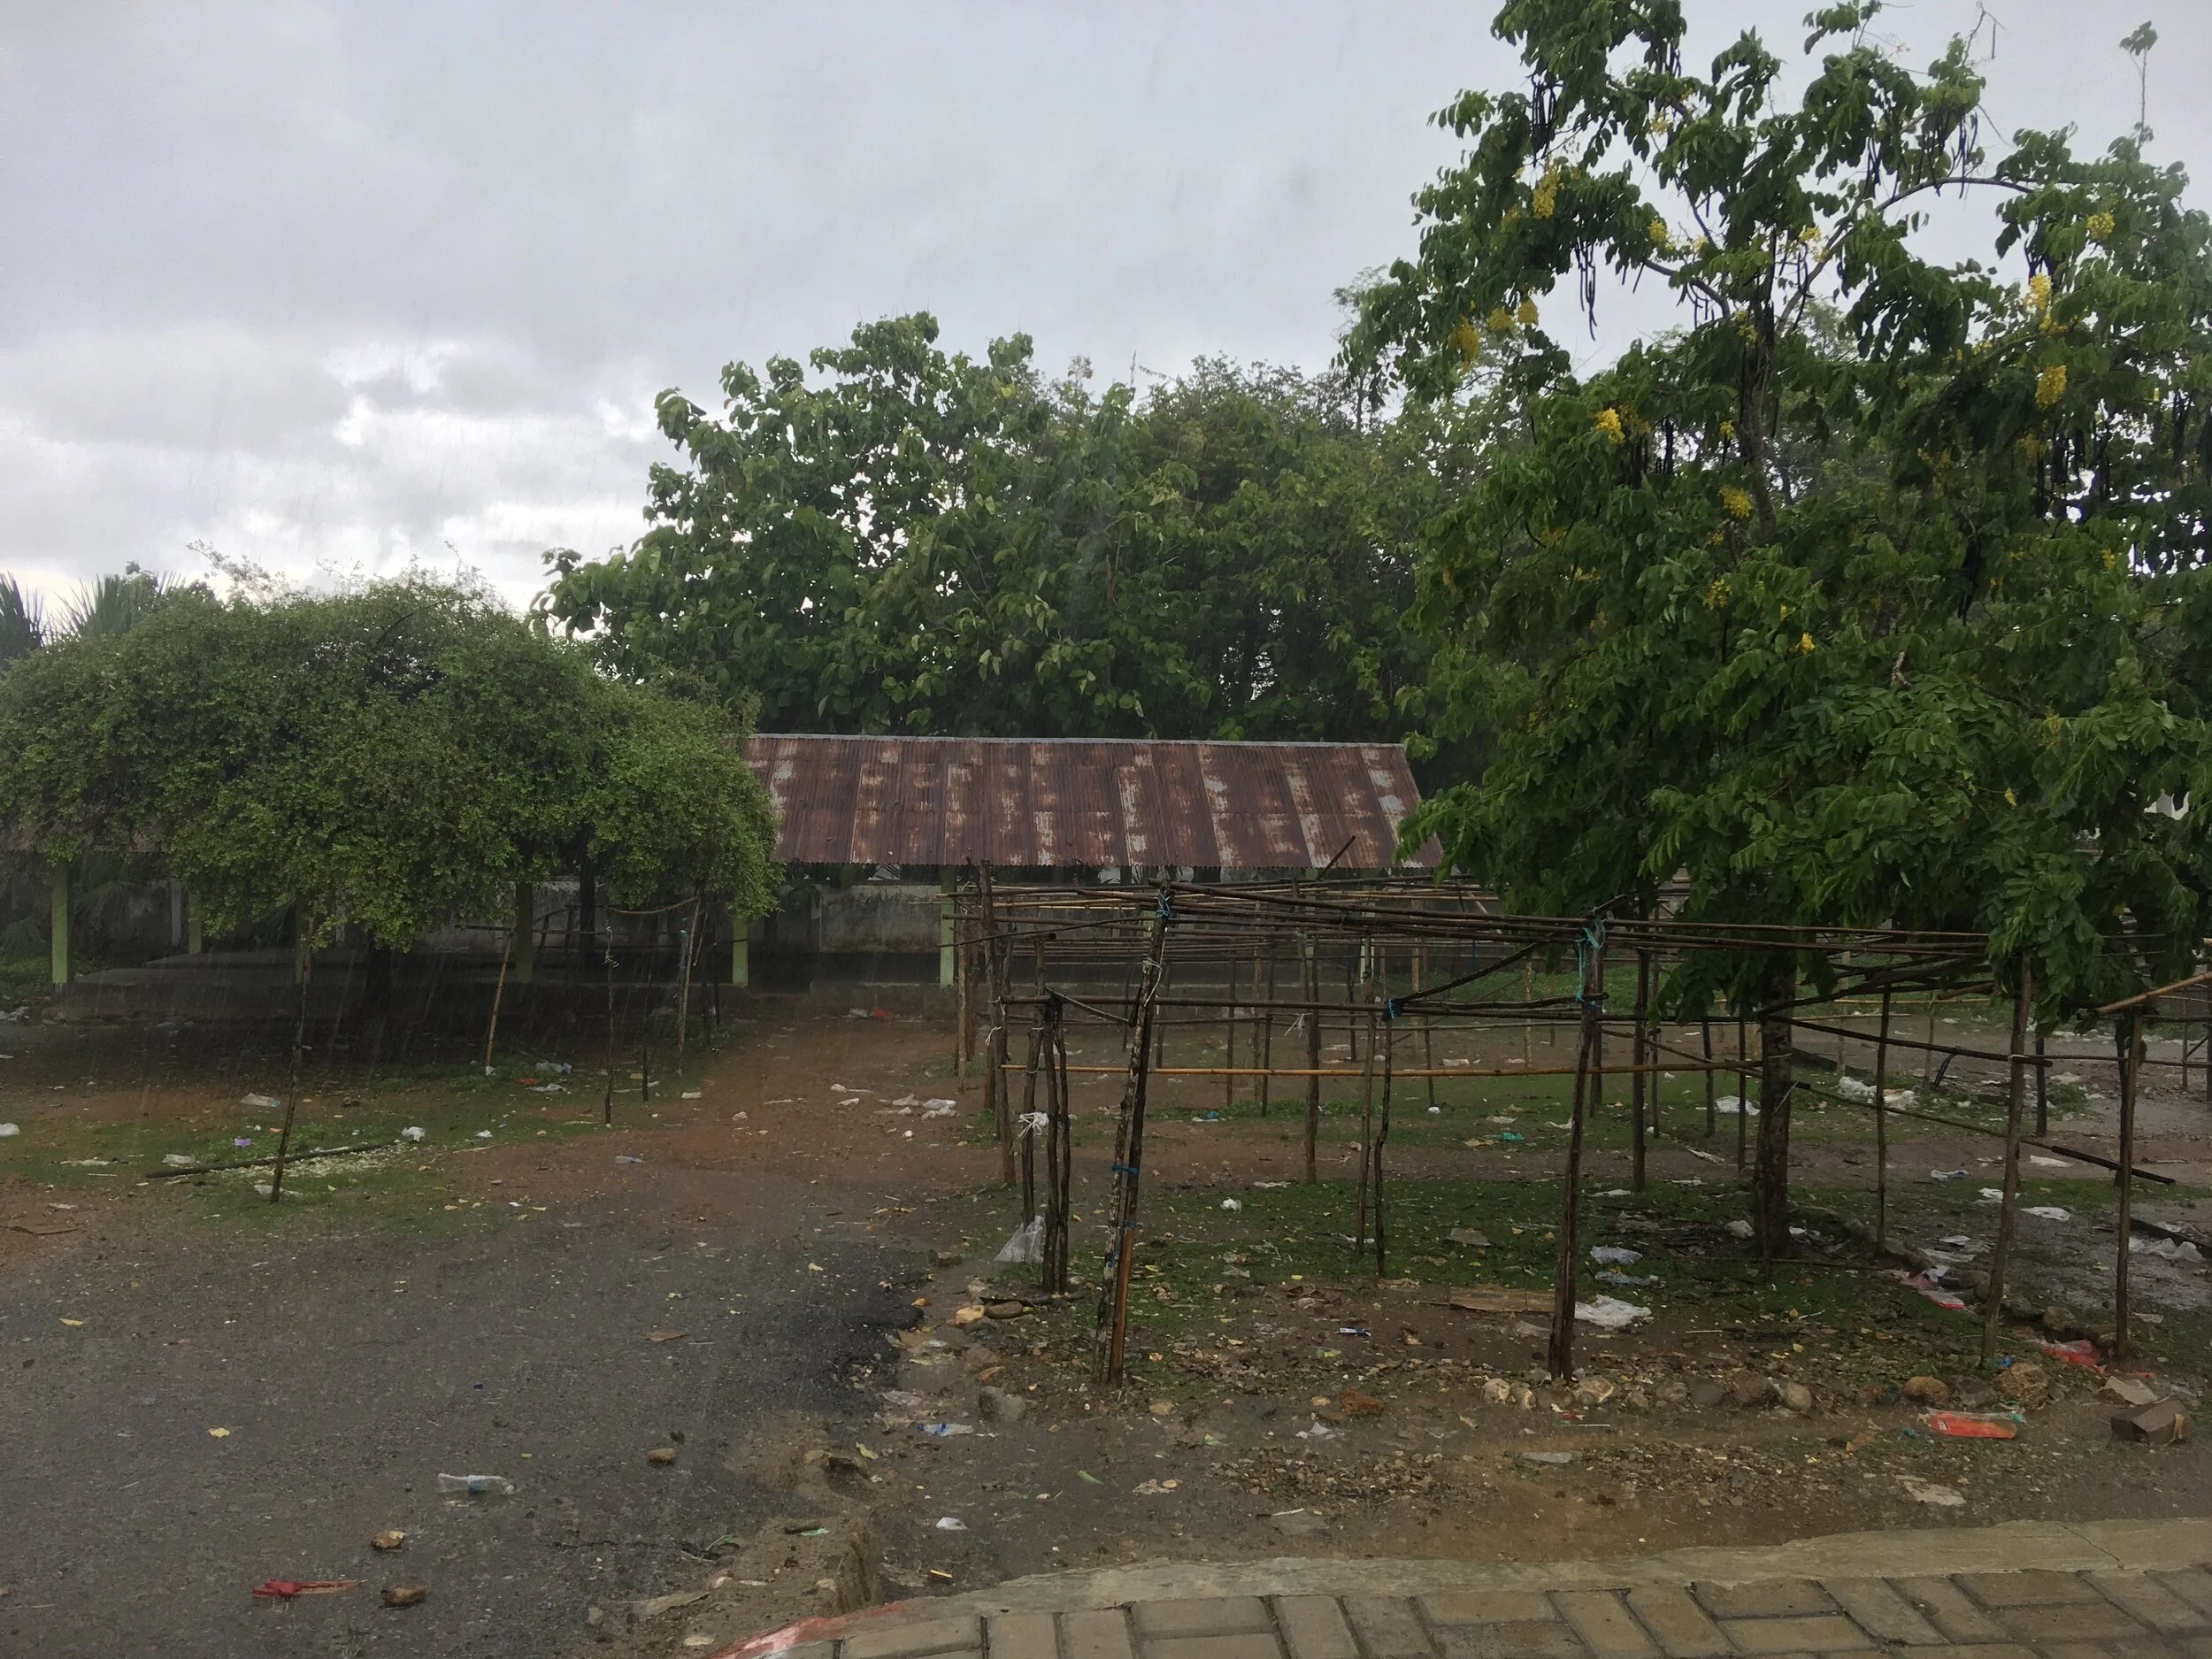
Below are some pictures from the Mapathon.