Calculate SPI using IMERG data
Remote Sensing
Research
Climate
A step-by-step Jupyter Notebook for calculating the Standardized Precipitation Index from daily IMERG rainfall data, and my first time using Jupyter
NOTES - 1 Mar 2022
I have write a new and comprehensive guideline on SPI, you can access via this link https://bennyistanto.github.io/spi/
I have completed step-by-step guideline written in Jupyter Notebook, here’s the link https://github.com/wfpidn/SPI/blob/master/SPI_based_on_IMERG.ipynb and last week was my first time using Jupyter Notebook. I found some errors in bullets and numbering when displaying the notebook in Github, but seems ok when open it using Jupyter directly. Sorry for that.
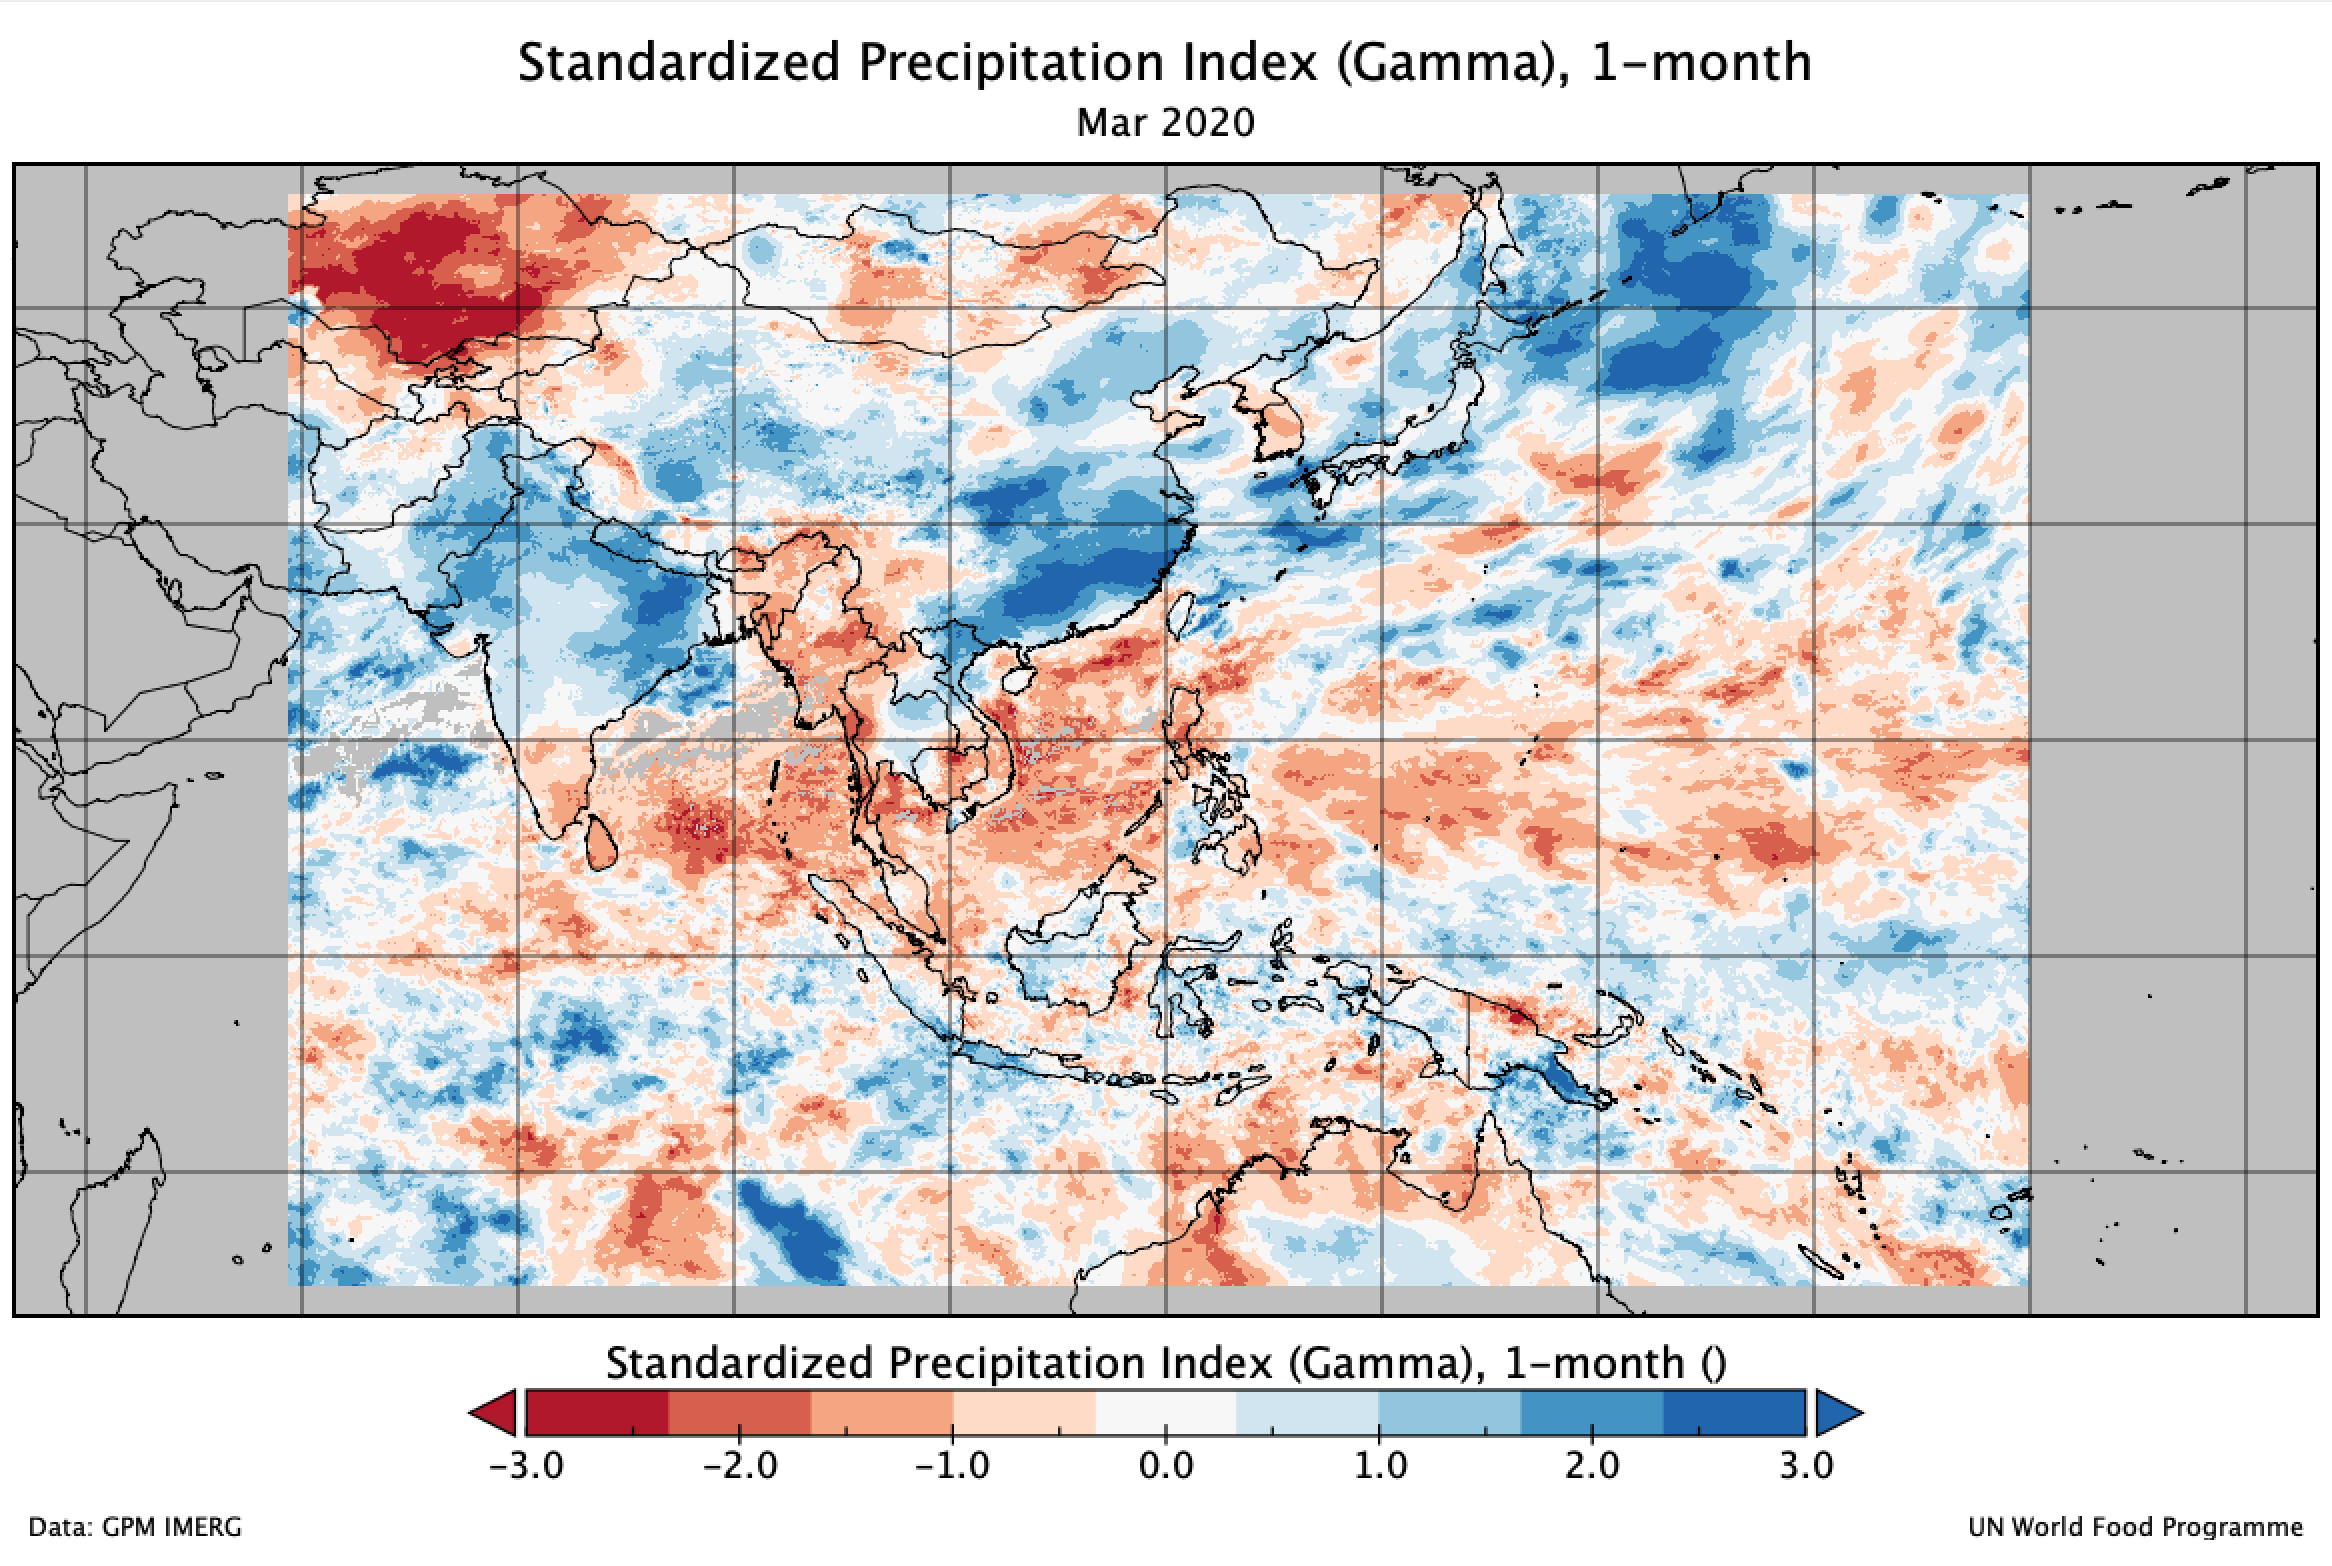
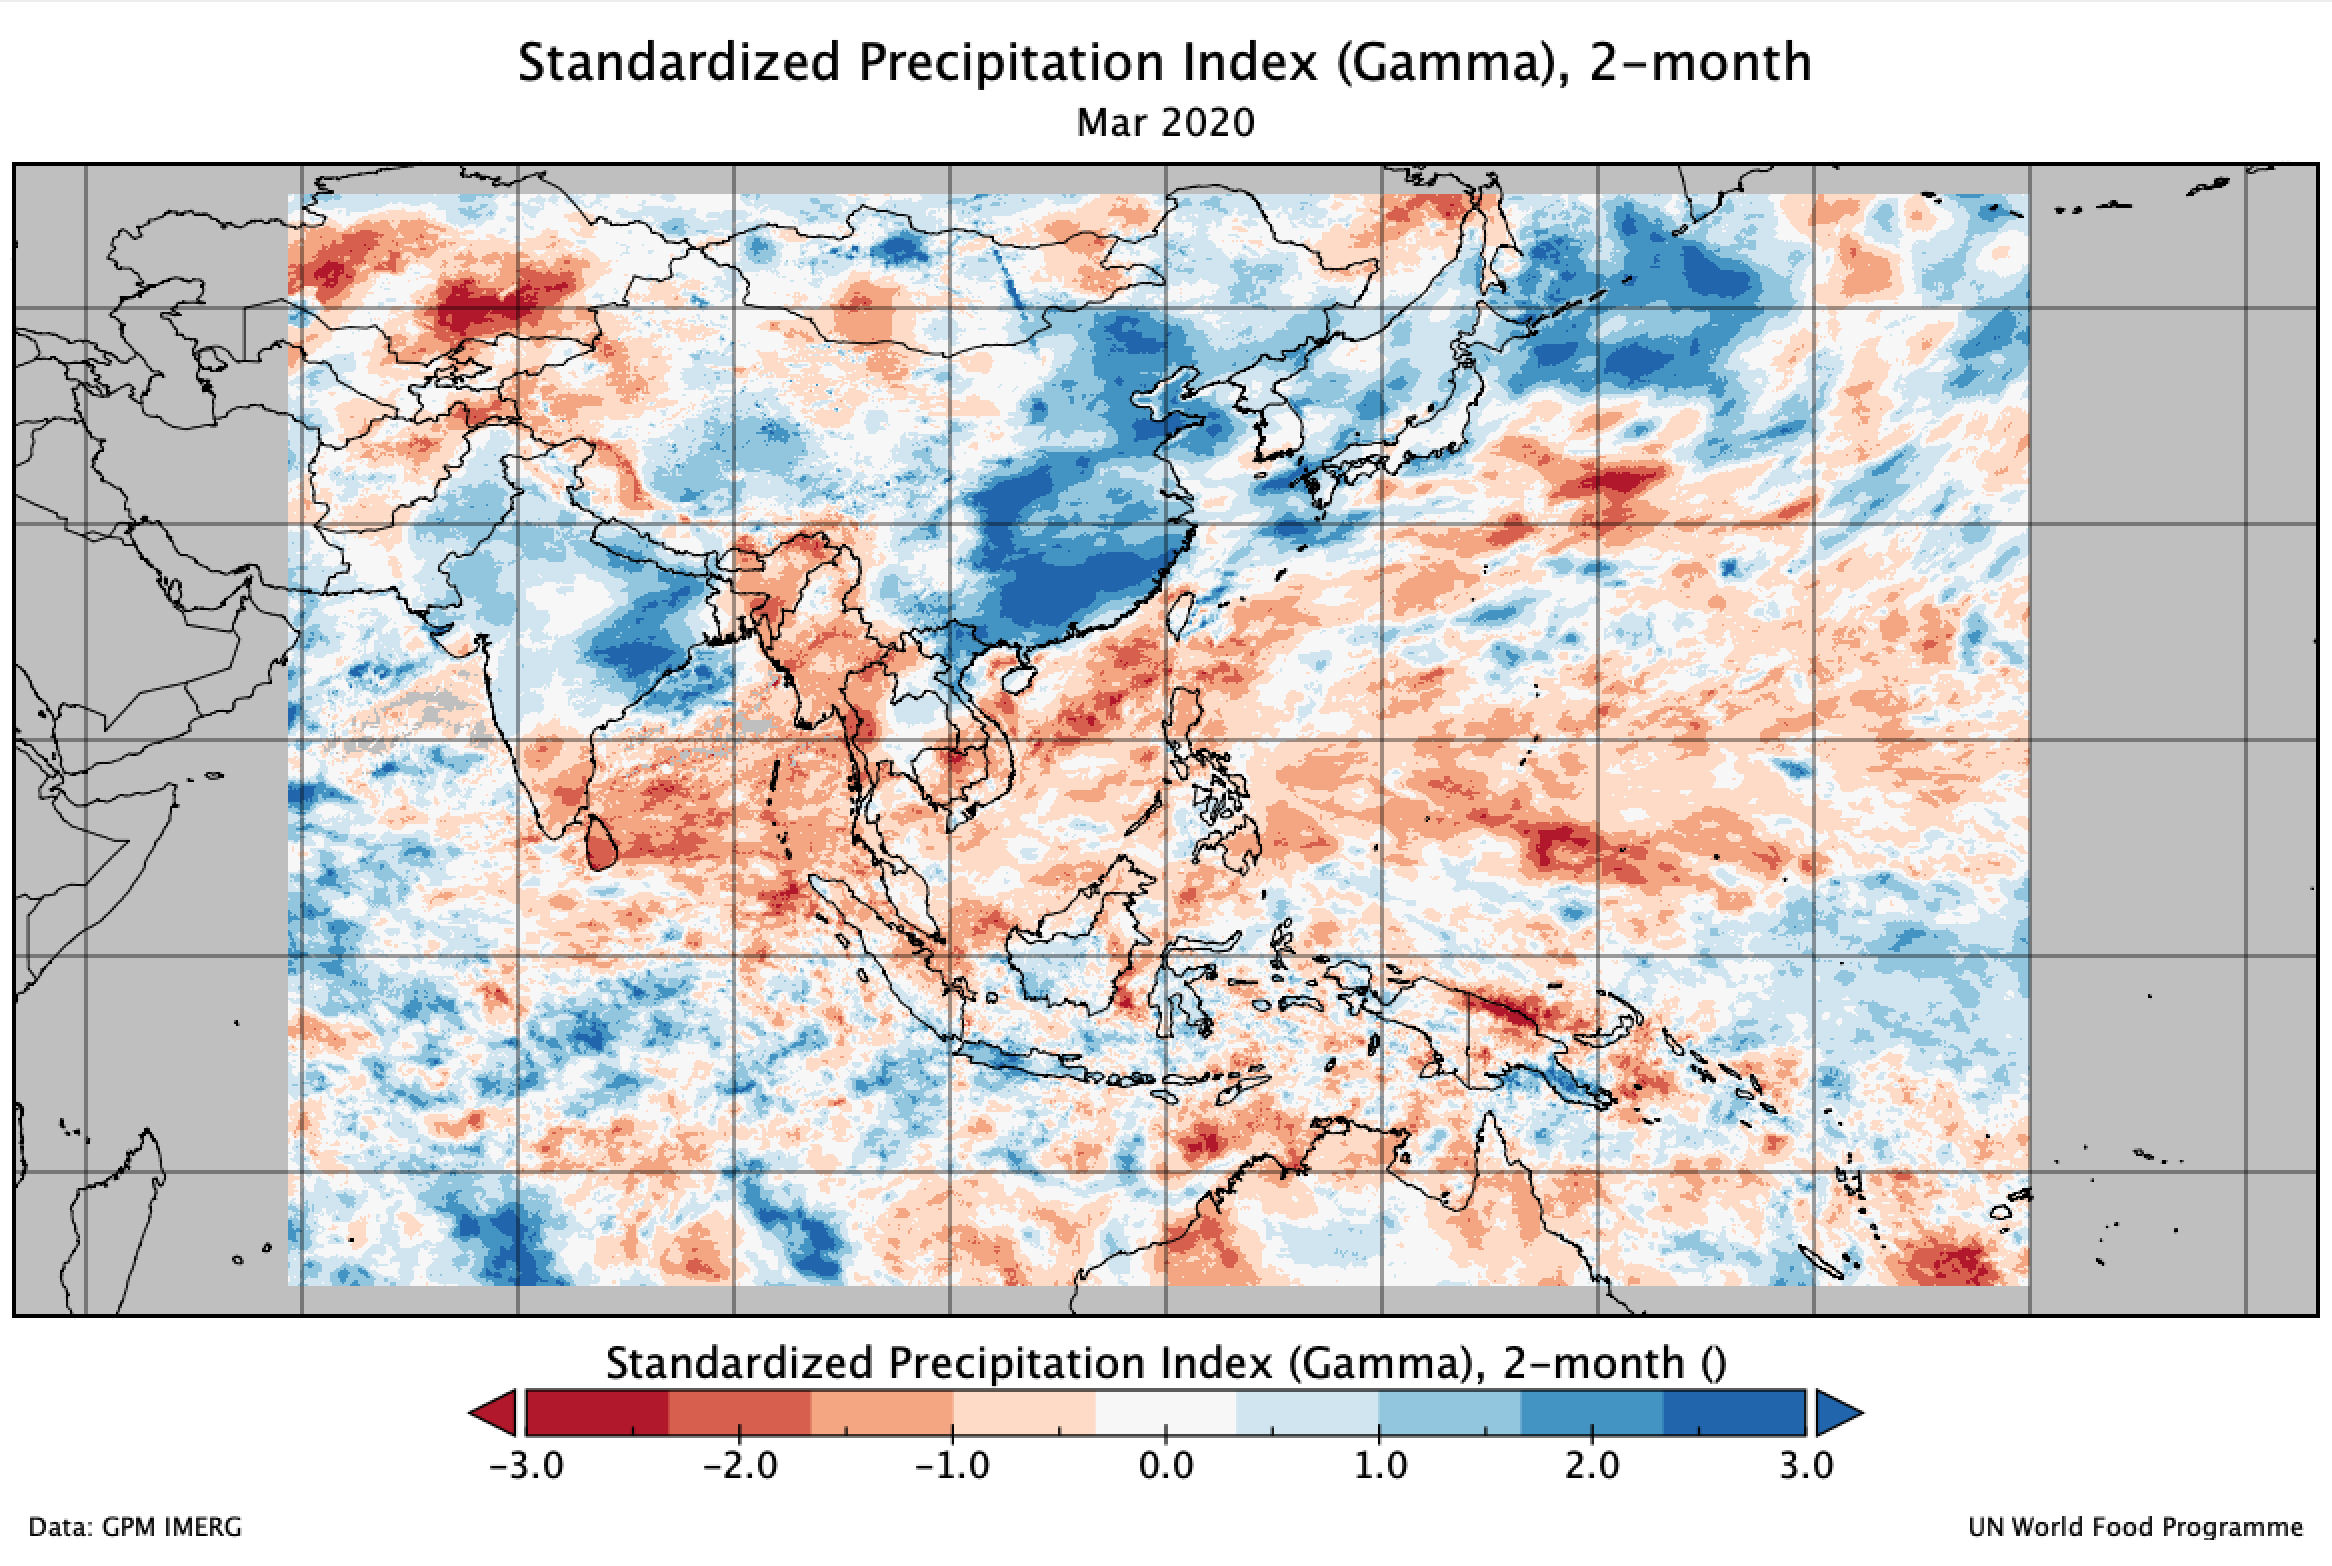
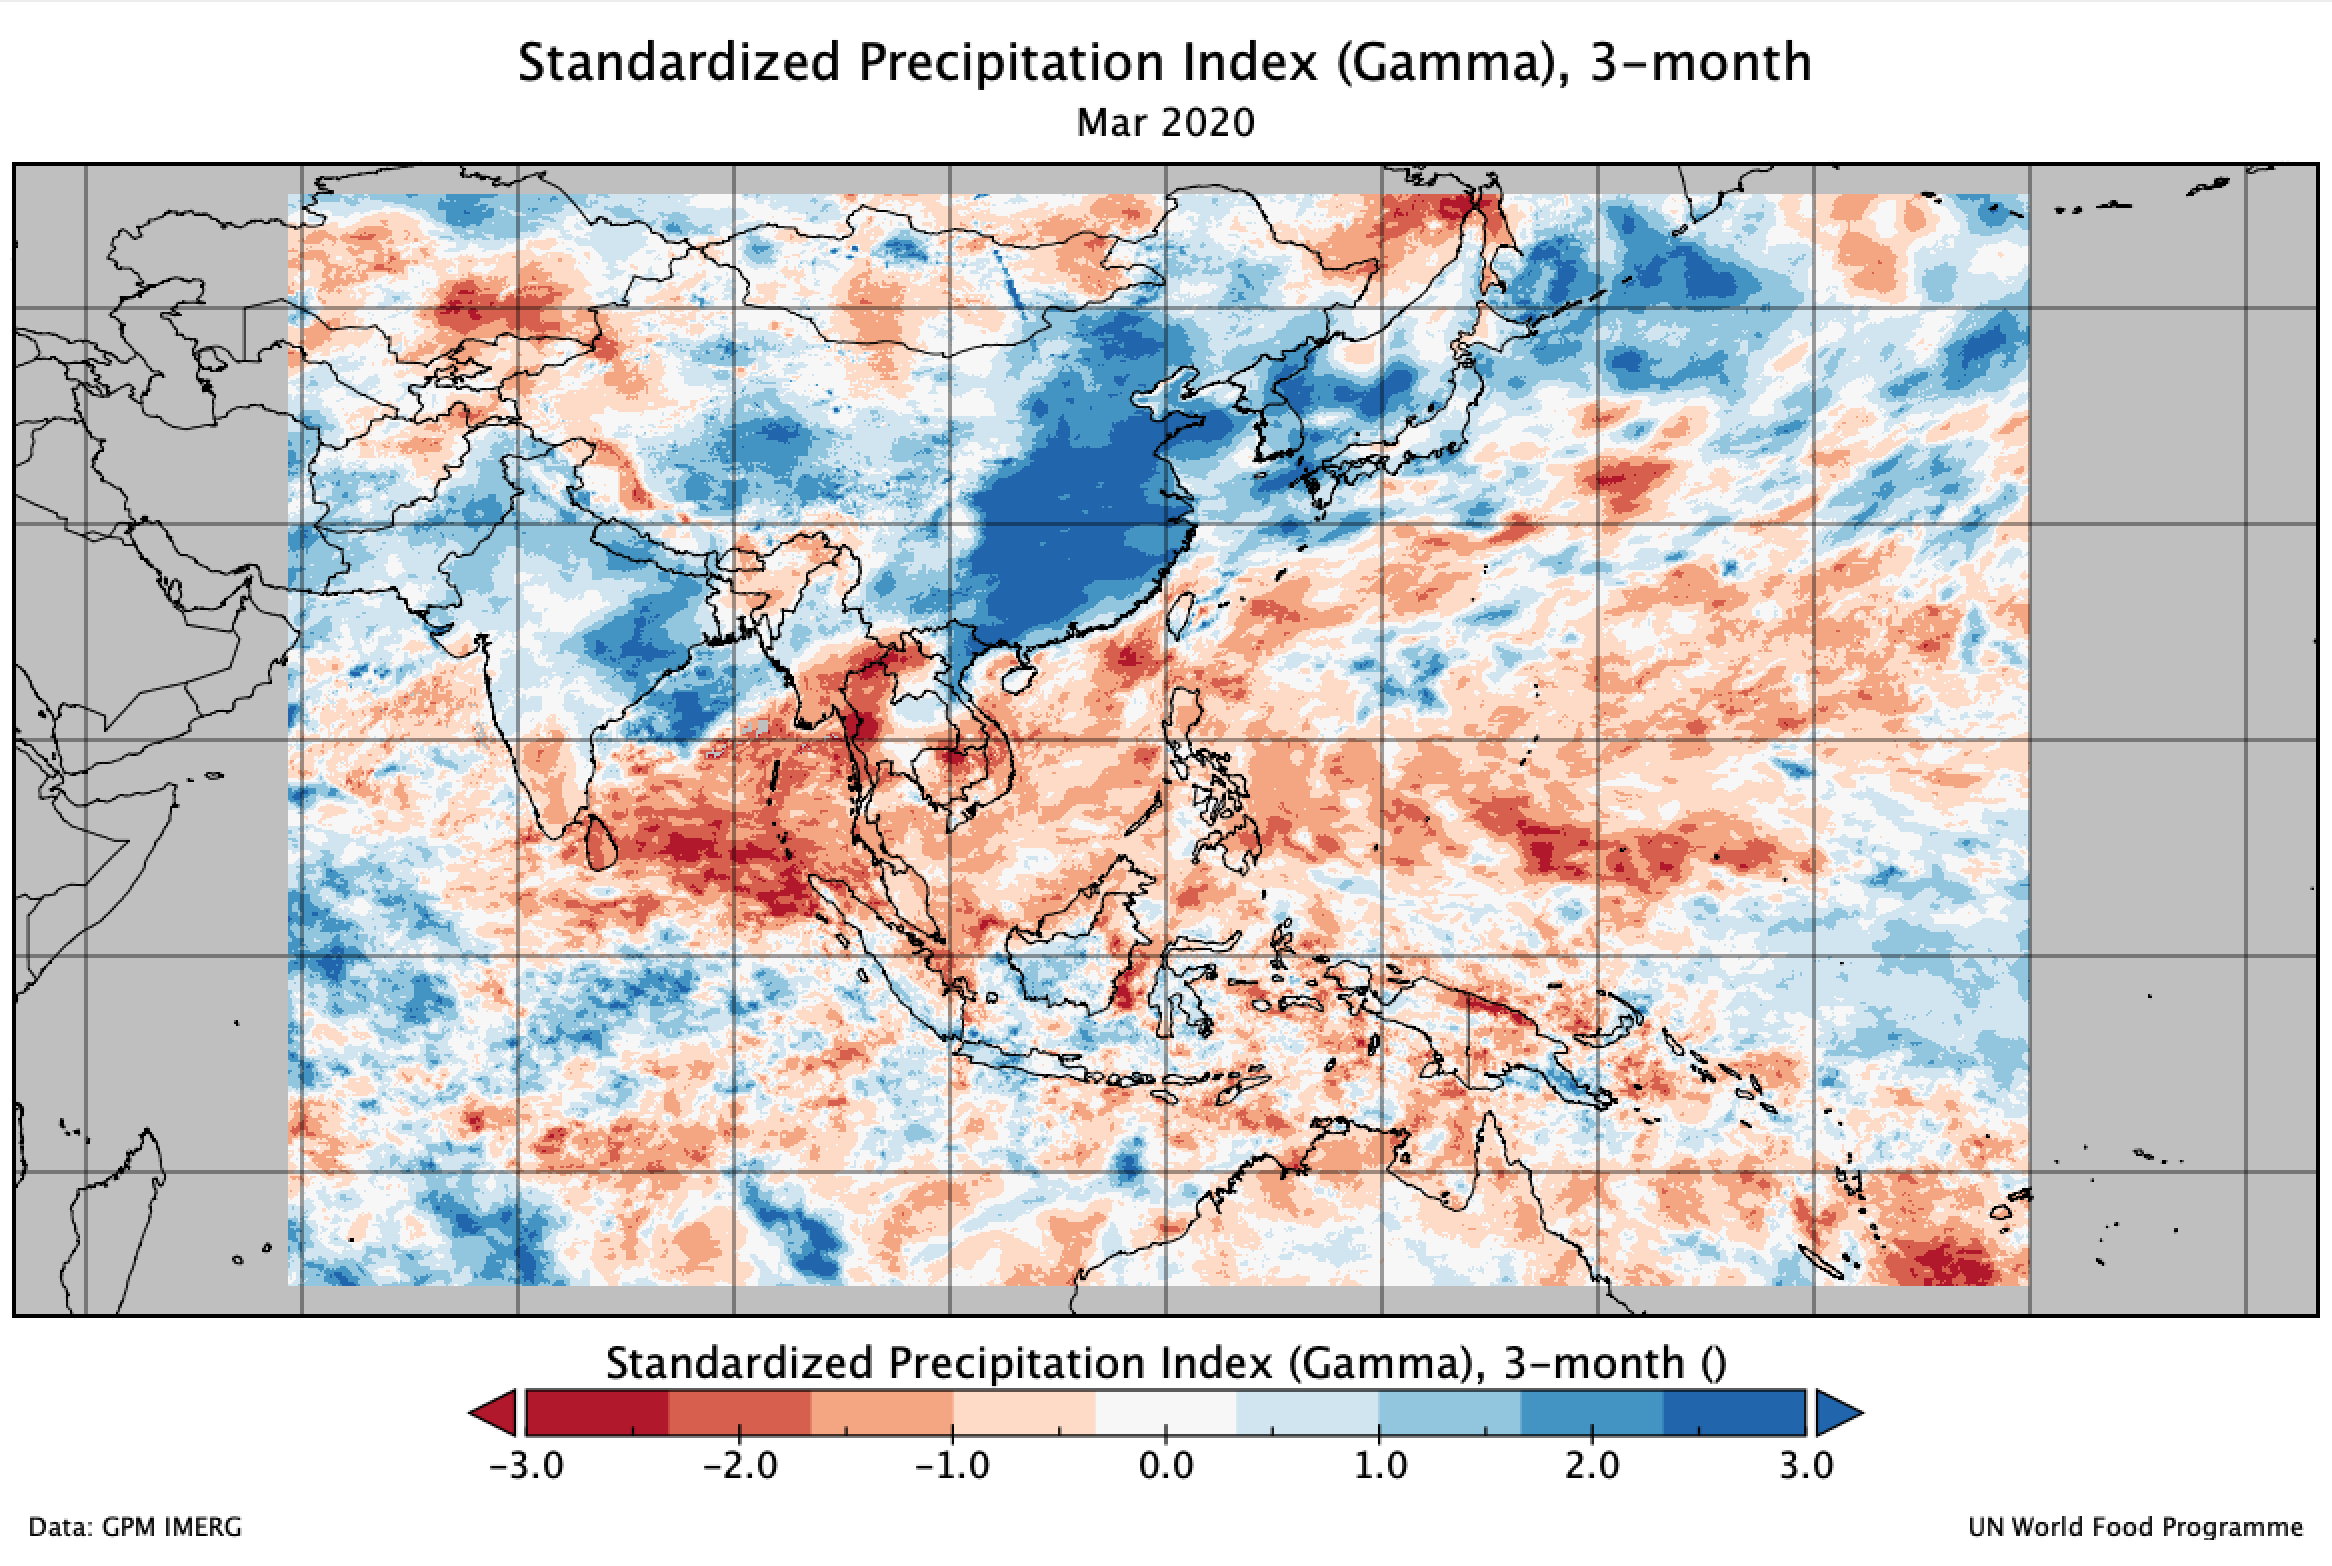
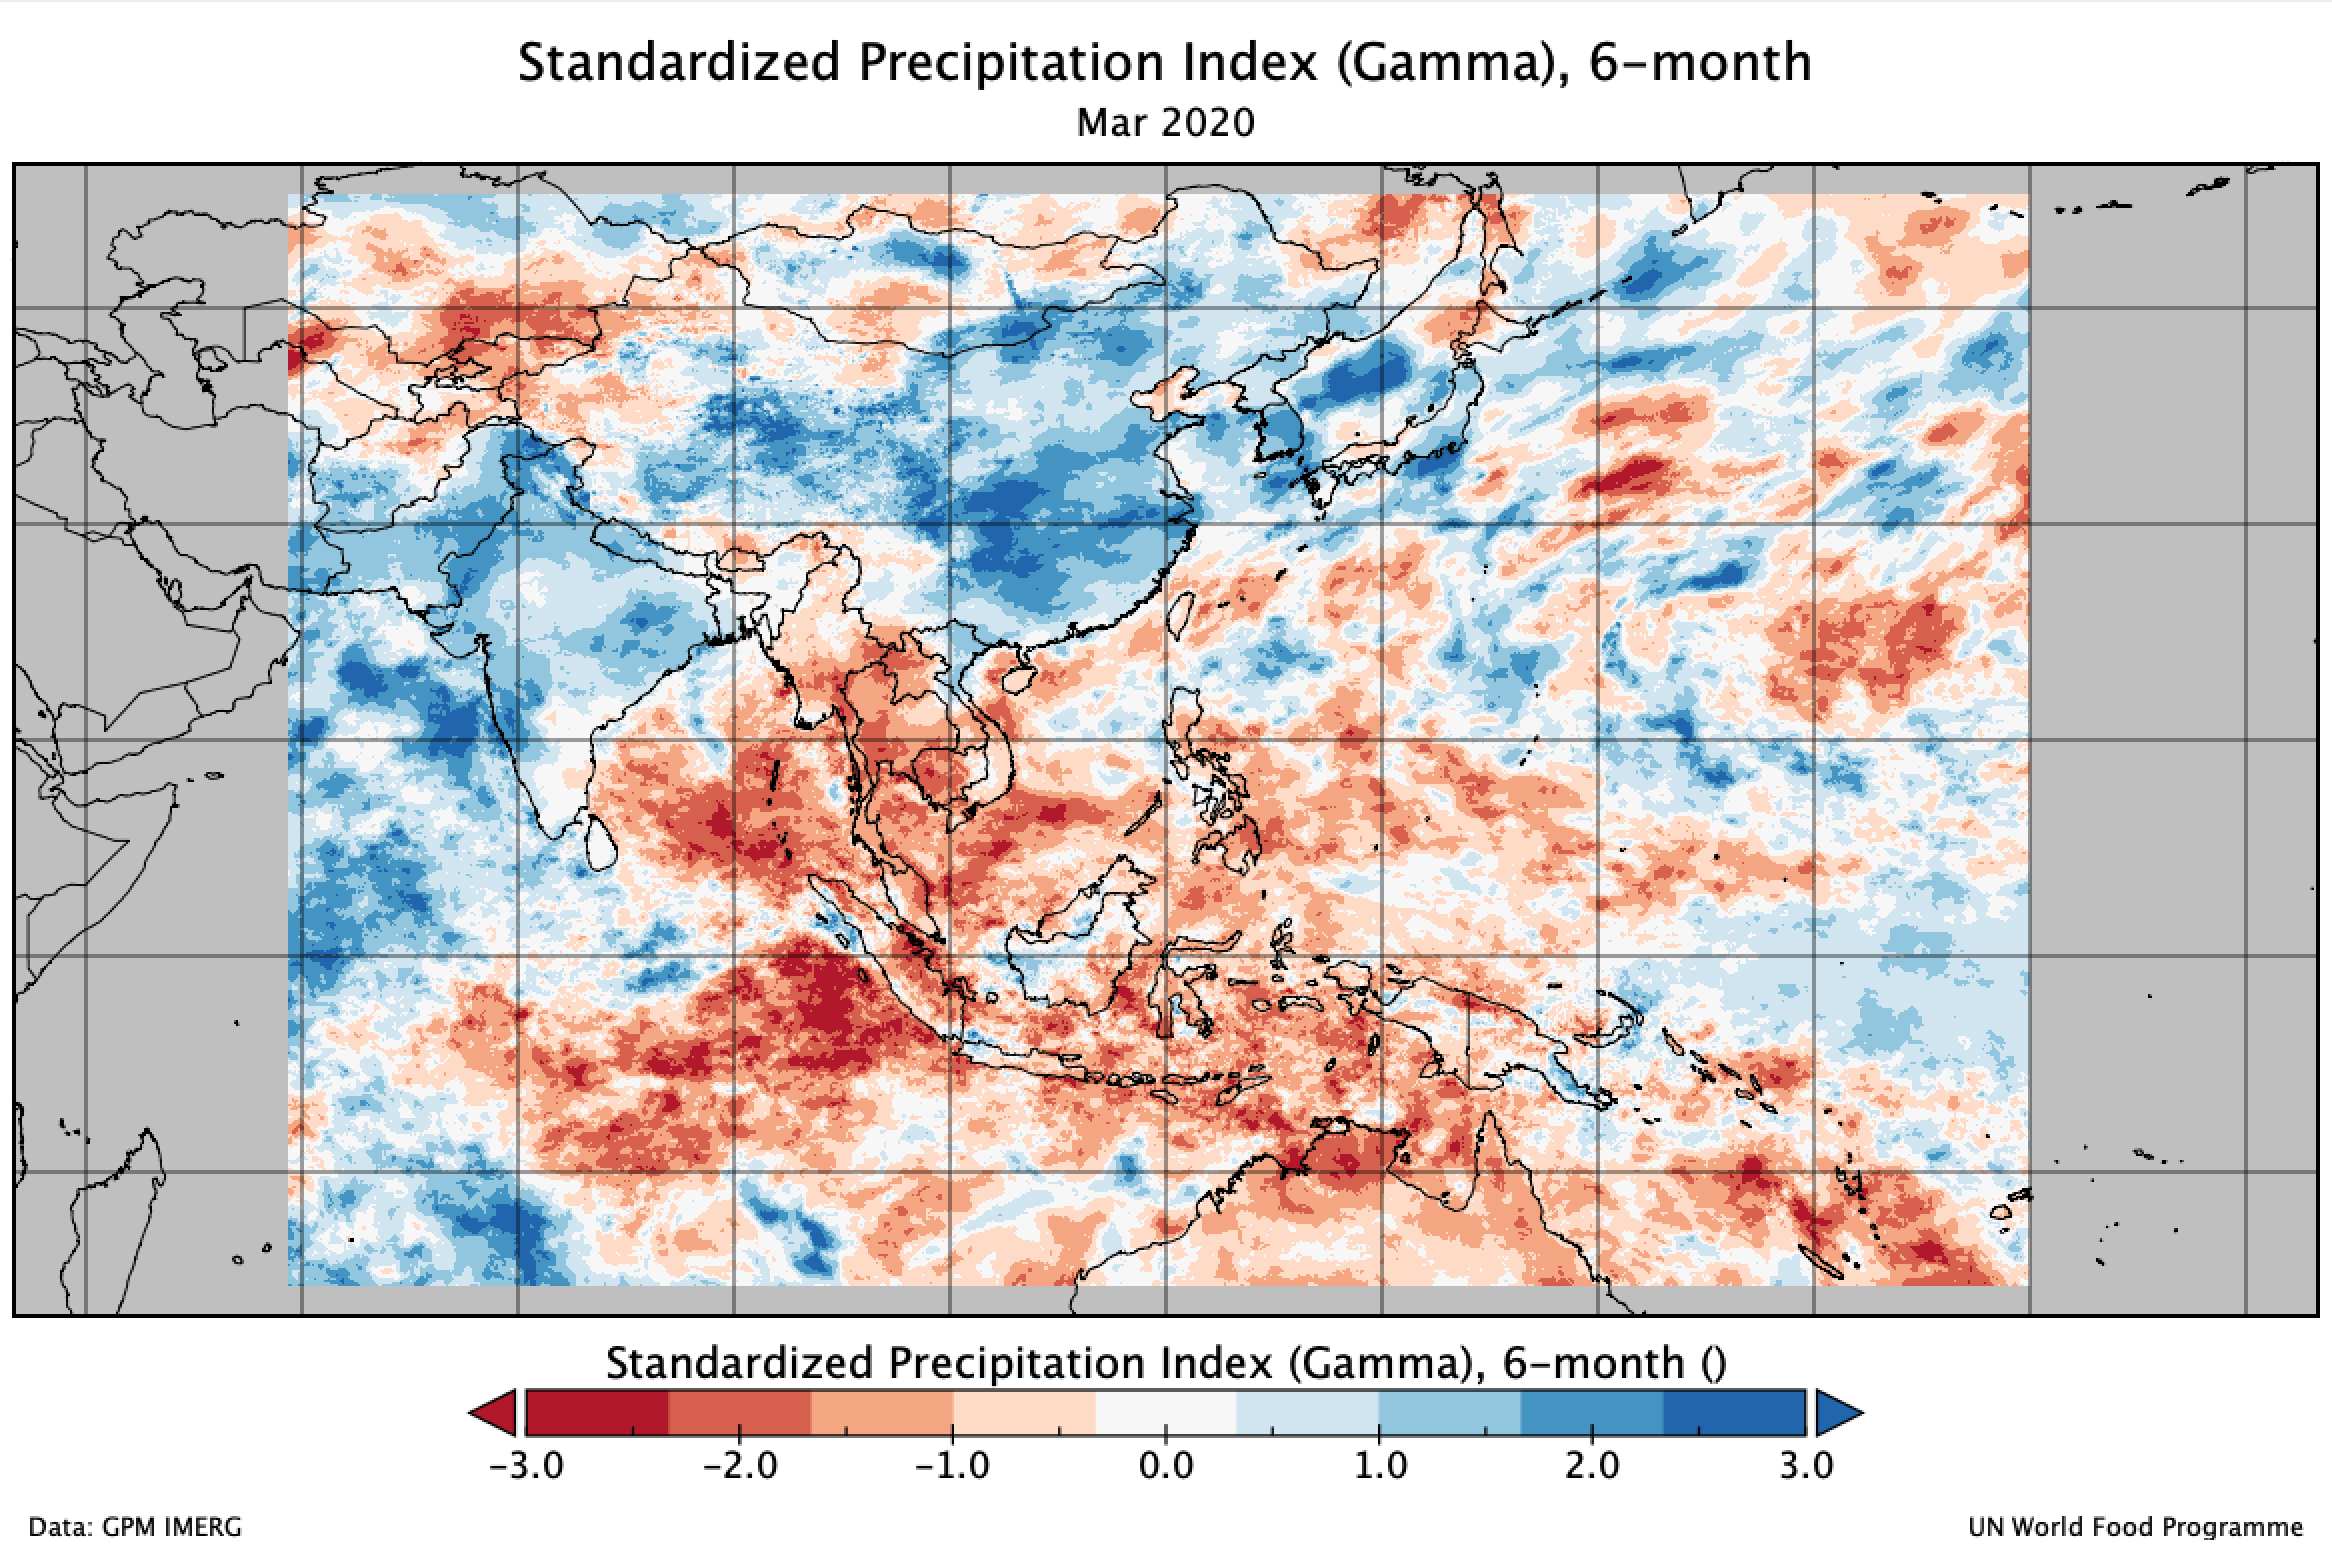
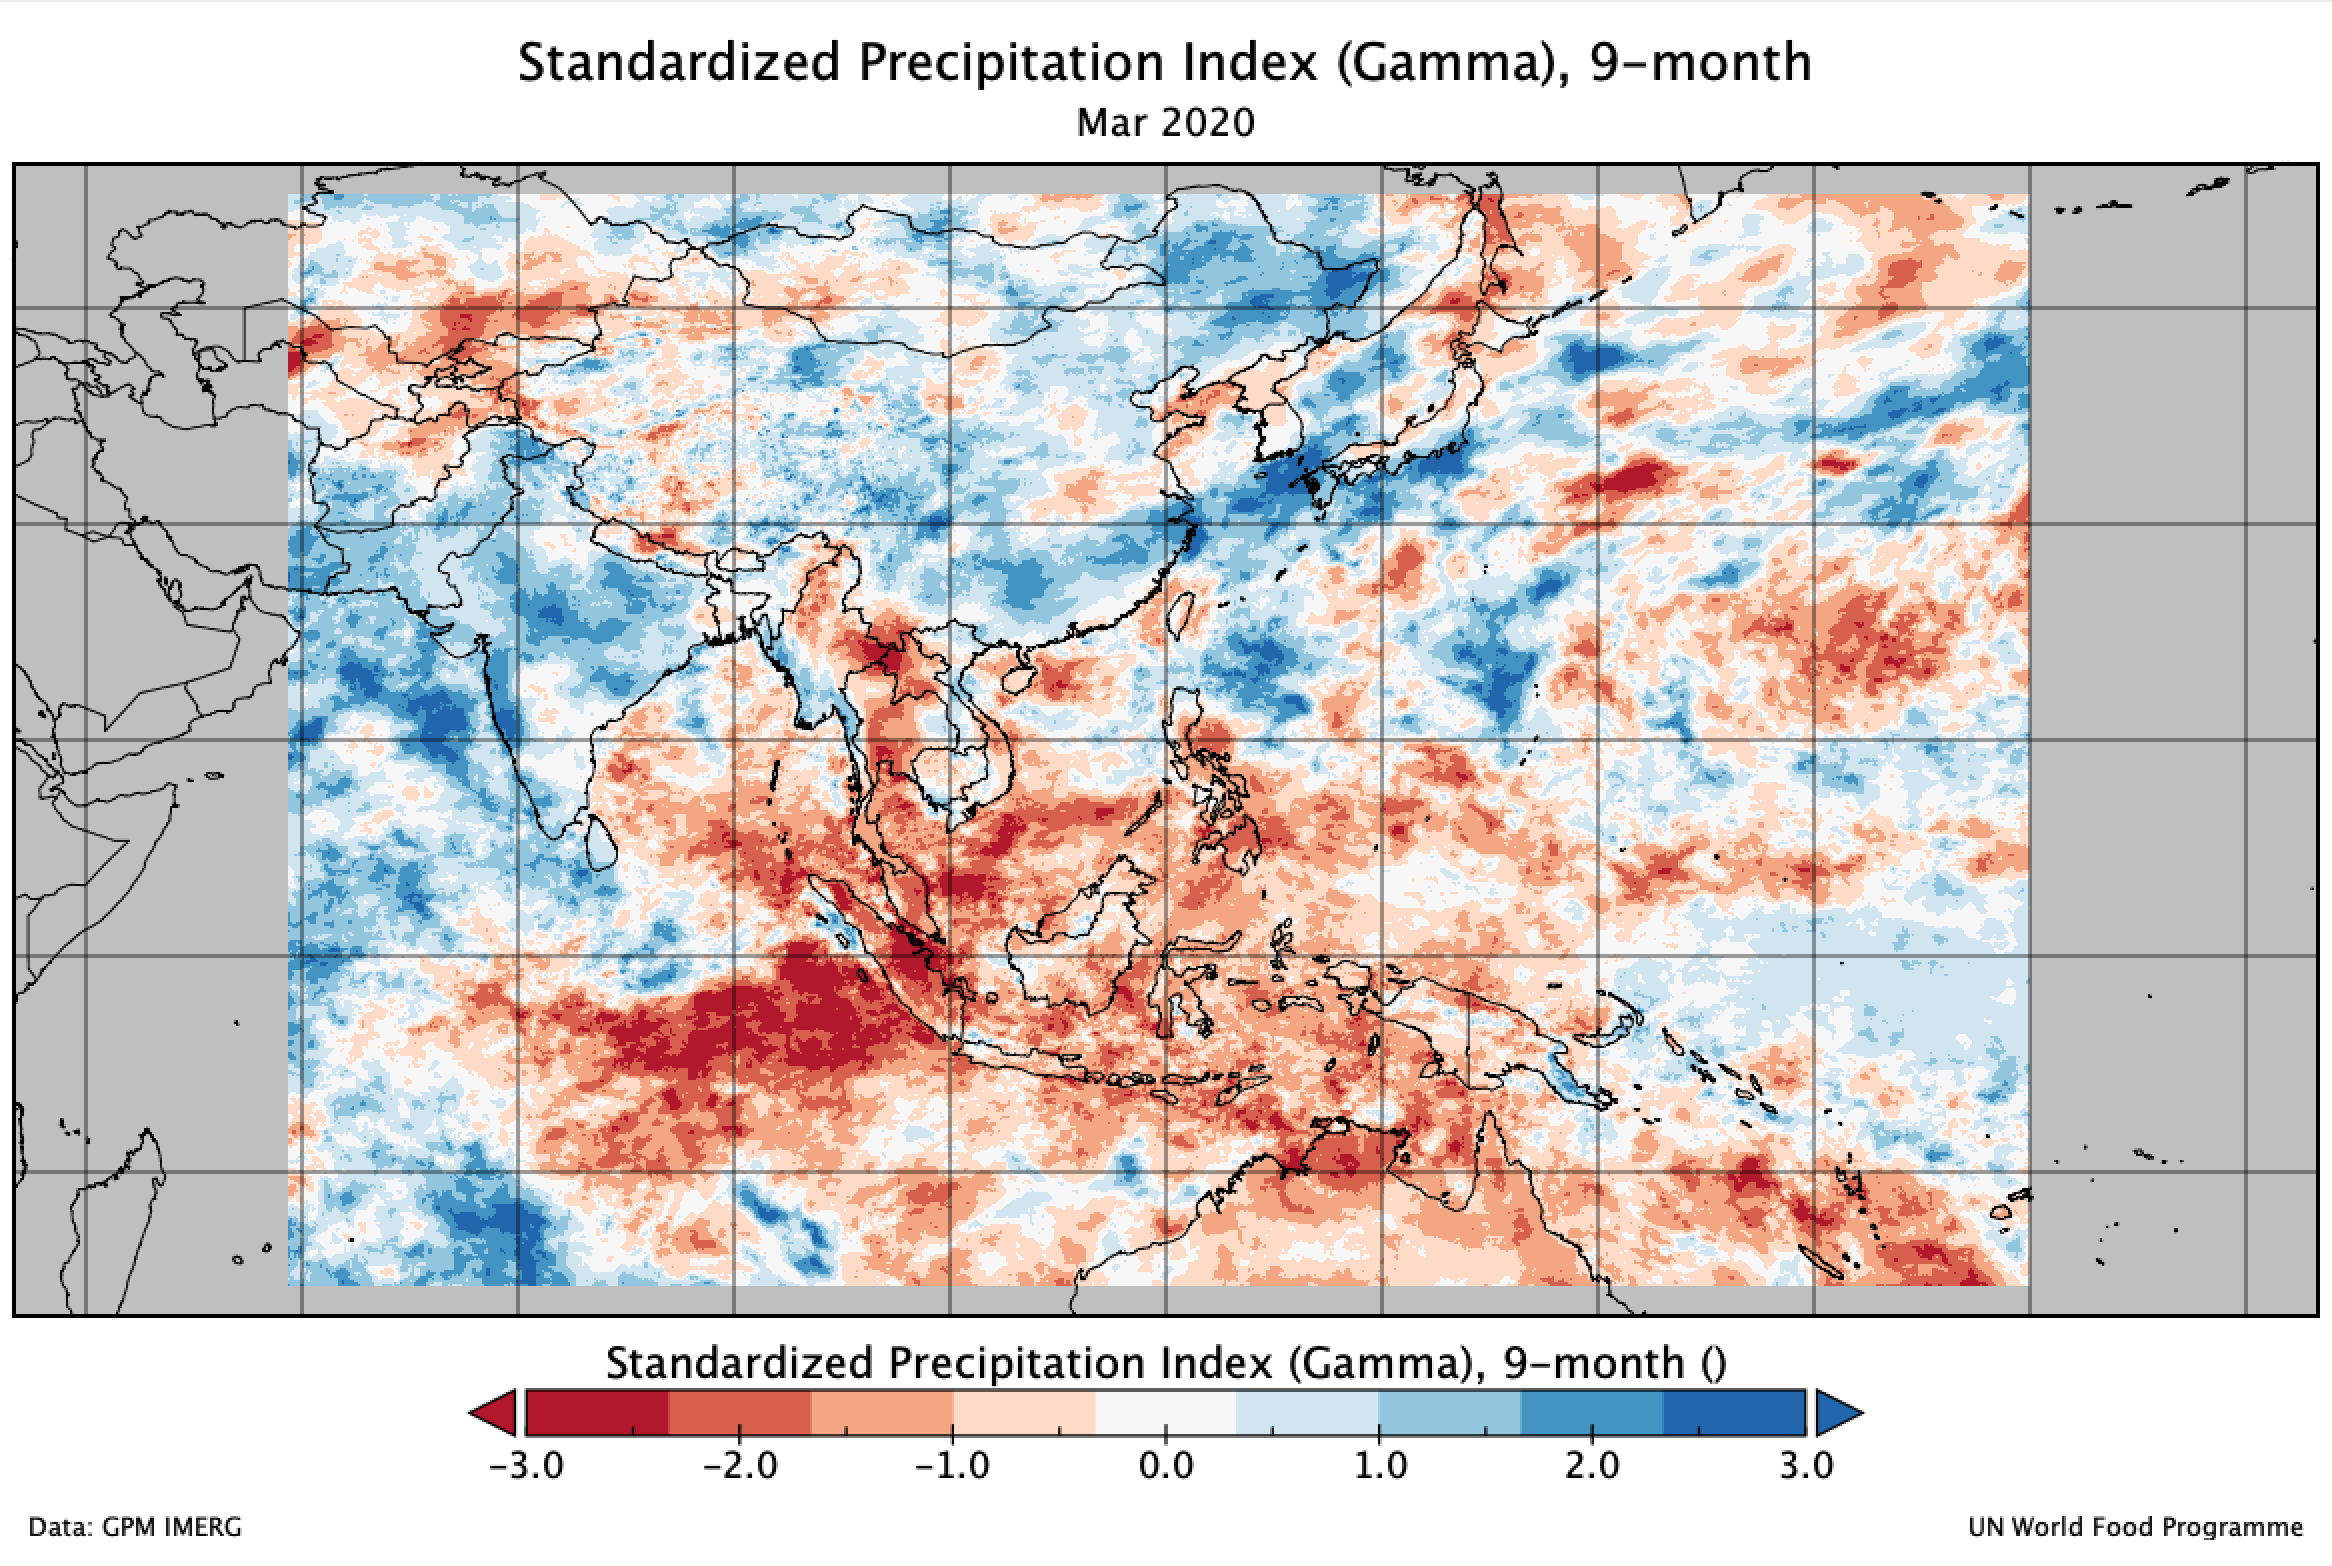
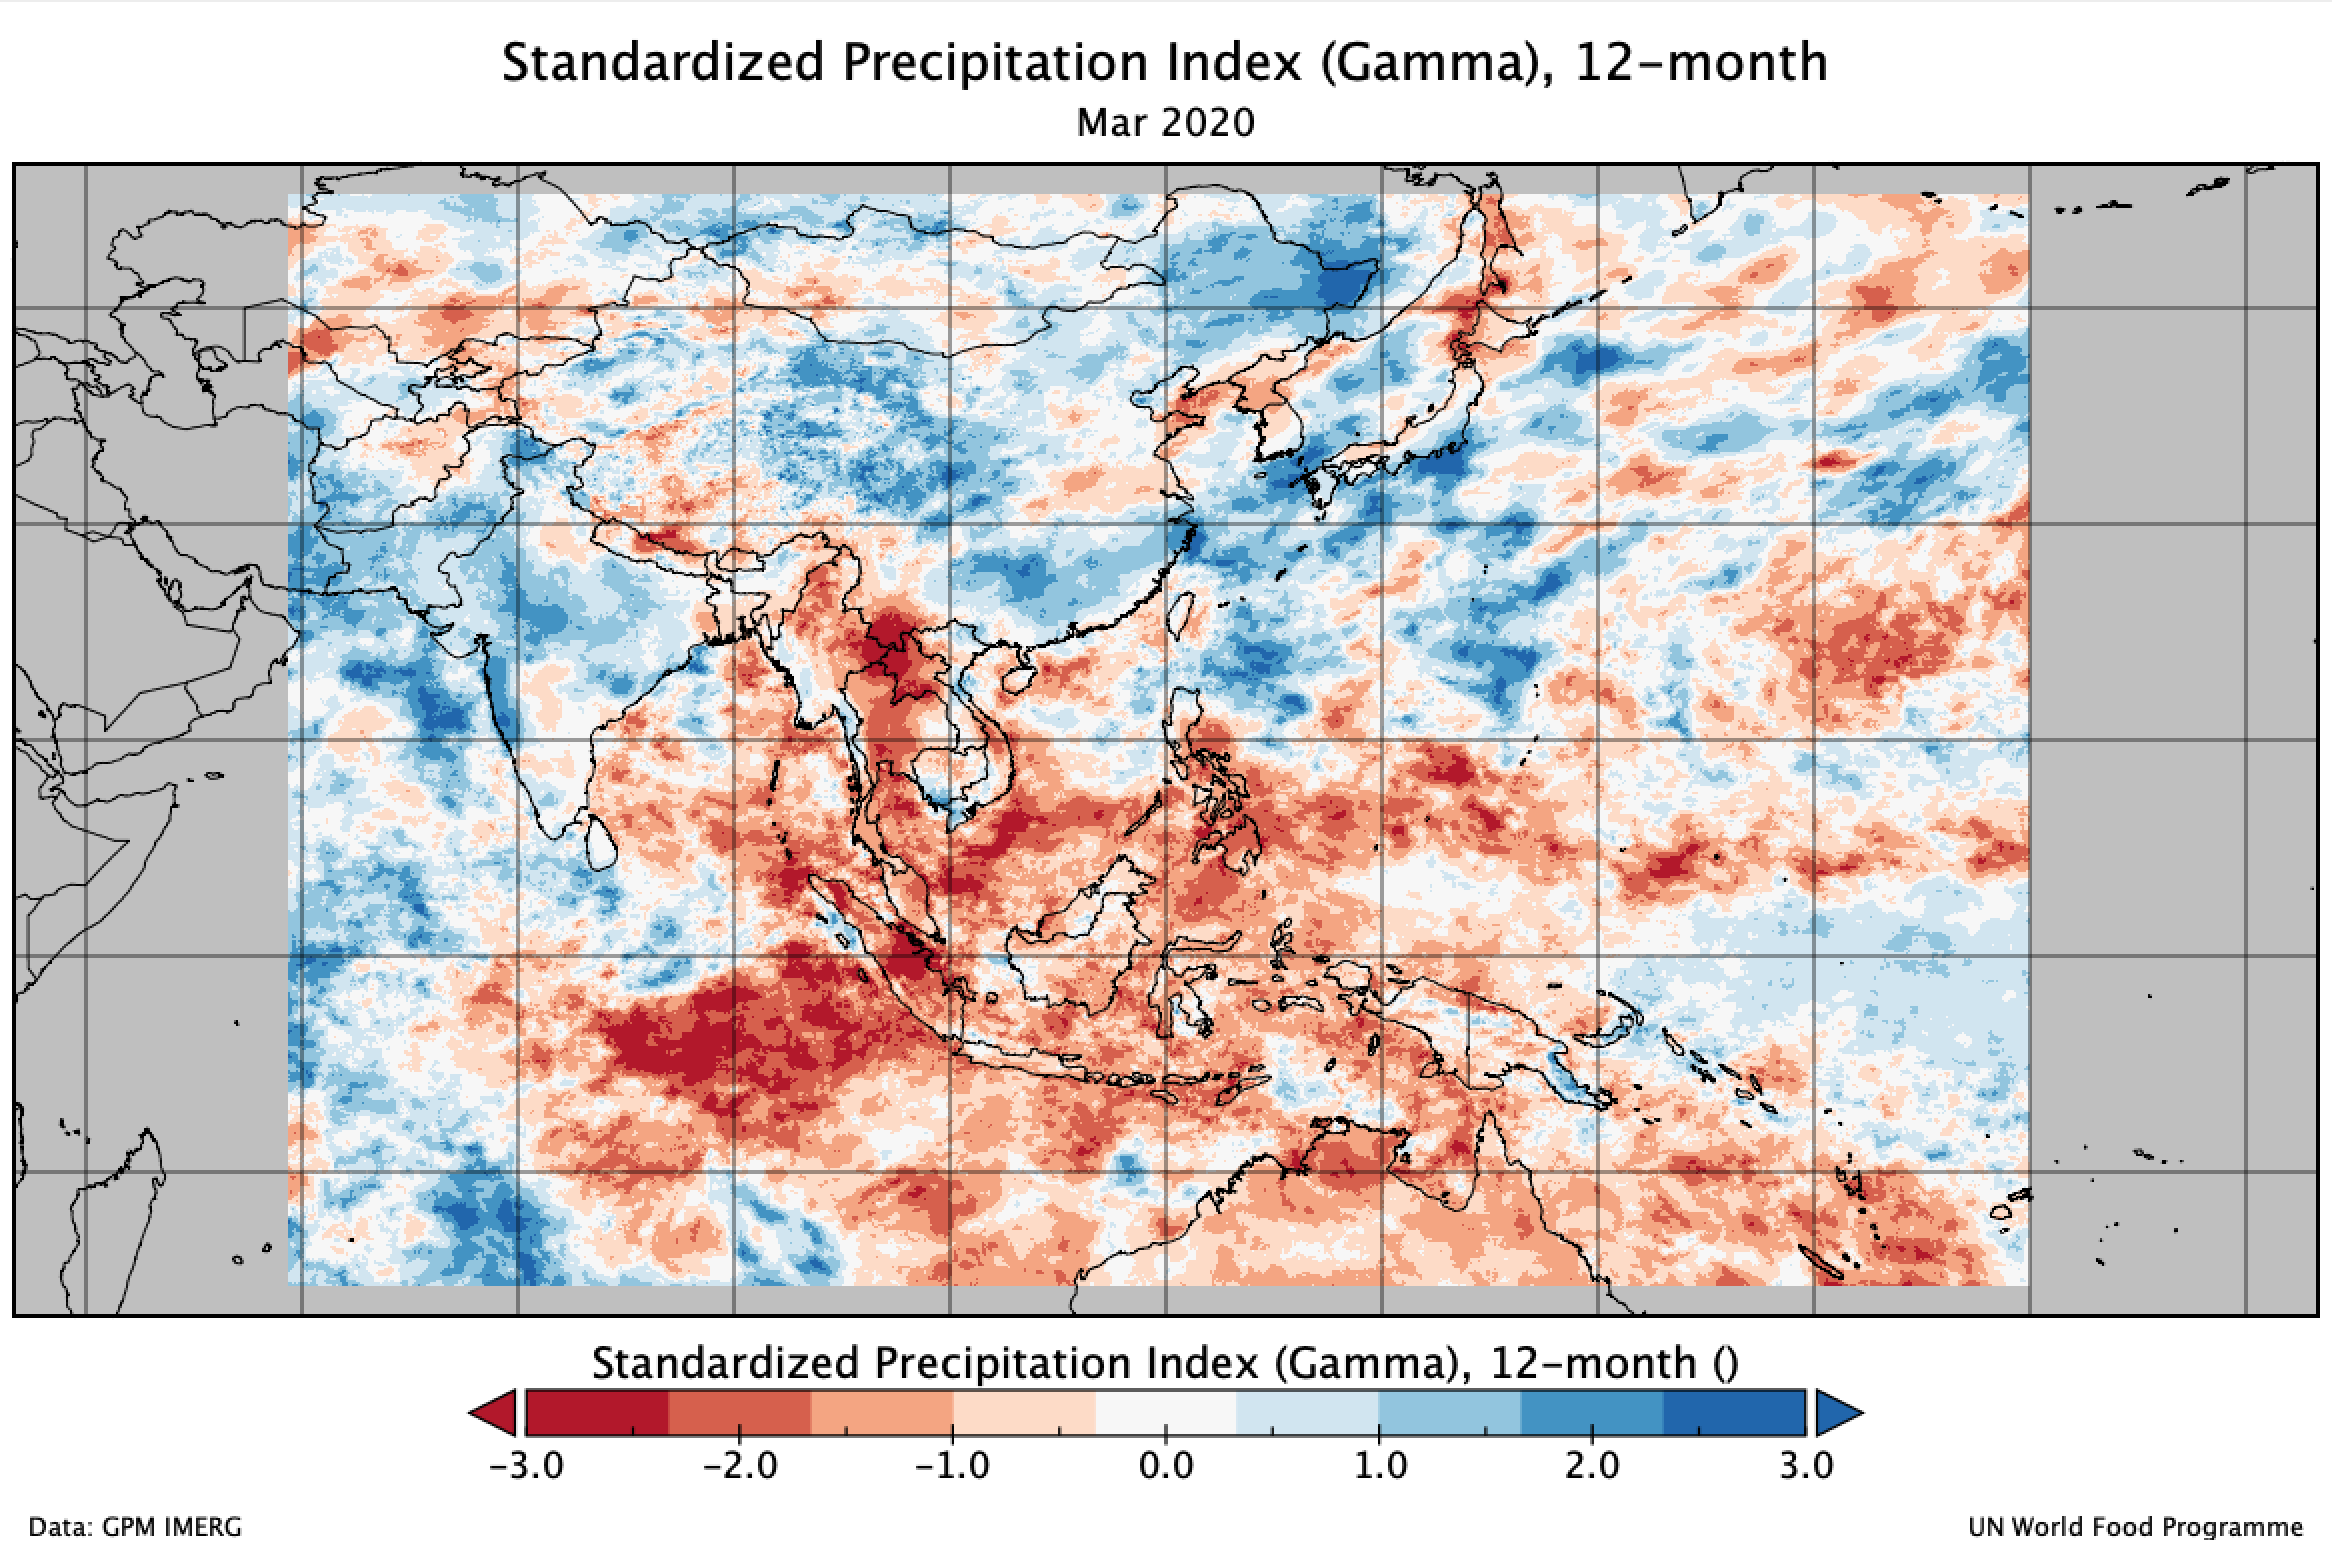
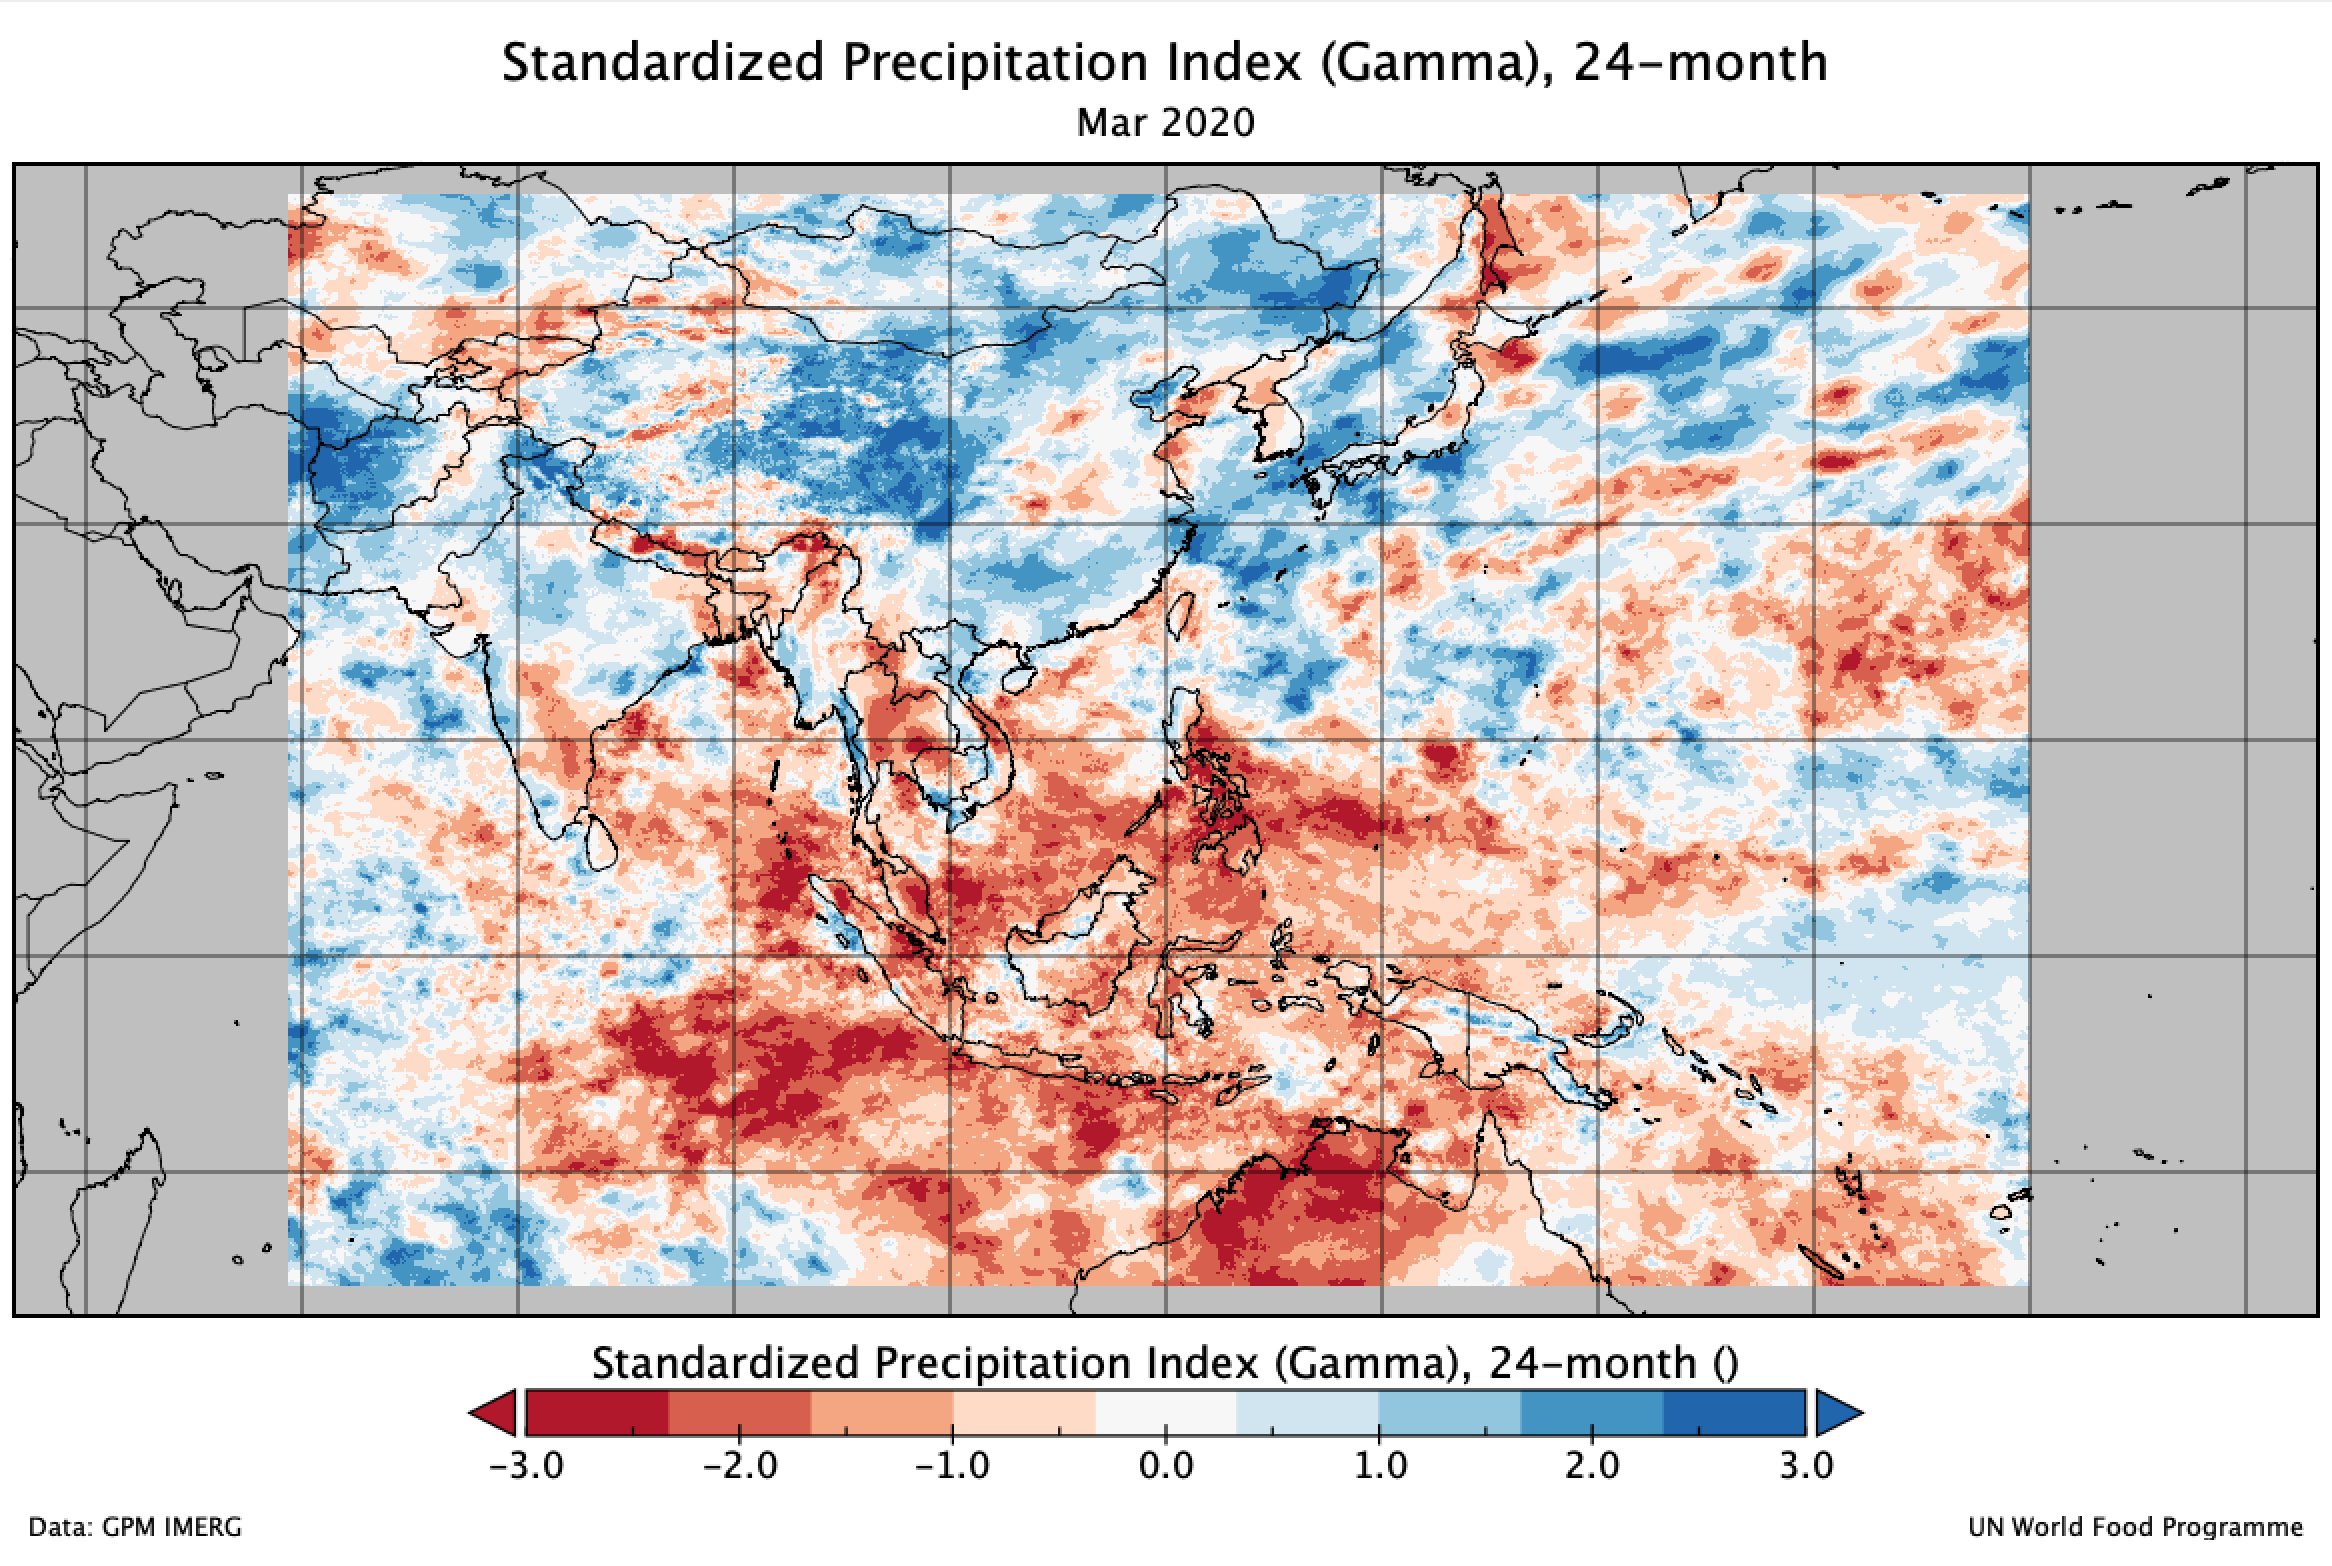
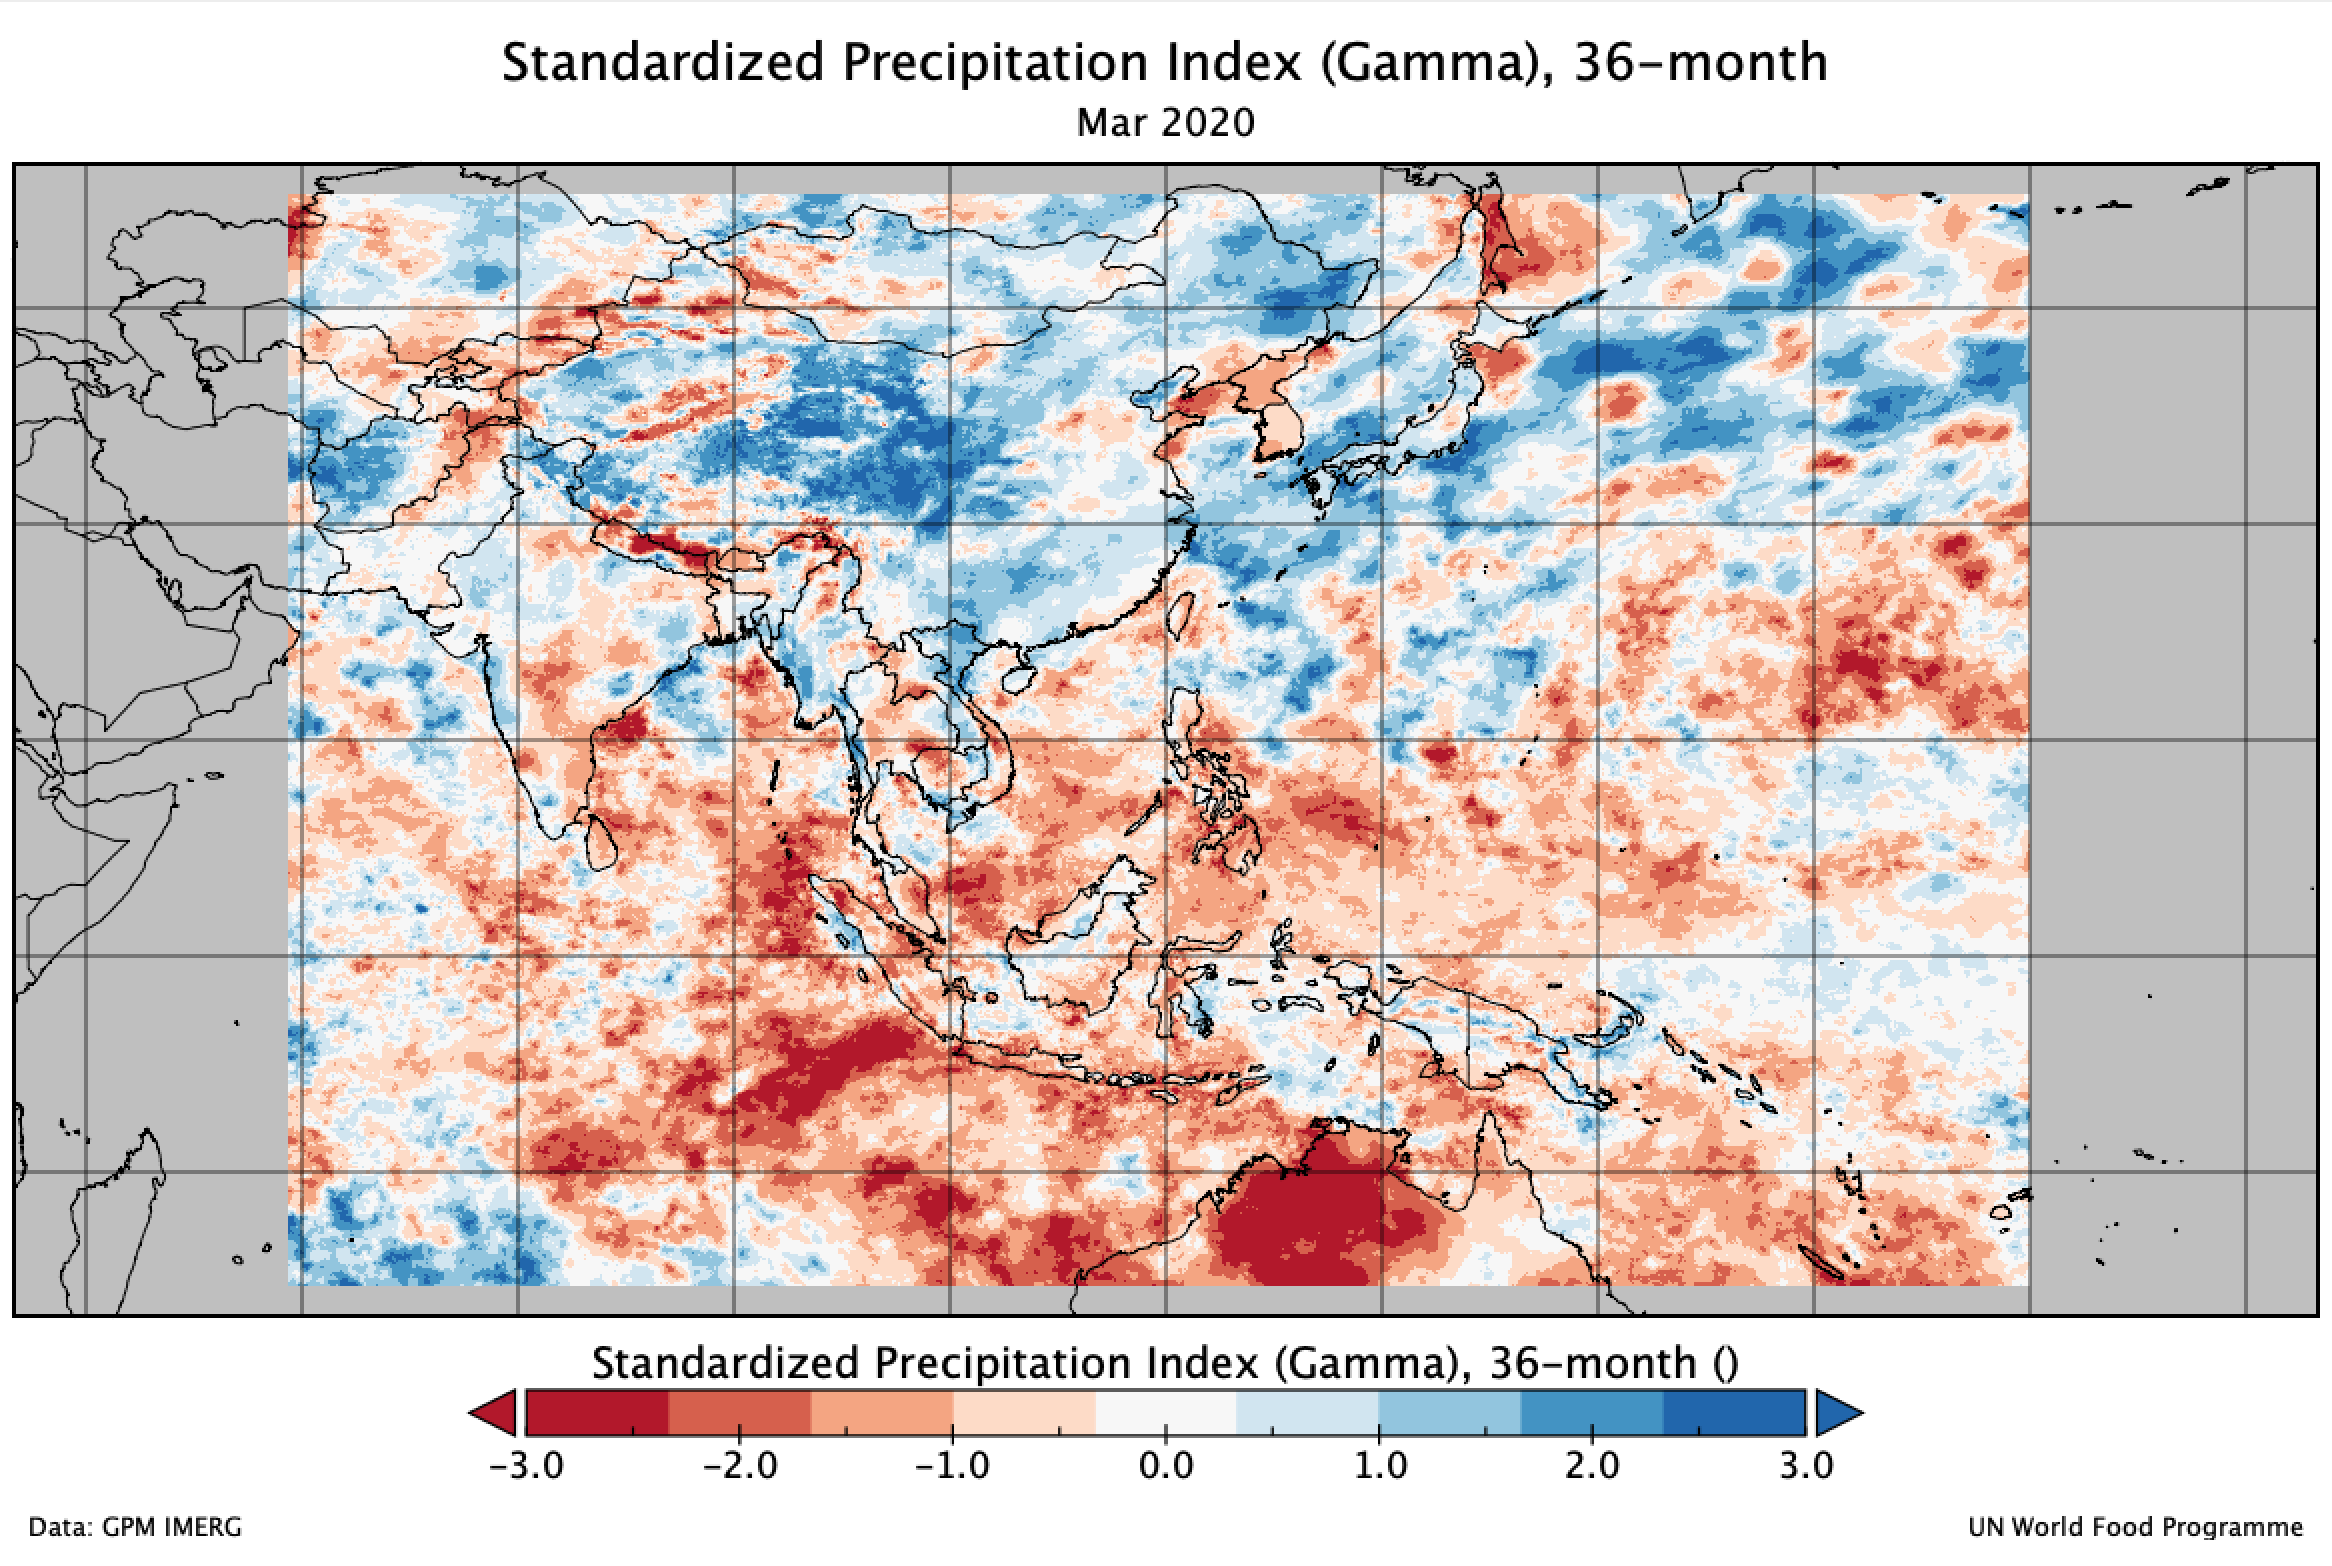
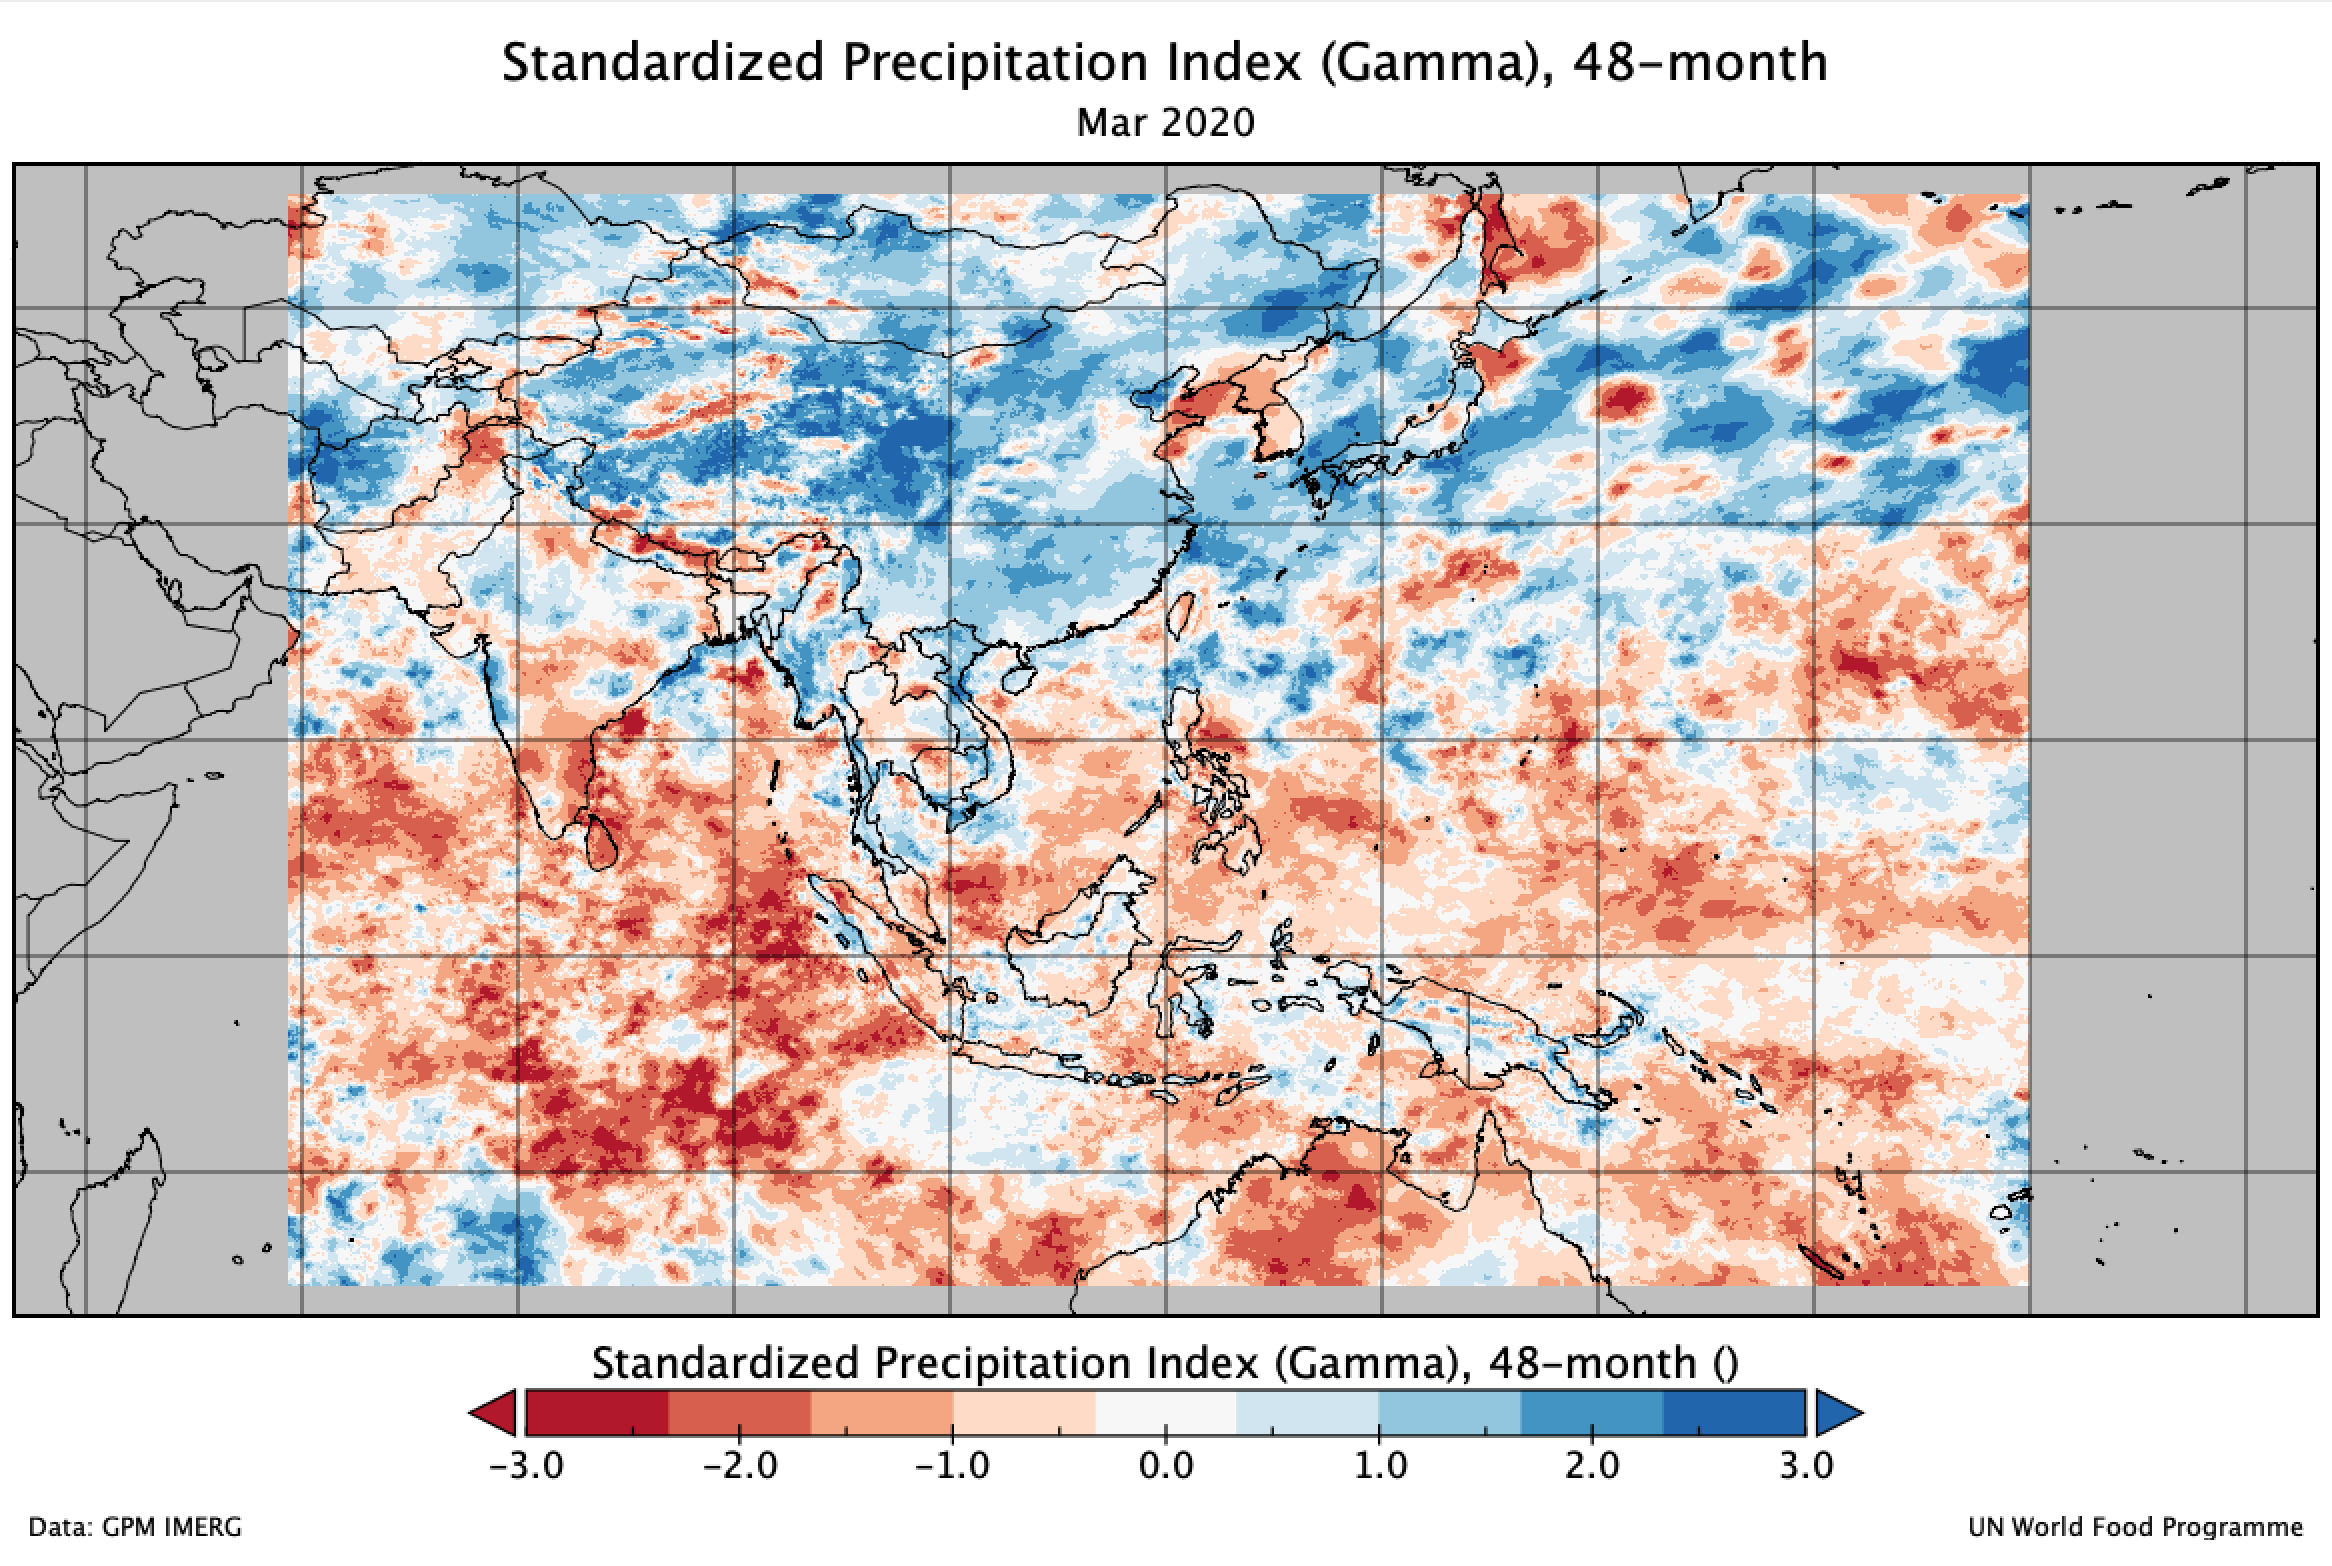
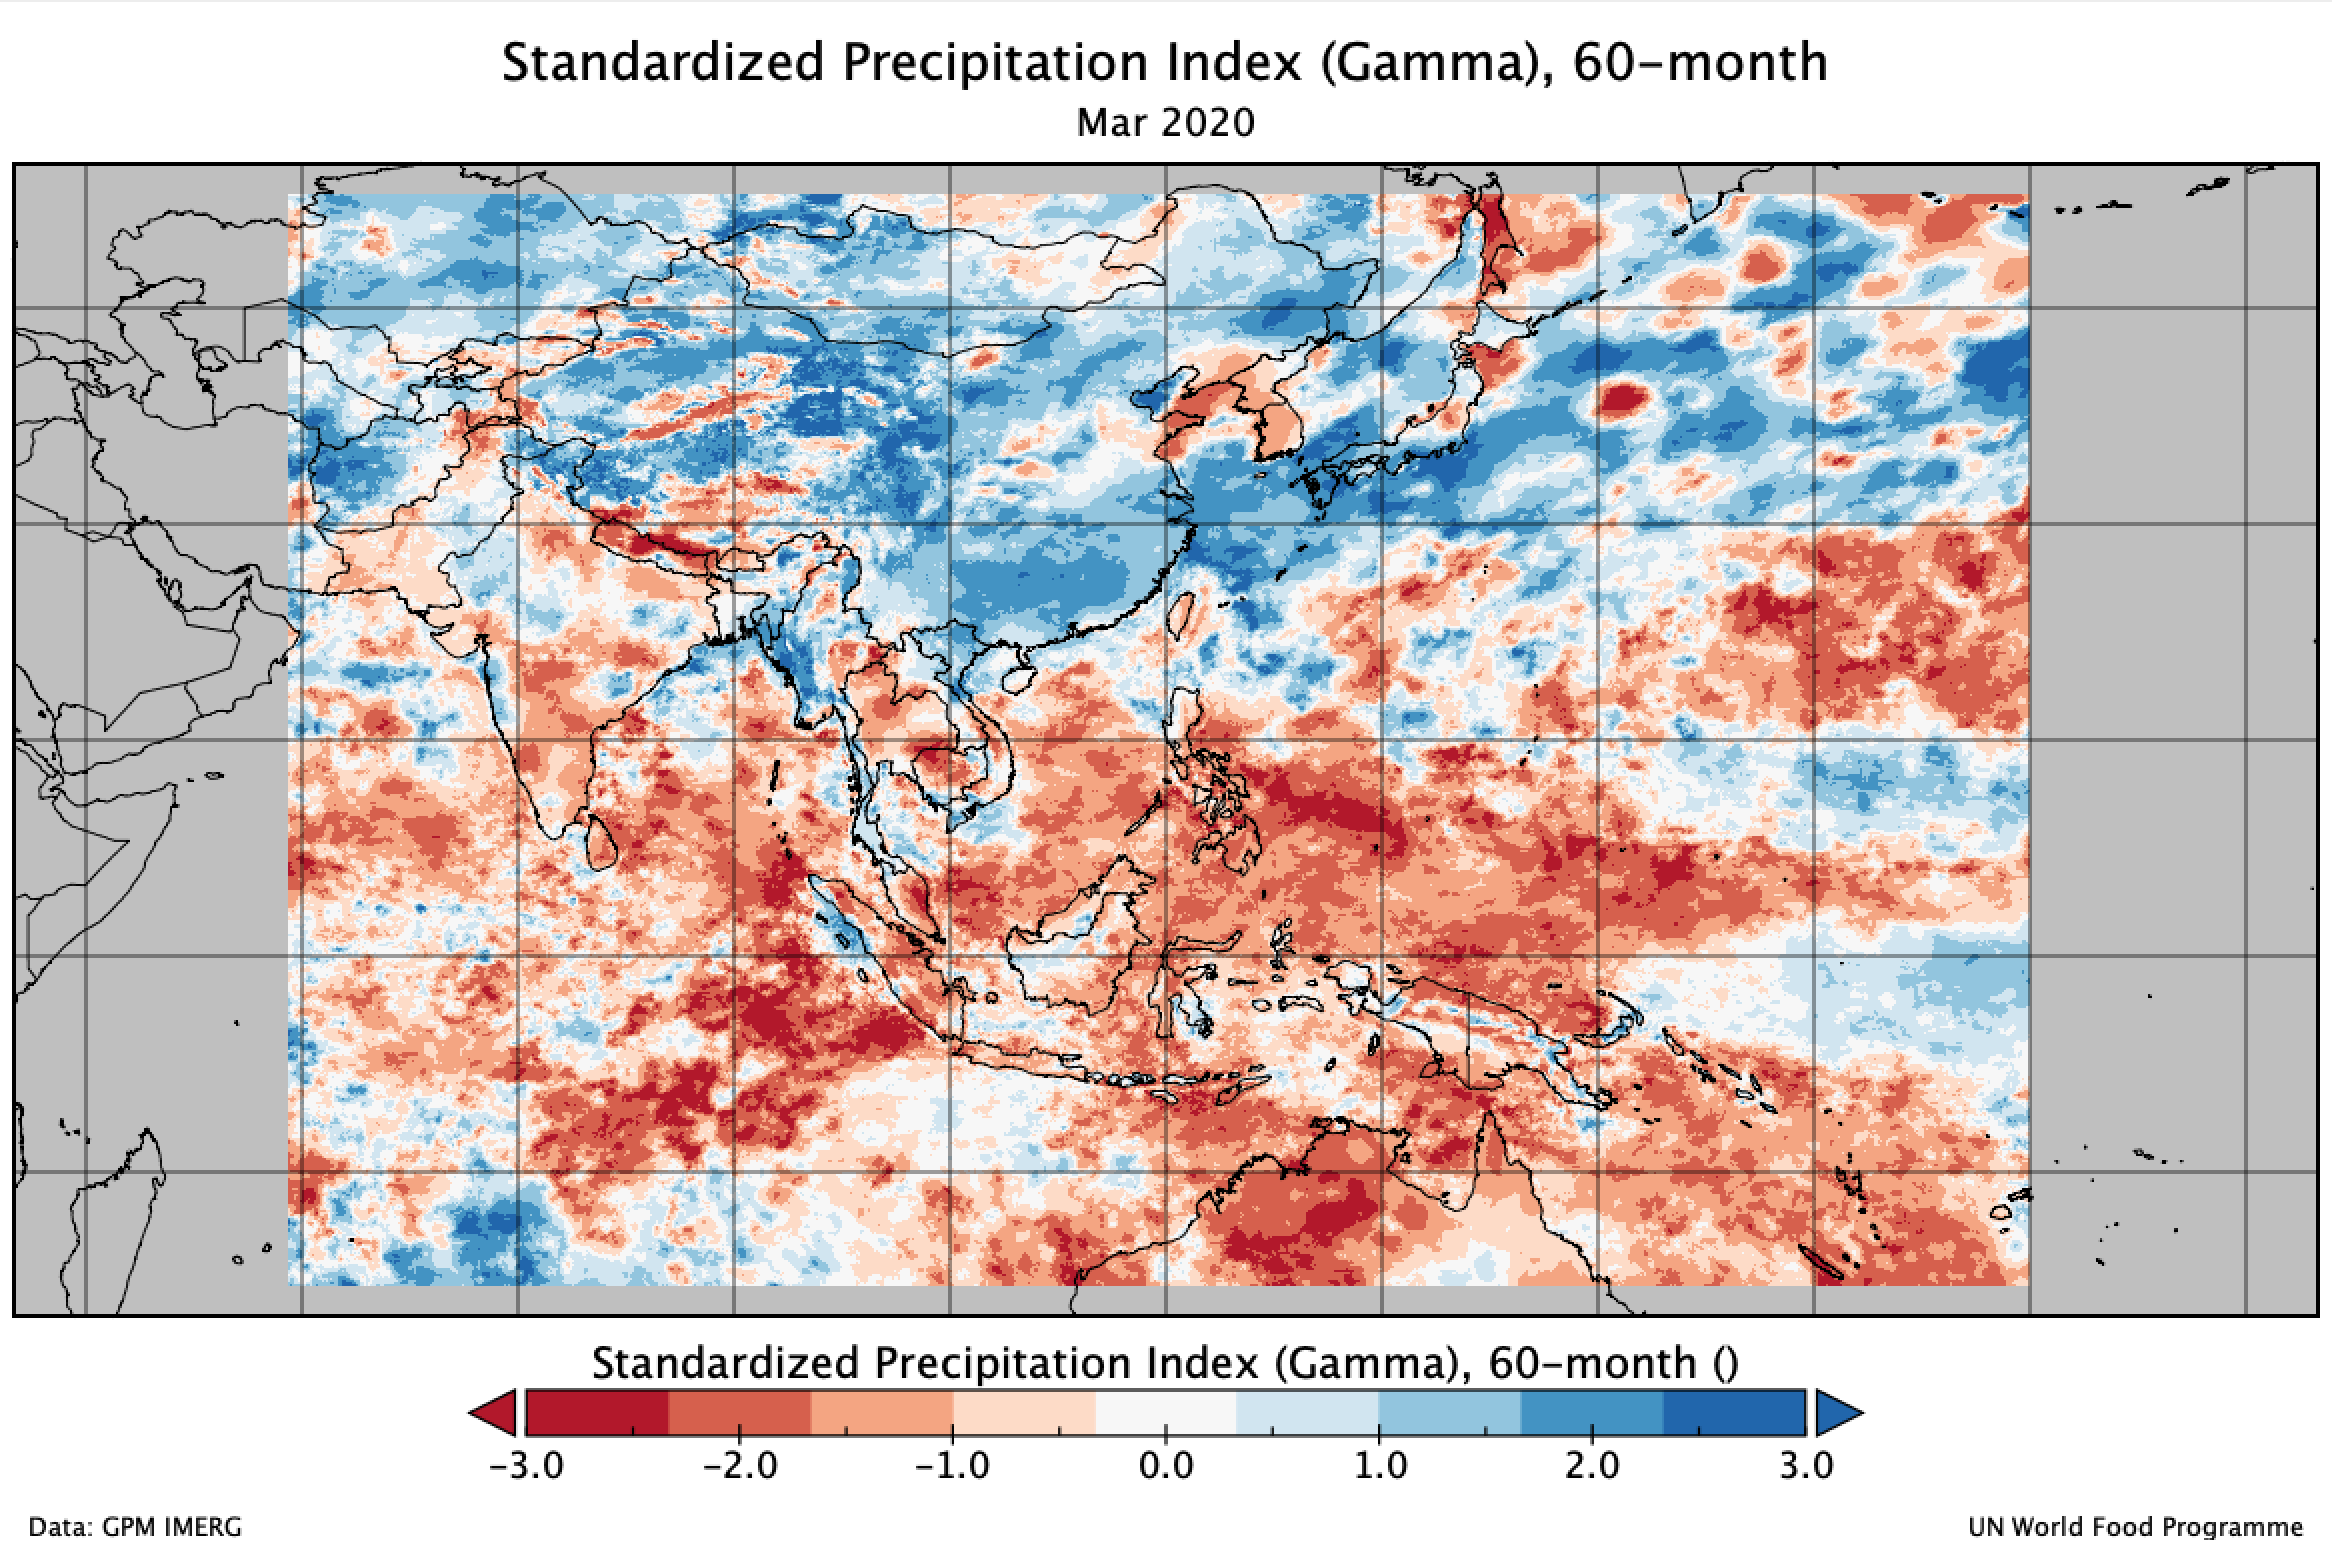
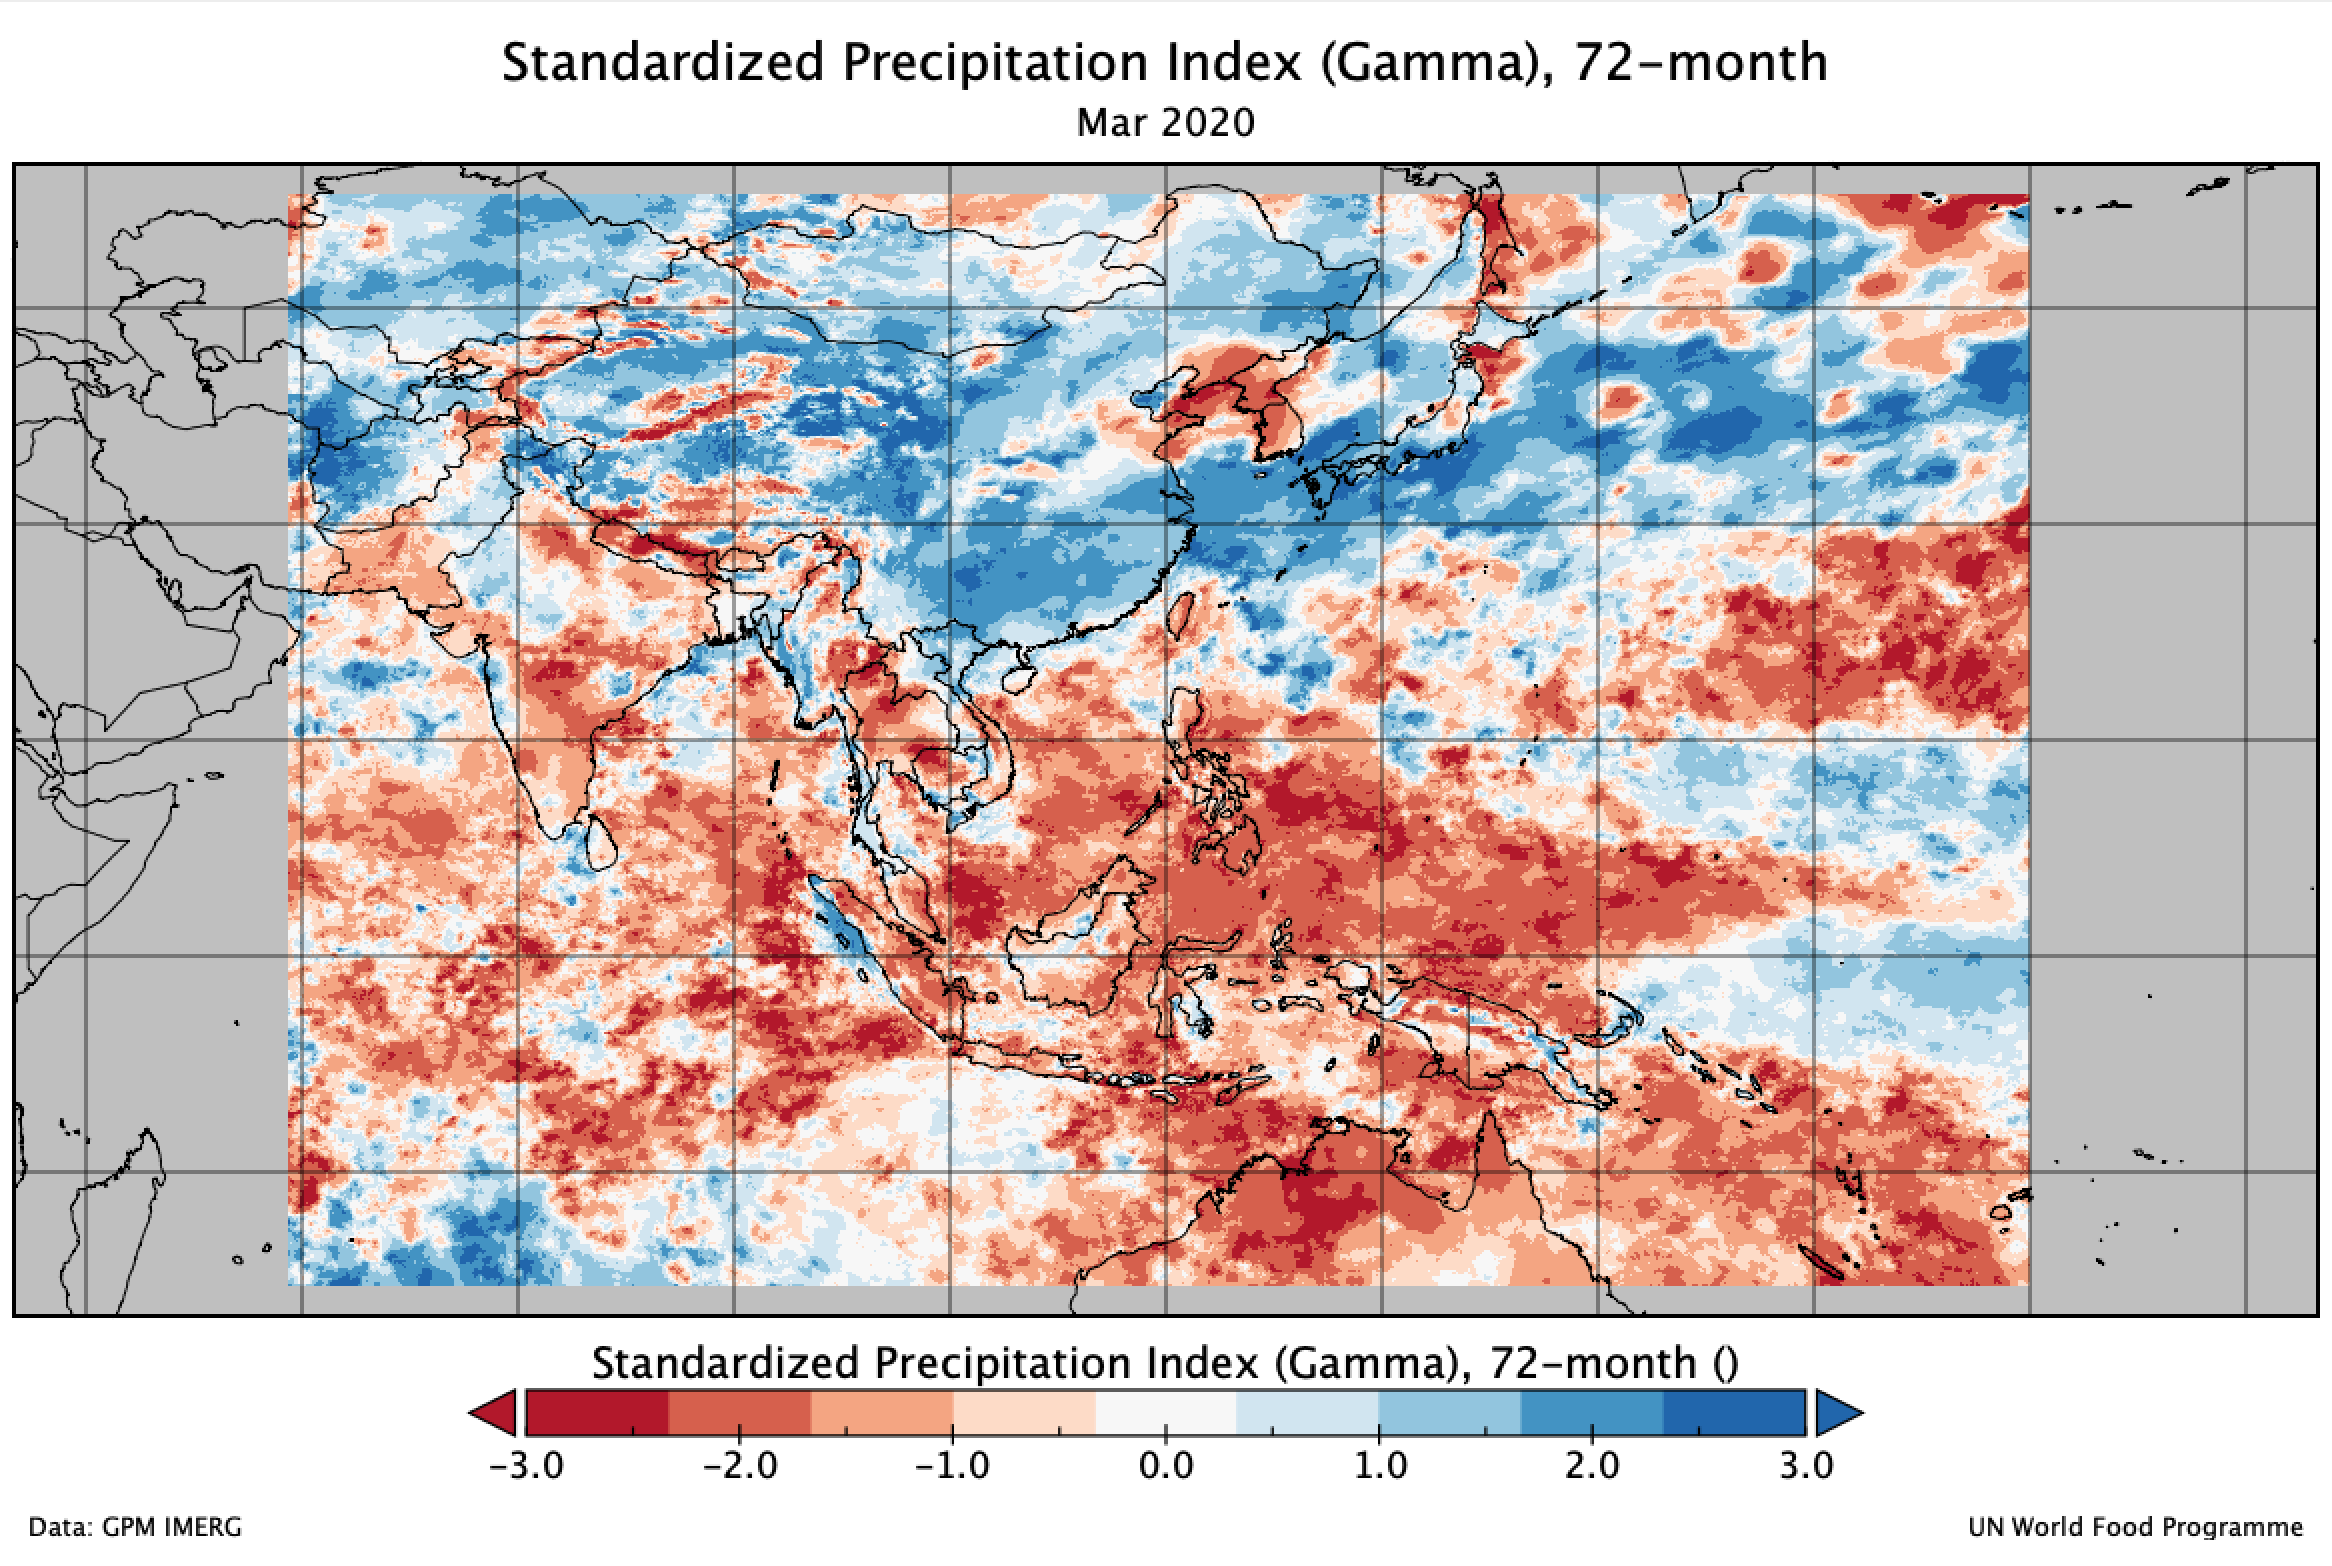
Below maps are example product for SPI 1 to 72-month, you can find more information about SPI and the application through below notebook.