How’s 2021 rainfall in Indonesia?
I frequently used the Global Precipitation Measurement (GPM) - next-generation of the Tropical Rainfall Measuring Mission (TRMM - https://pmm.nasa.gov/TRMM) - data to support my working activities. Among many GPM products, the Integrated Multi-satellitE Retrievals for GPM (IMERG) is most interesting to the users since it delivers the ‘best’ precipitation estimates by combining data obtained from all available microwave and infrared (IR) platforms of the GPM satellite constellation.
IMERG is adjusted to GPCP monthly climatology zonally to achieve a bias profile that is considered reasonable. Multiple runs for different user requirements for latency and accuracy
- “Early” – 4 hour (example application: flash flooding)
- “Late” – 14 hour (crop forecasting)
- “Final” – 3 months (research)
At 21:43 WIB local time (UTC+7) - 1 Jan 2022, the last daily data for Late run IMERG in 2021 are available for download. It doesn’t take long, all the daily data for 2021 is already on my Mac mini and ready for further analysis.
So, this is what I got! Oh this post also as a warming-up to start first day of work in 2022 tomorrow! 😆
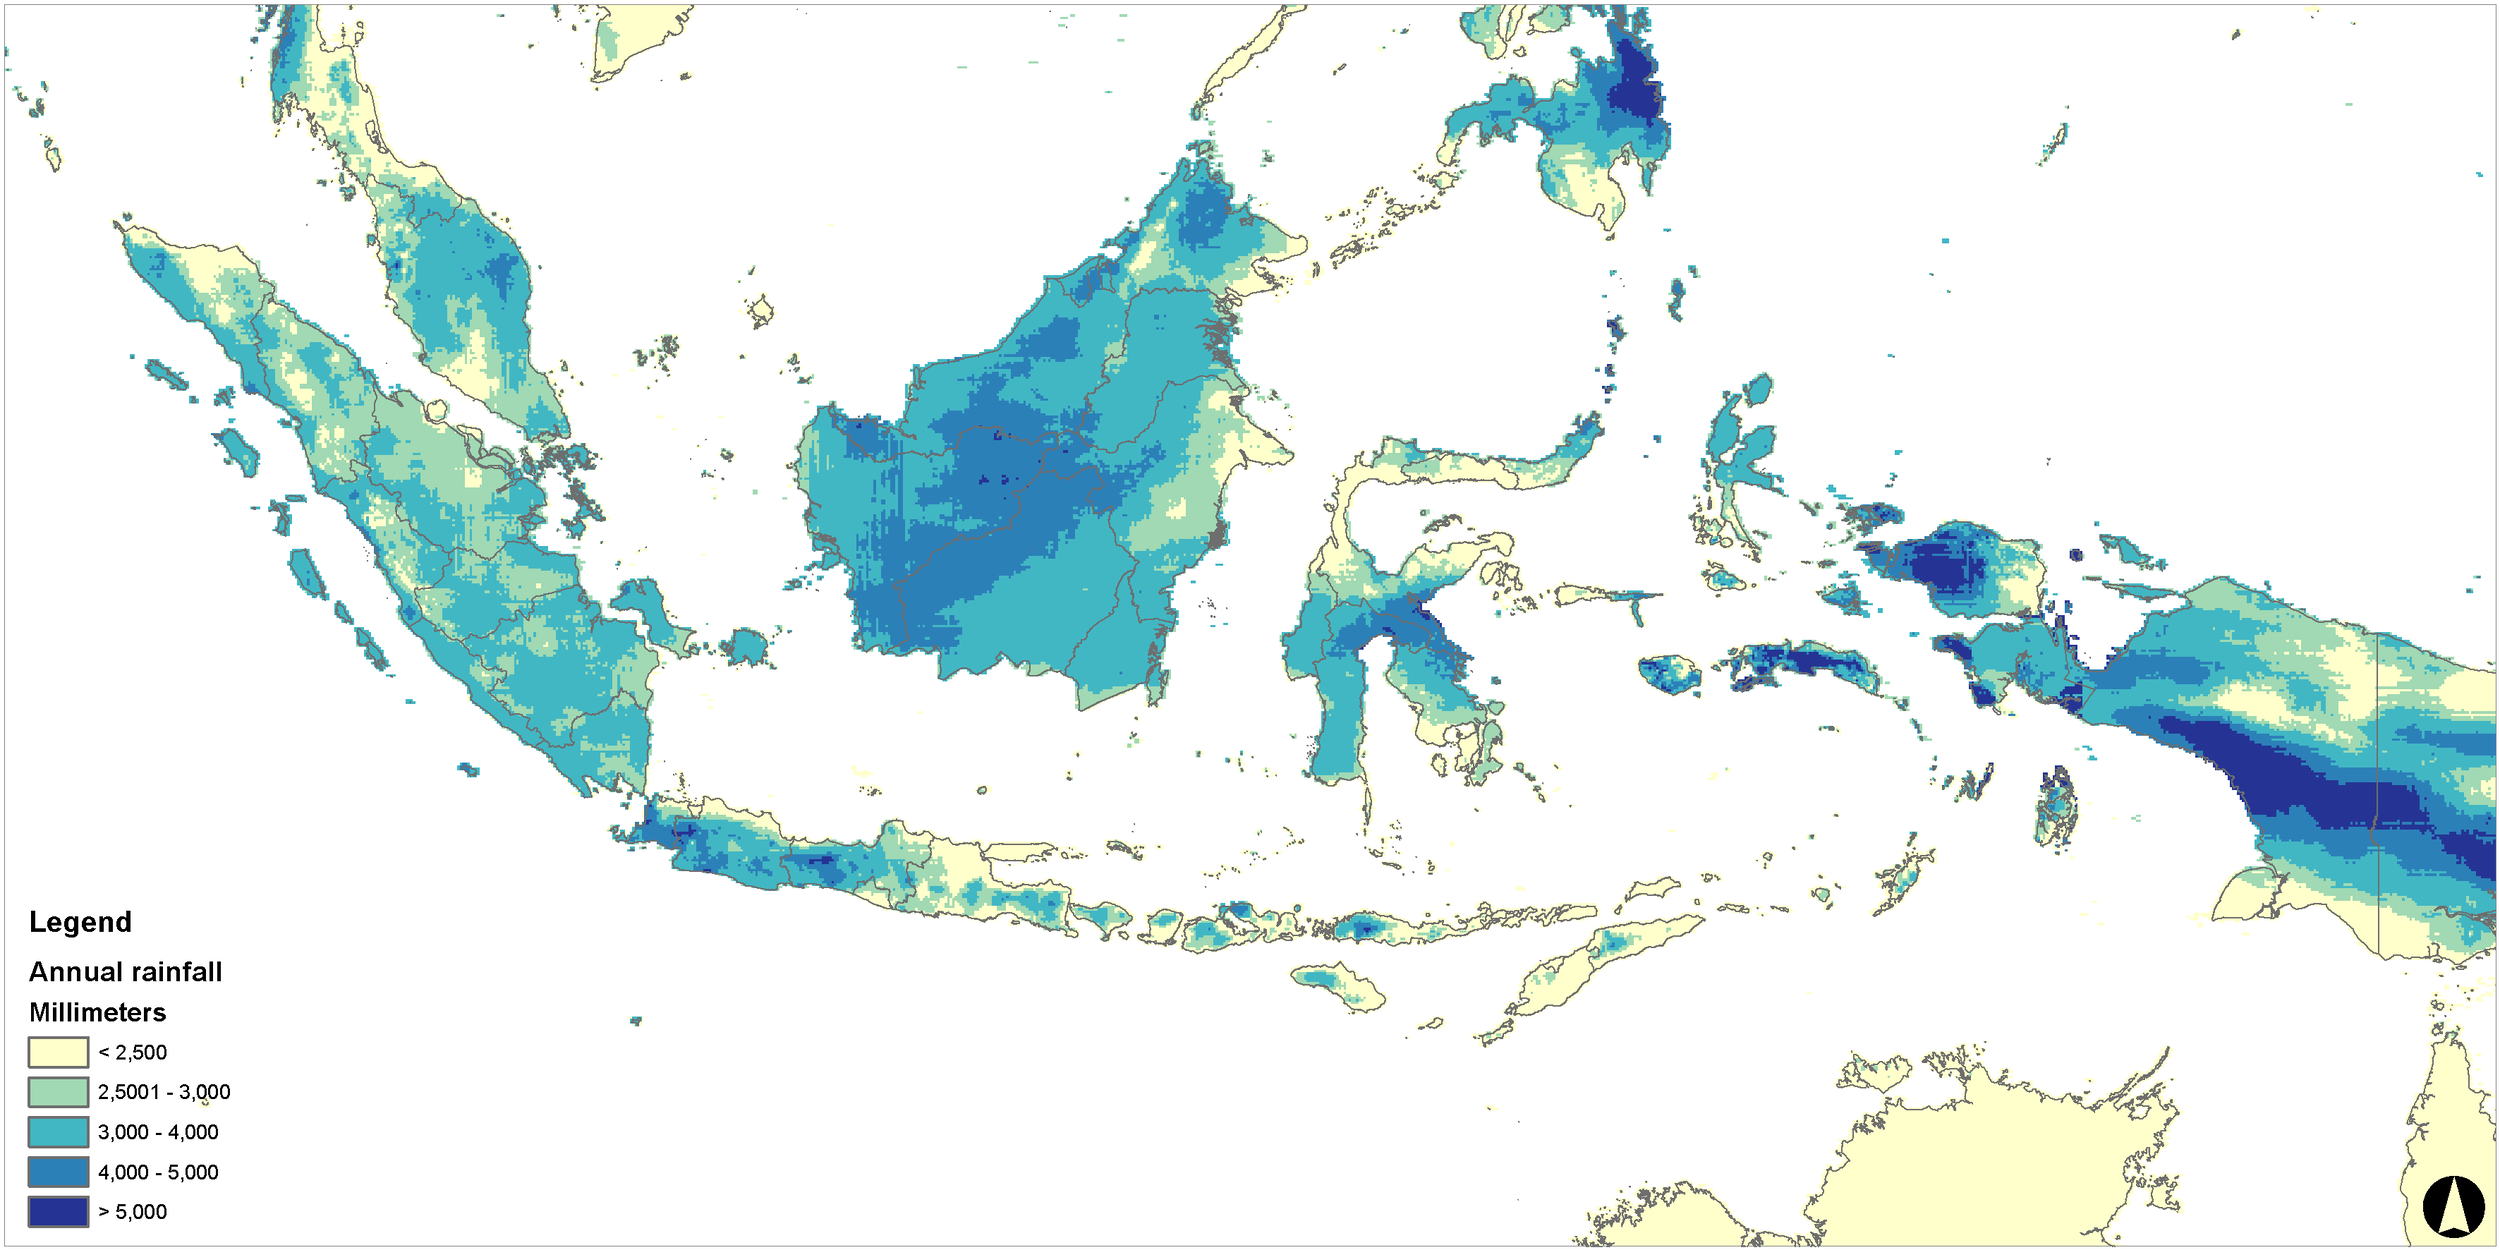
Annual rainfall
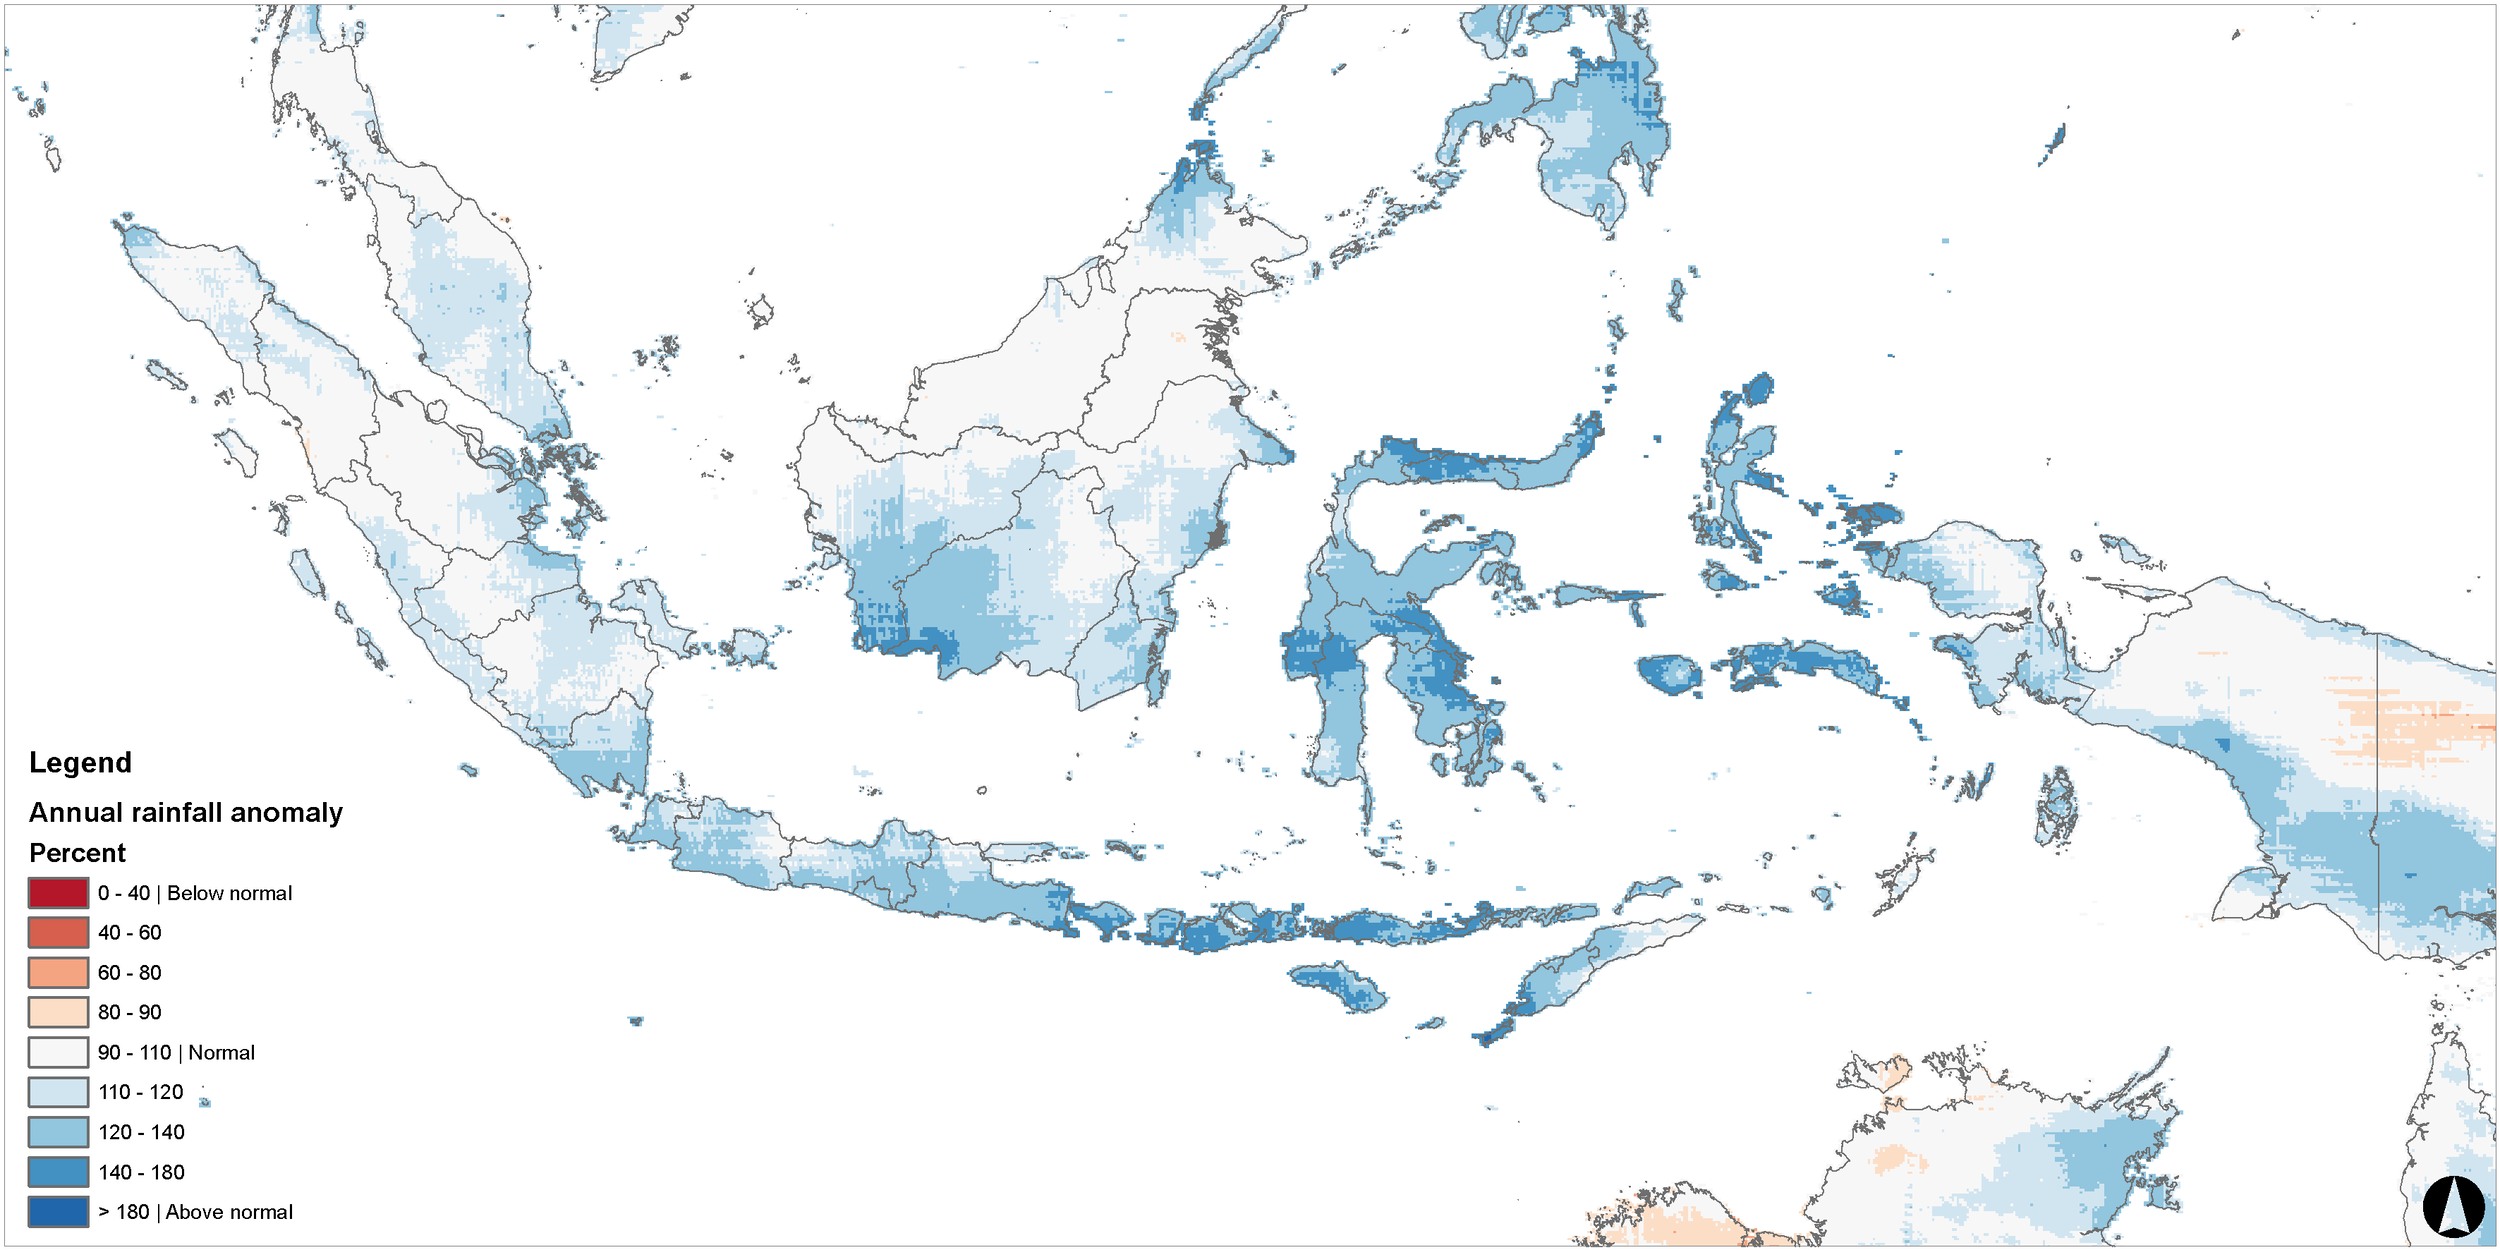
The annual rainfall total for most areas in Indonesia ranging from normal to wet condition during 2021. Most areas of Bali, Nusa Tenggara, Sulawesi and Maluku experience 120-180% above normal precipitation. Wetness occurred specifically during the period of May - Dec. Above maps using CHIRPS which has 40-years climatology data.
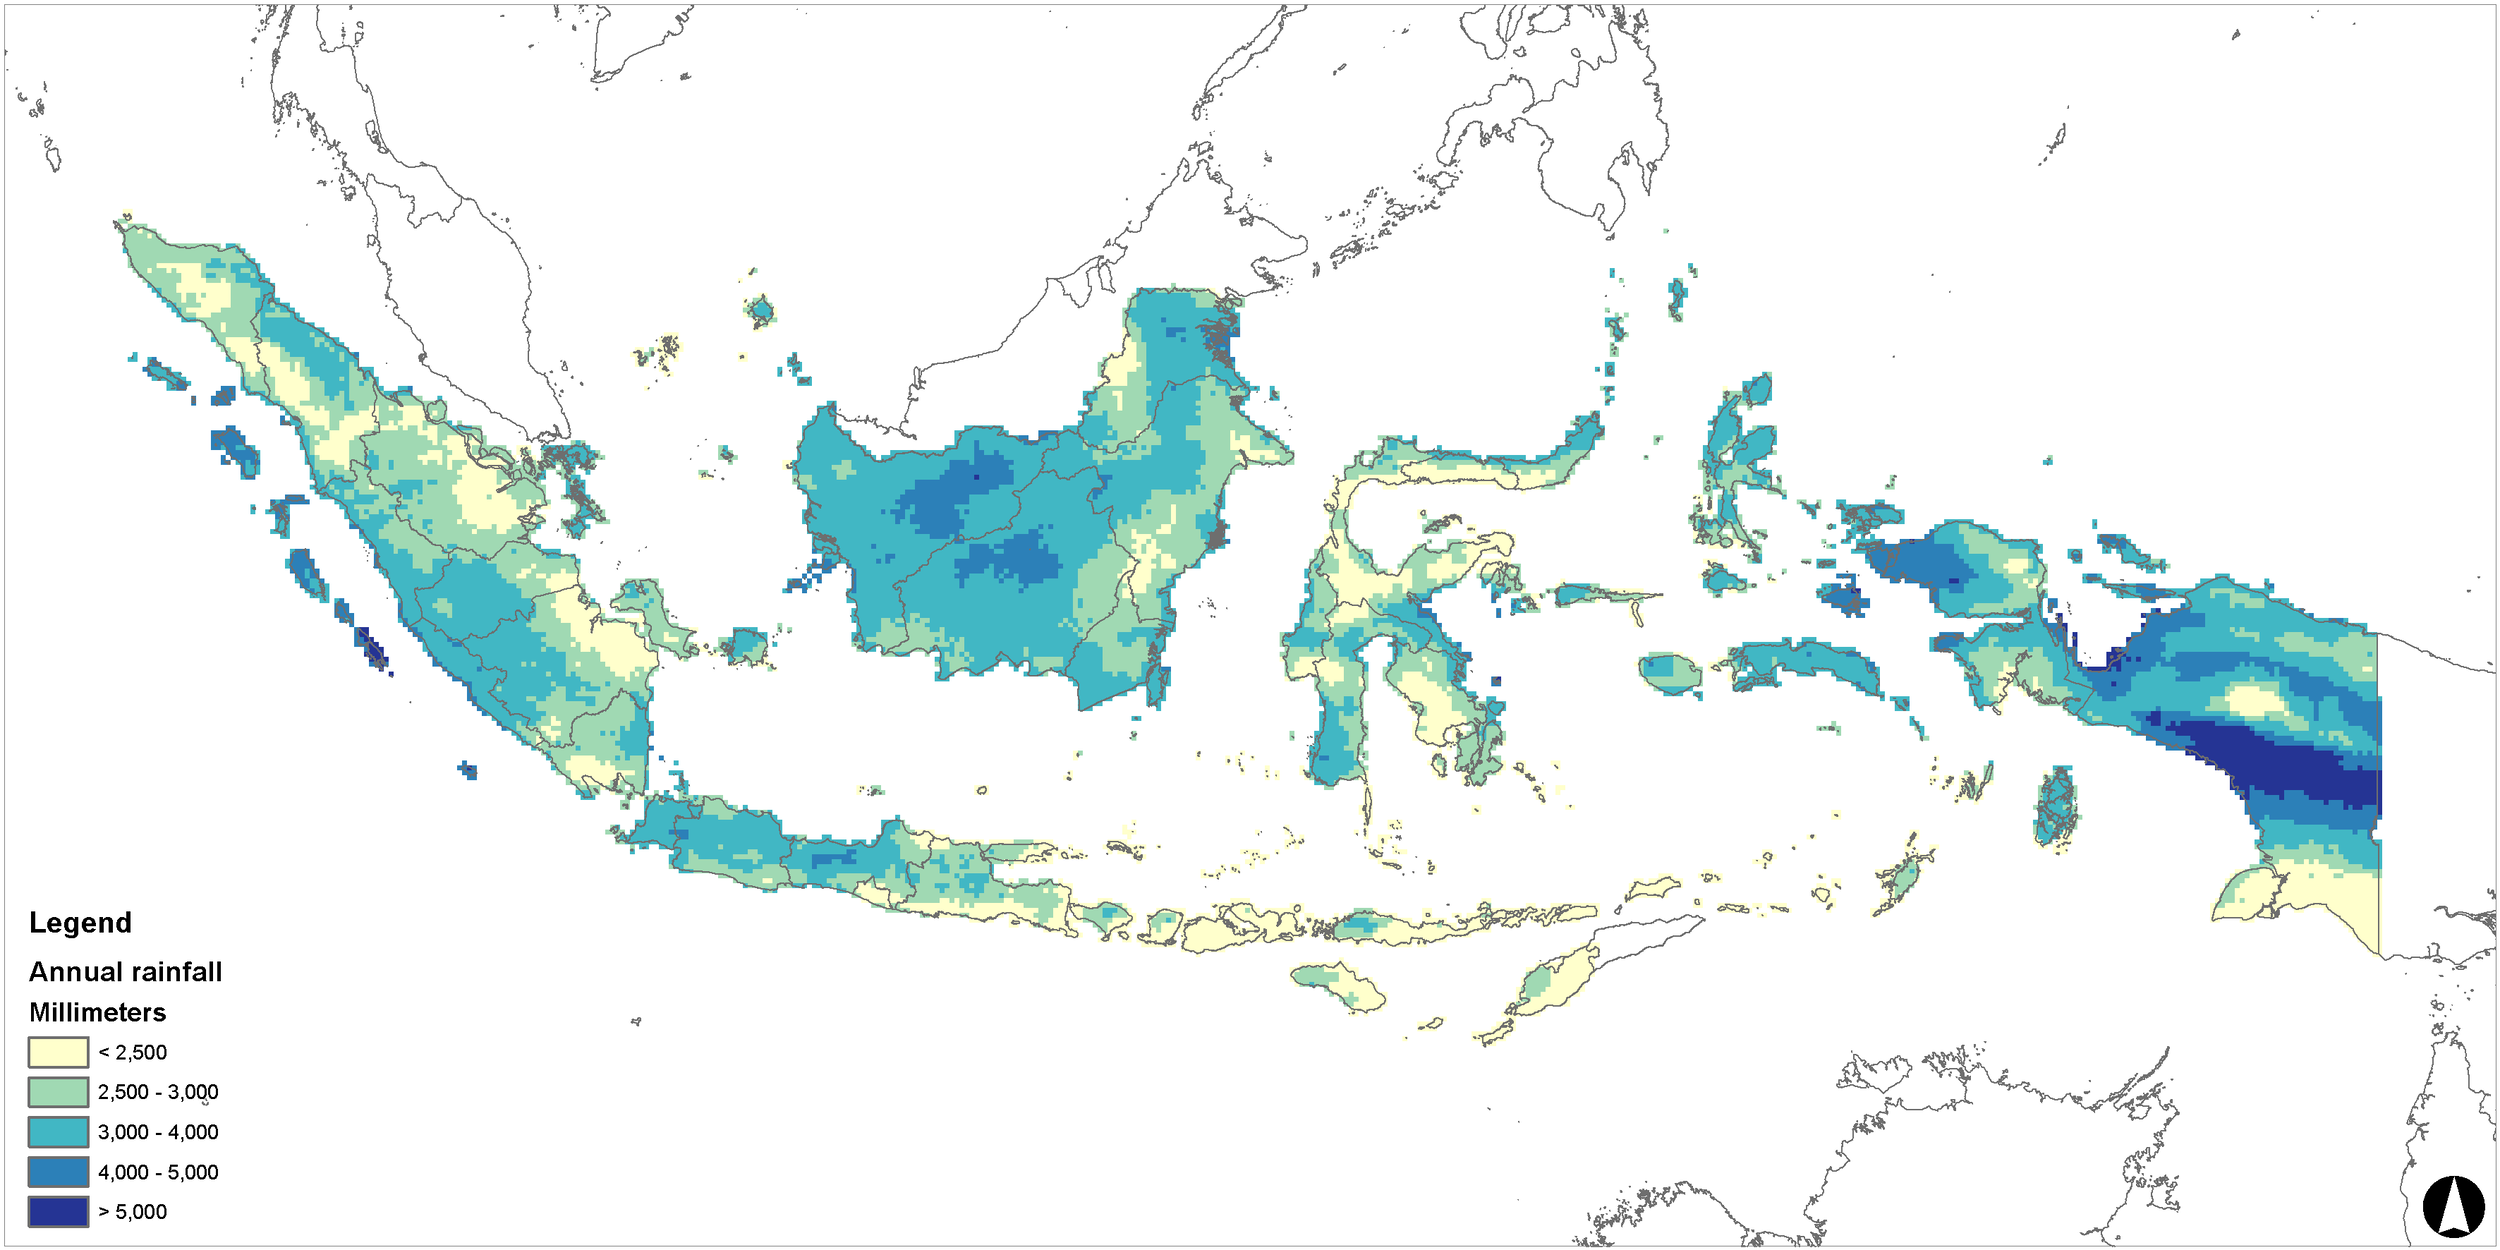
Above map is annual rainfall in 2021 based on IMERG daily data.
Maximum daily rainfall
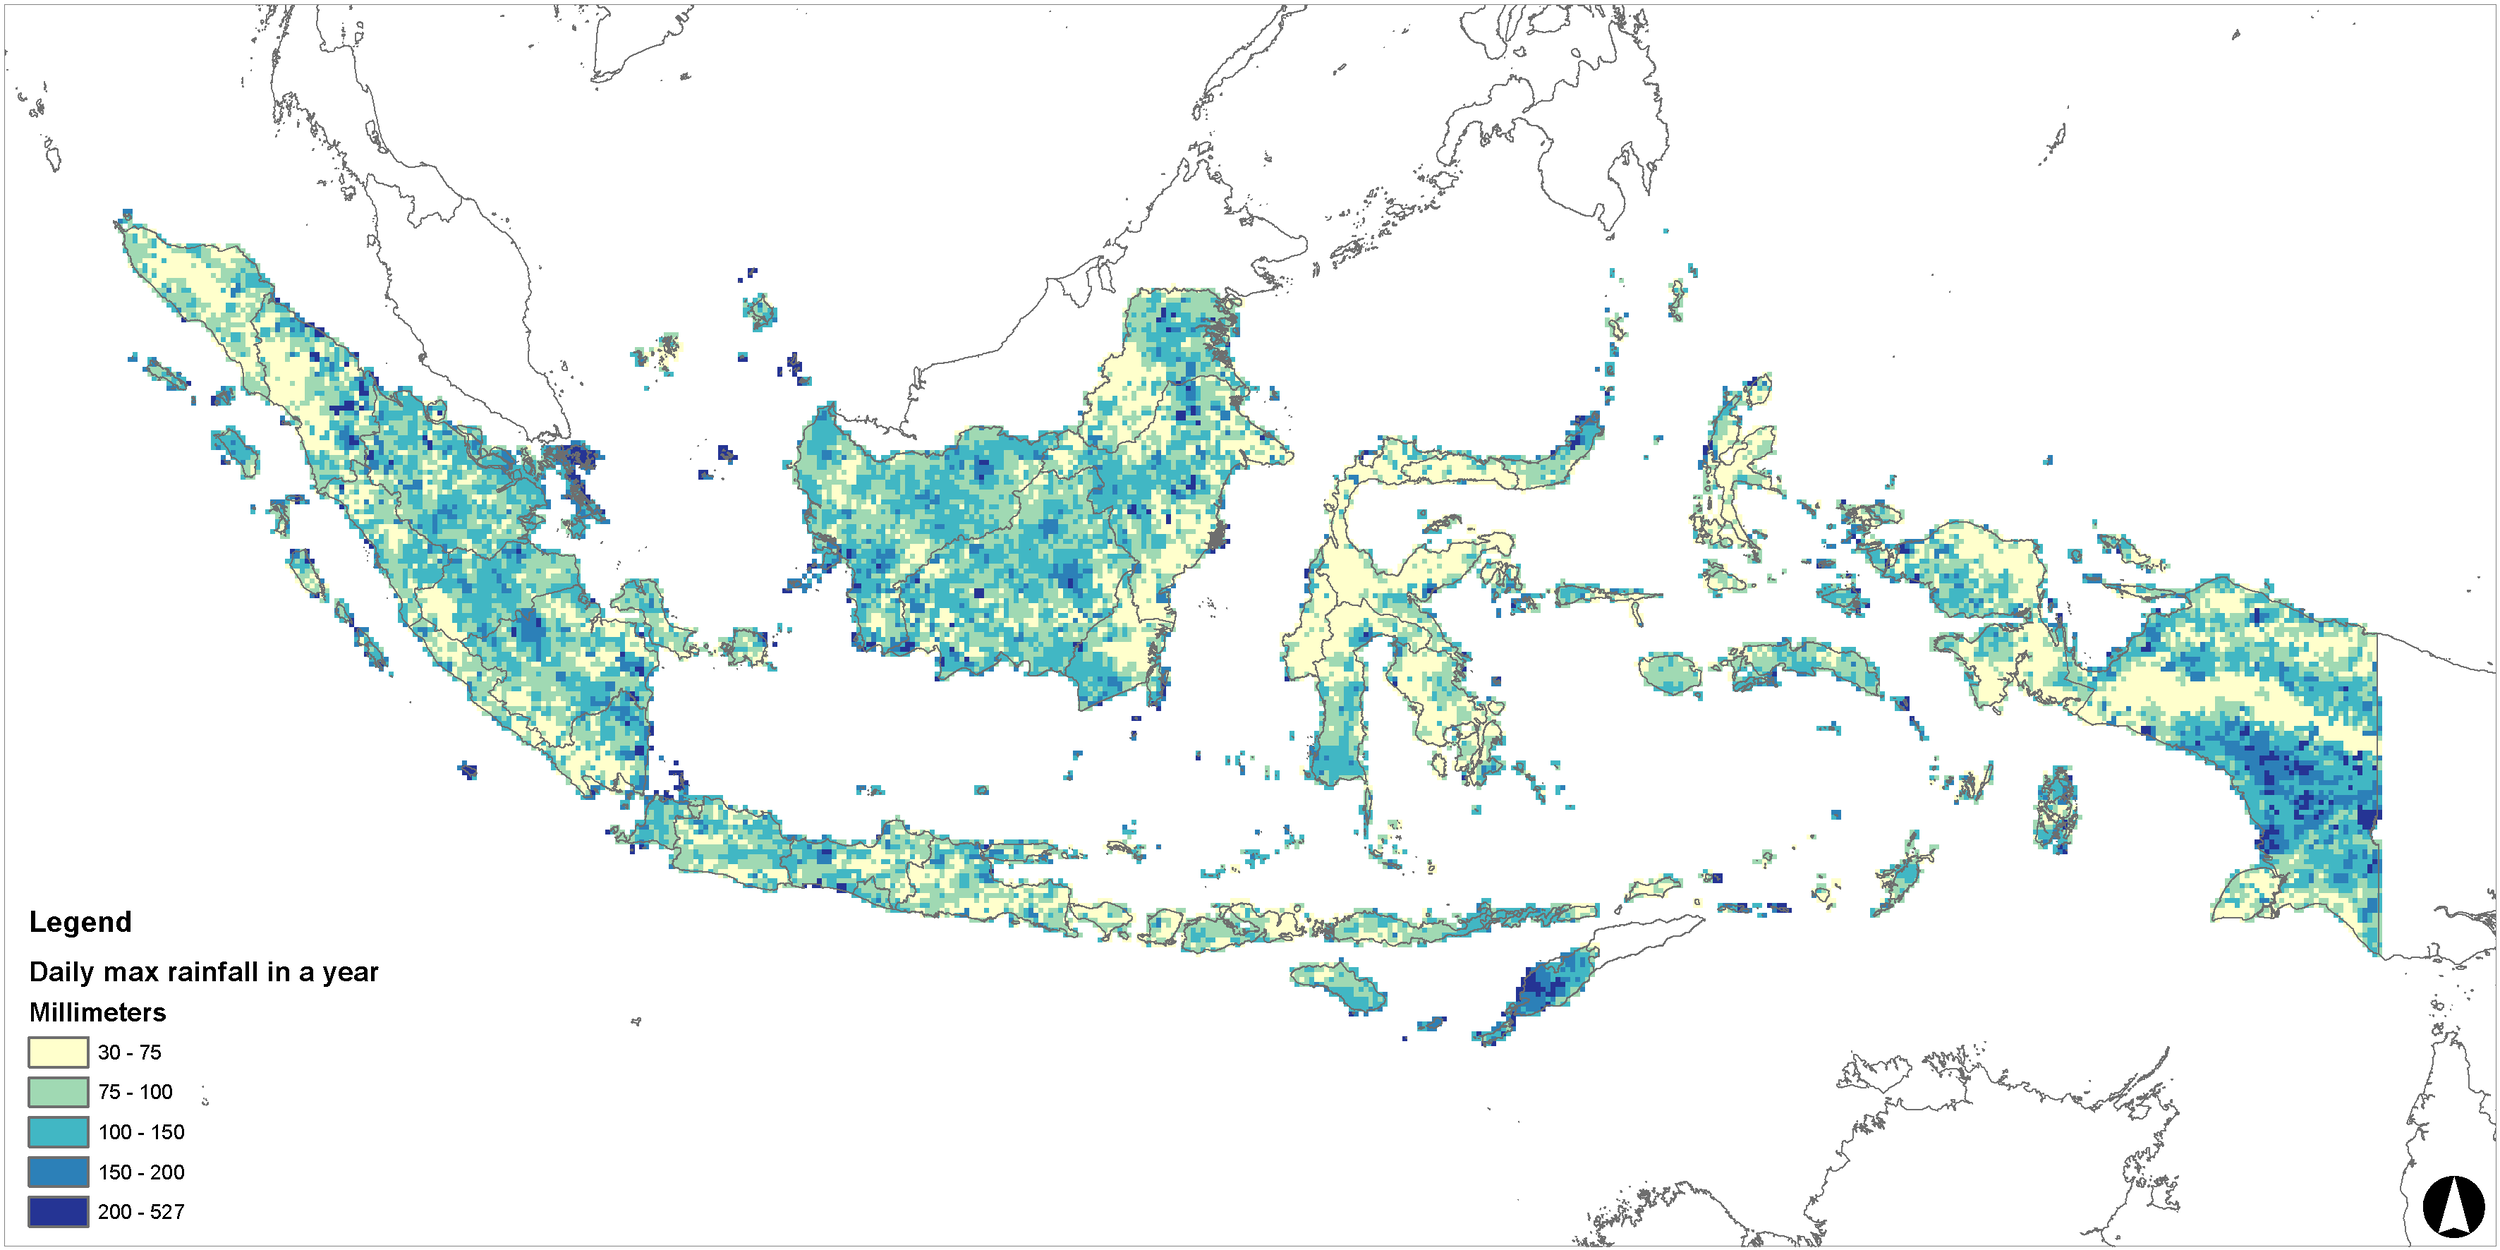
Maximum daily rainfall varies across Indonesia. Far east in Papua, Timor Island and few scattered areas in Kalimantan, North Sulawesi maximum daily rainfall reaches >200 mm. In the remaining areas of Indonesia, maximum daily rainfall ranging between 30 - 150 mm.
The biggest rainfall in in a day in 2021 in Indonesia occurred in Pulau Seraja - Kabupaten Natuna, Kepulauan Riau. Some of 527.85 mm of rain fell over 24 hours, on 2 September 2021 UTC+0 (from 2 September 2021, 7am to 3 September 2021, 6am.
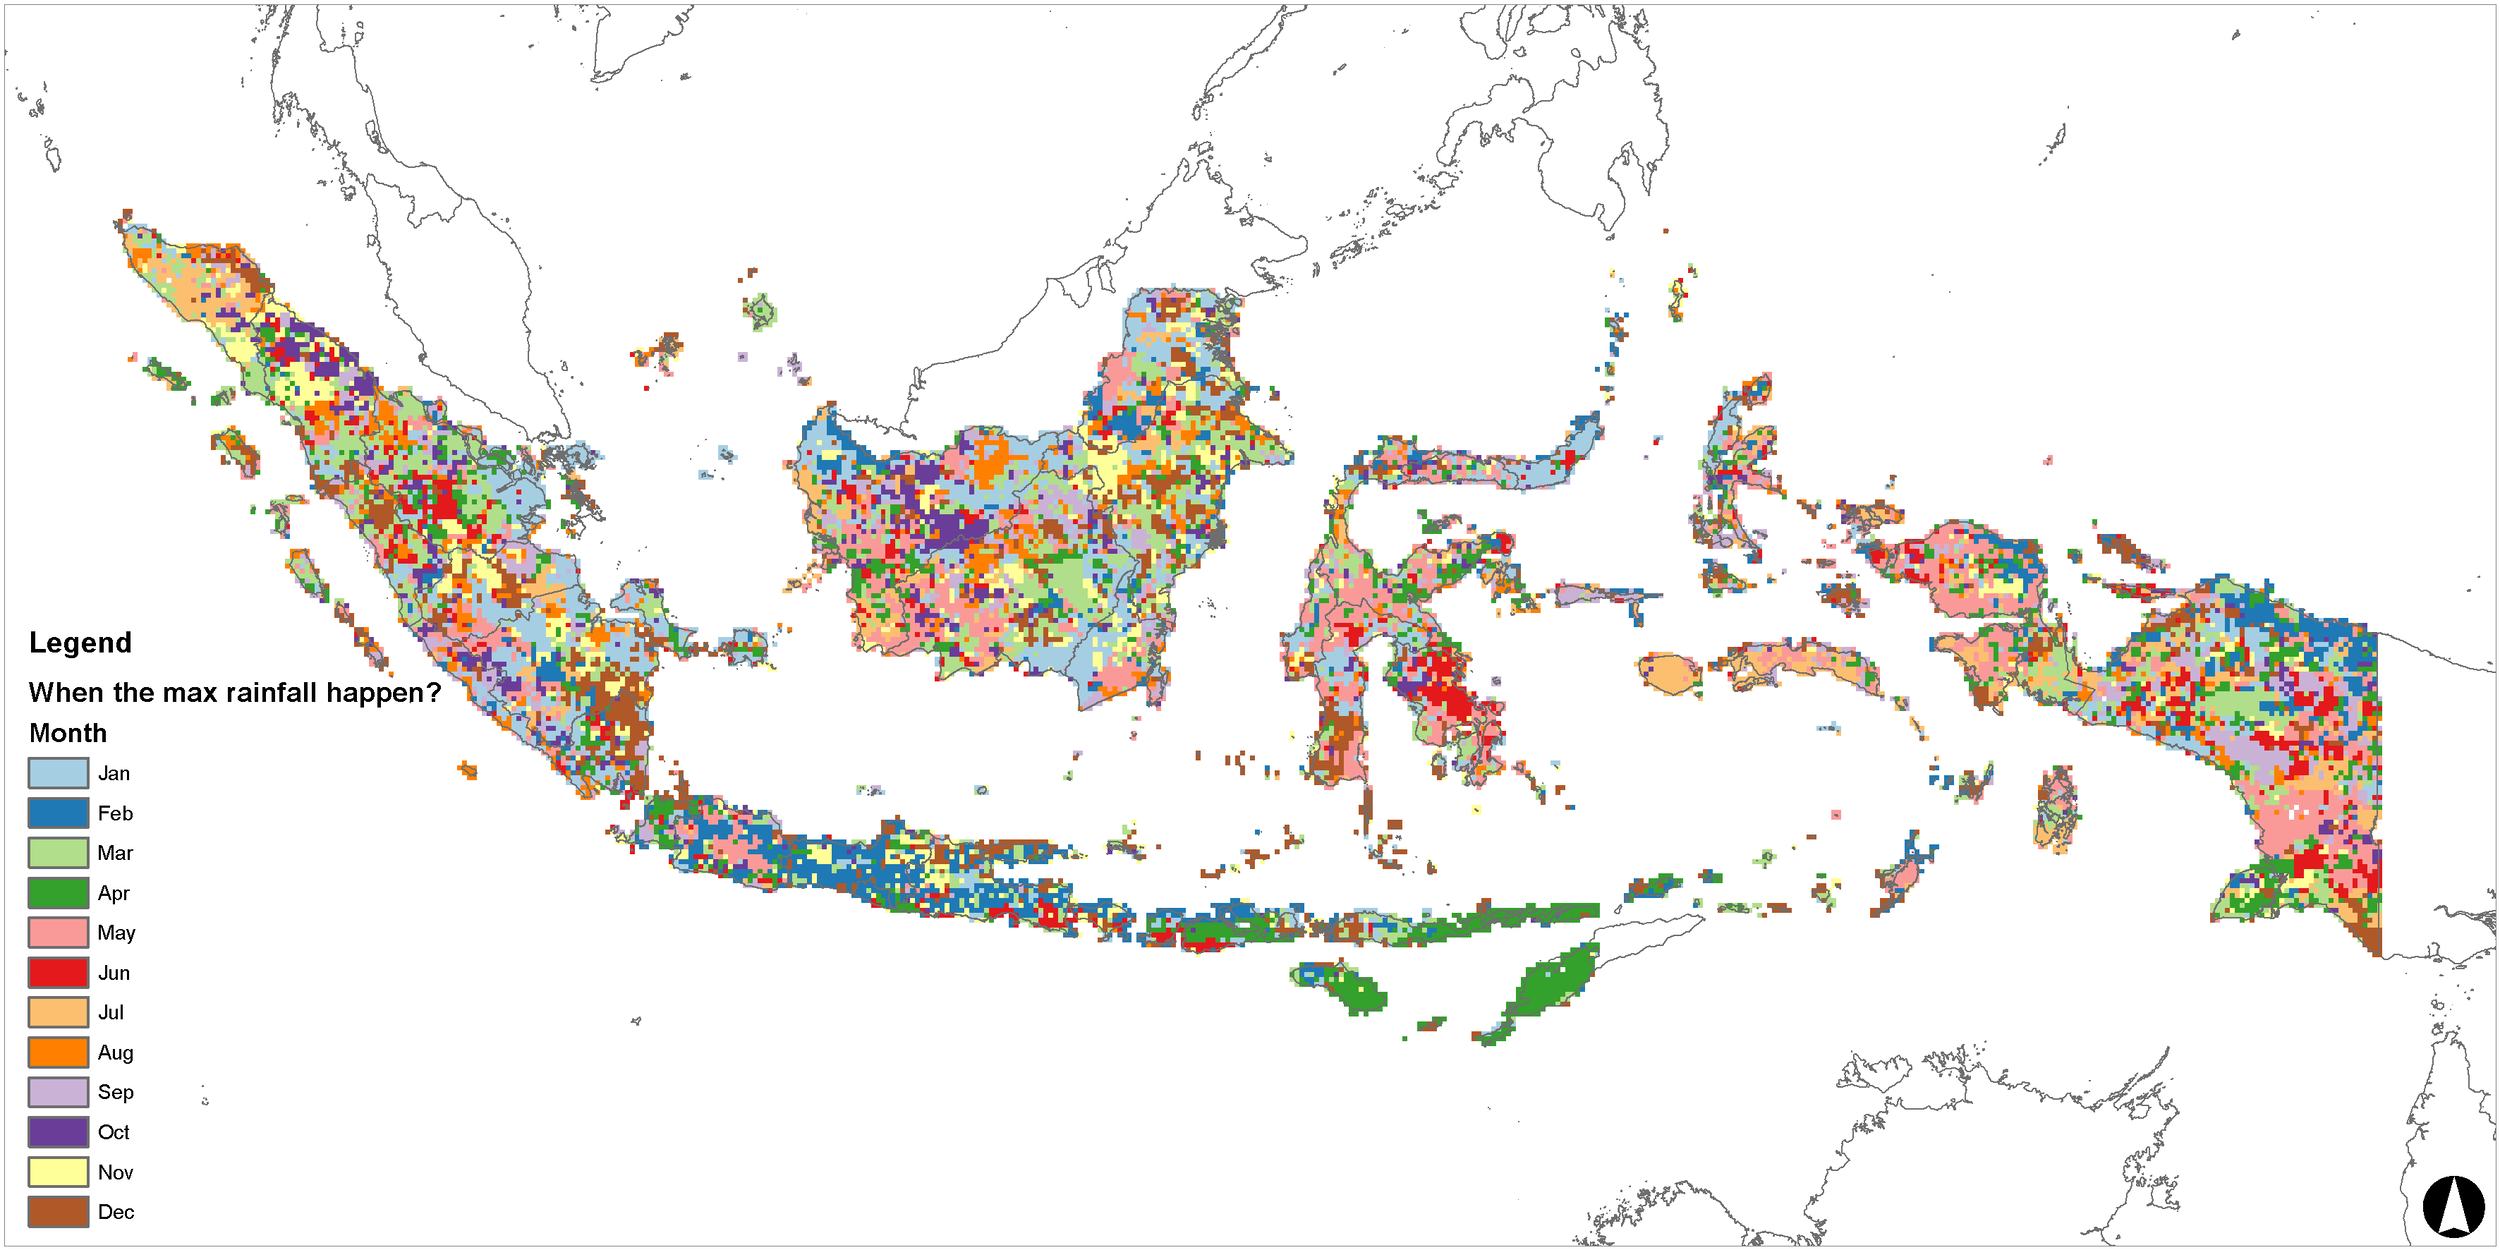
There is a significant variation in the occurrence of maximum daily rainfall. In large part of Java, the highest intensity rainfall occurred on February. West Java, coastal areas of South Sulawesi, and Kalimantan, cape areas of Central Sulawesi experienced maximum rainfall on May. While in Nusa Tenggara, maximum daily rainfall occurred in April.
Consecutive Dry Days
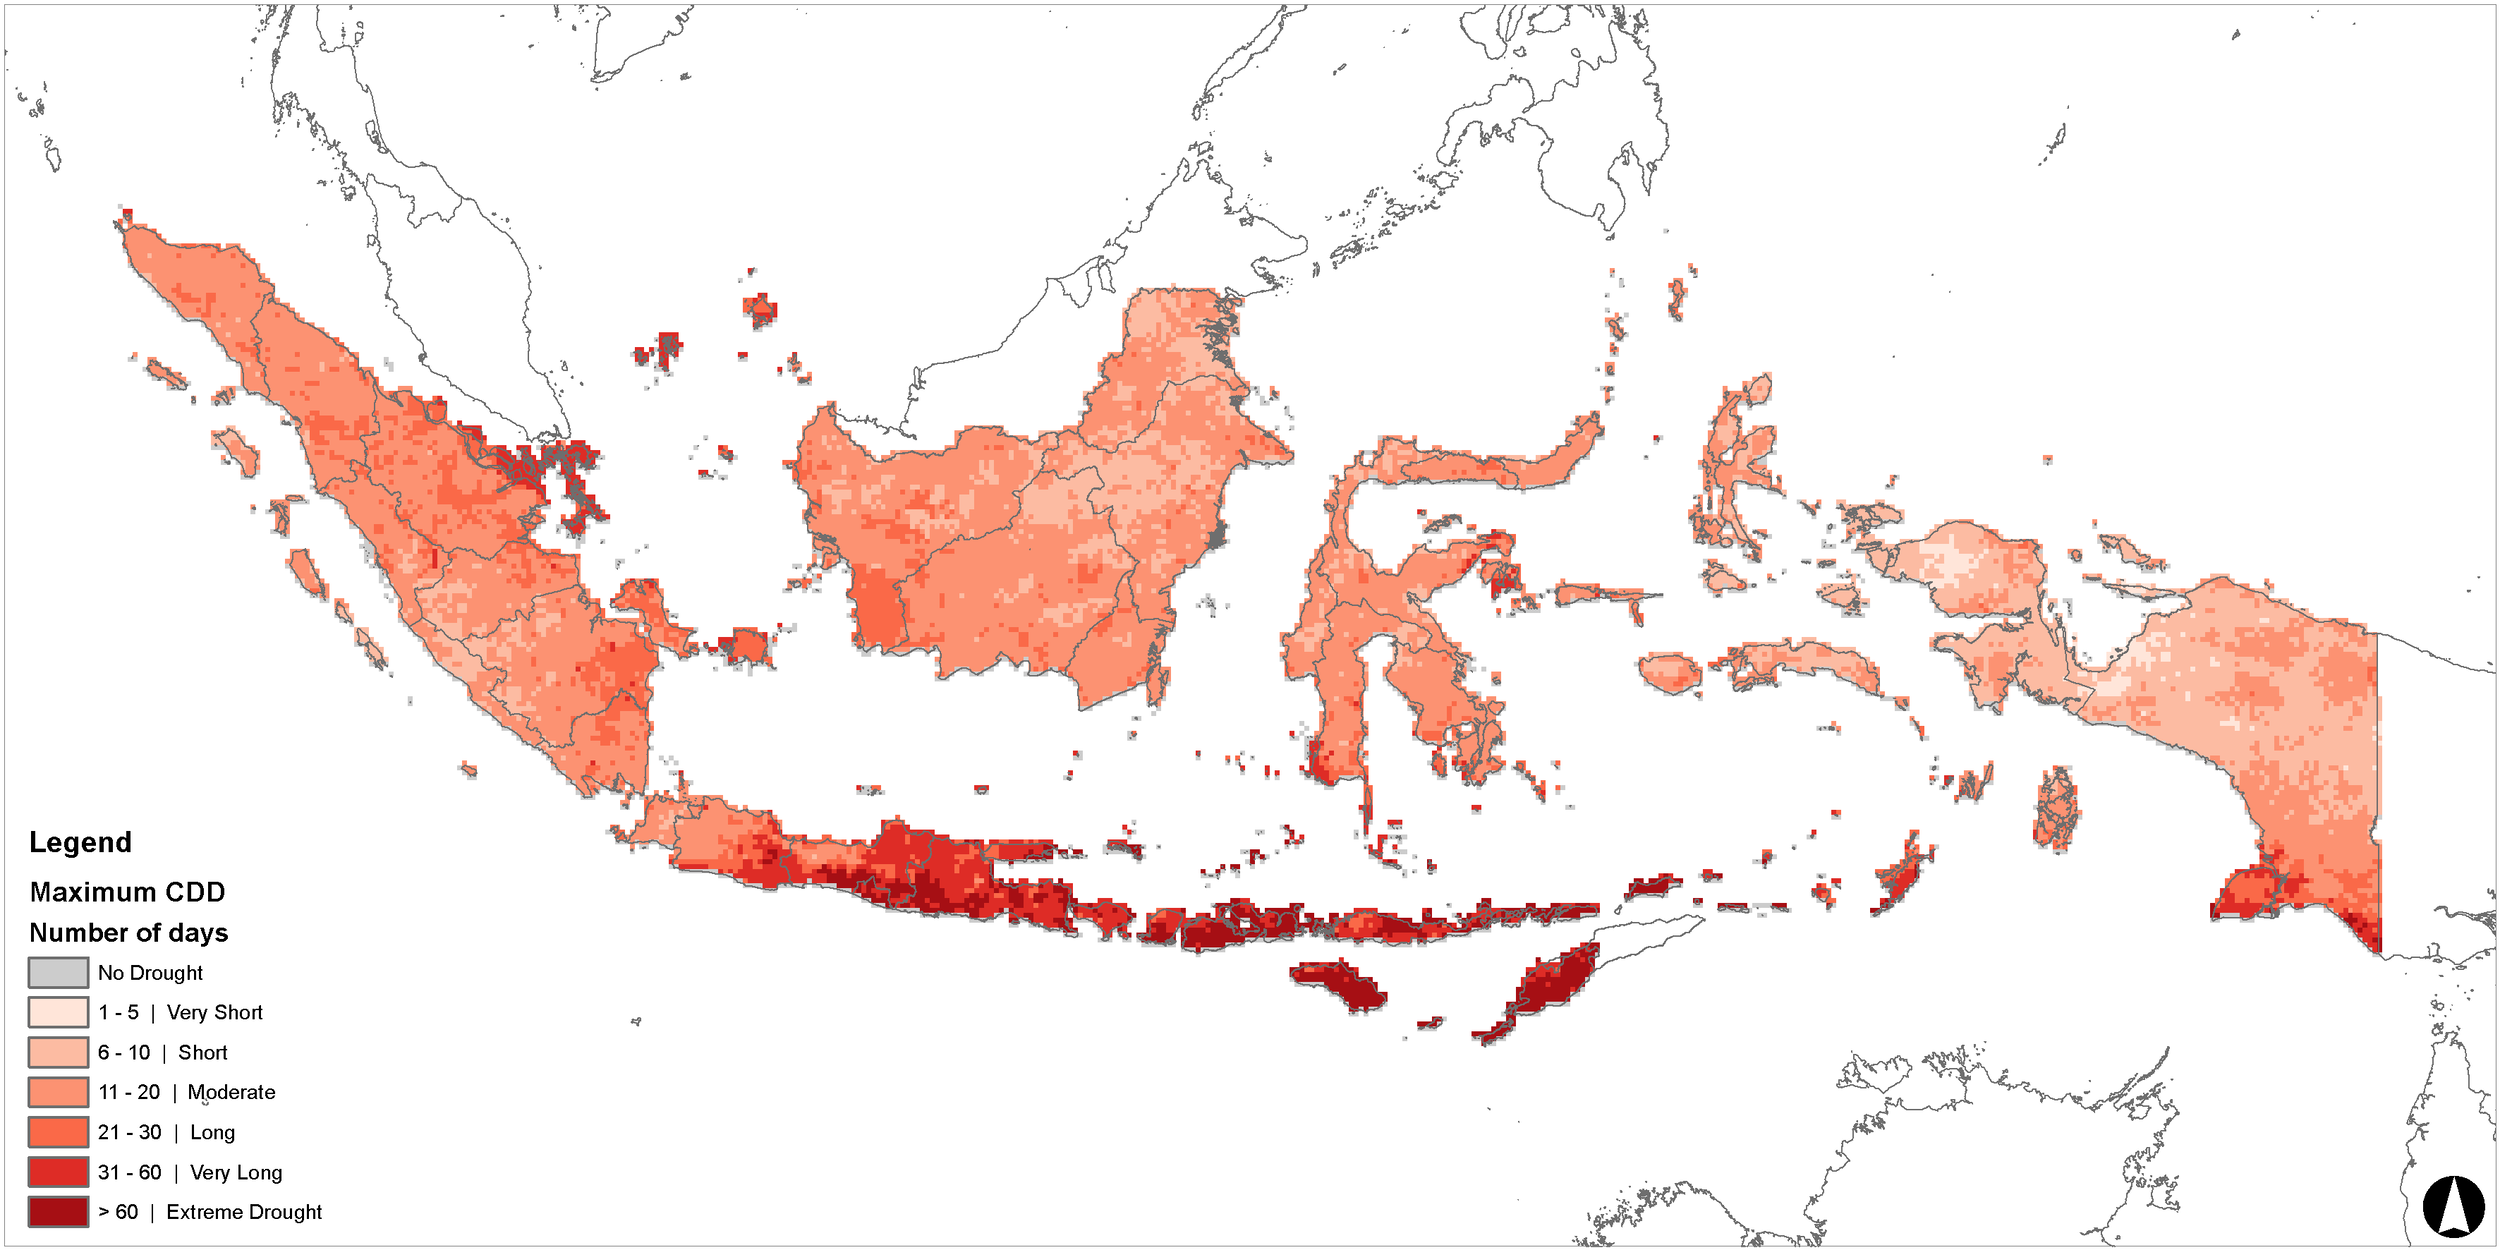
Eventhough 2021 is generally consider as La Nina years, and most of the areas experience high number of rainfall, prolonged dry spells (days without daily rainfall of 5 mm) were experienced in southern parts of the country. Extreme drought with more than 60 days without rainfall, specifically occurred in Southern area of Central and East Java, Yogyakarta, Bali and Nusa Tenggara. Data of the rainfall were recorded per pixel.
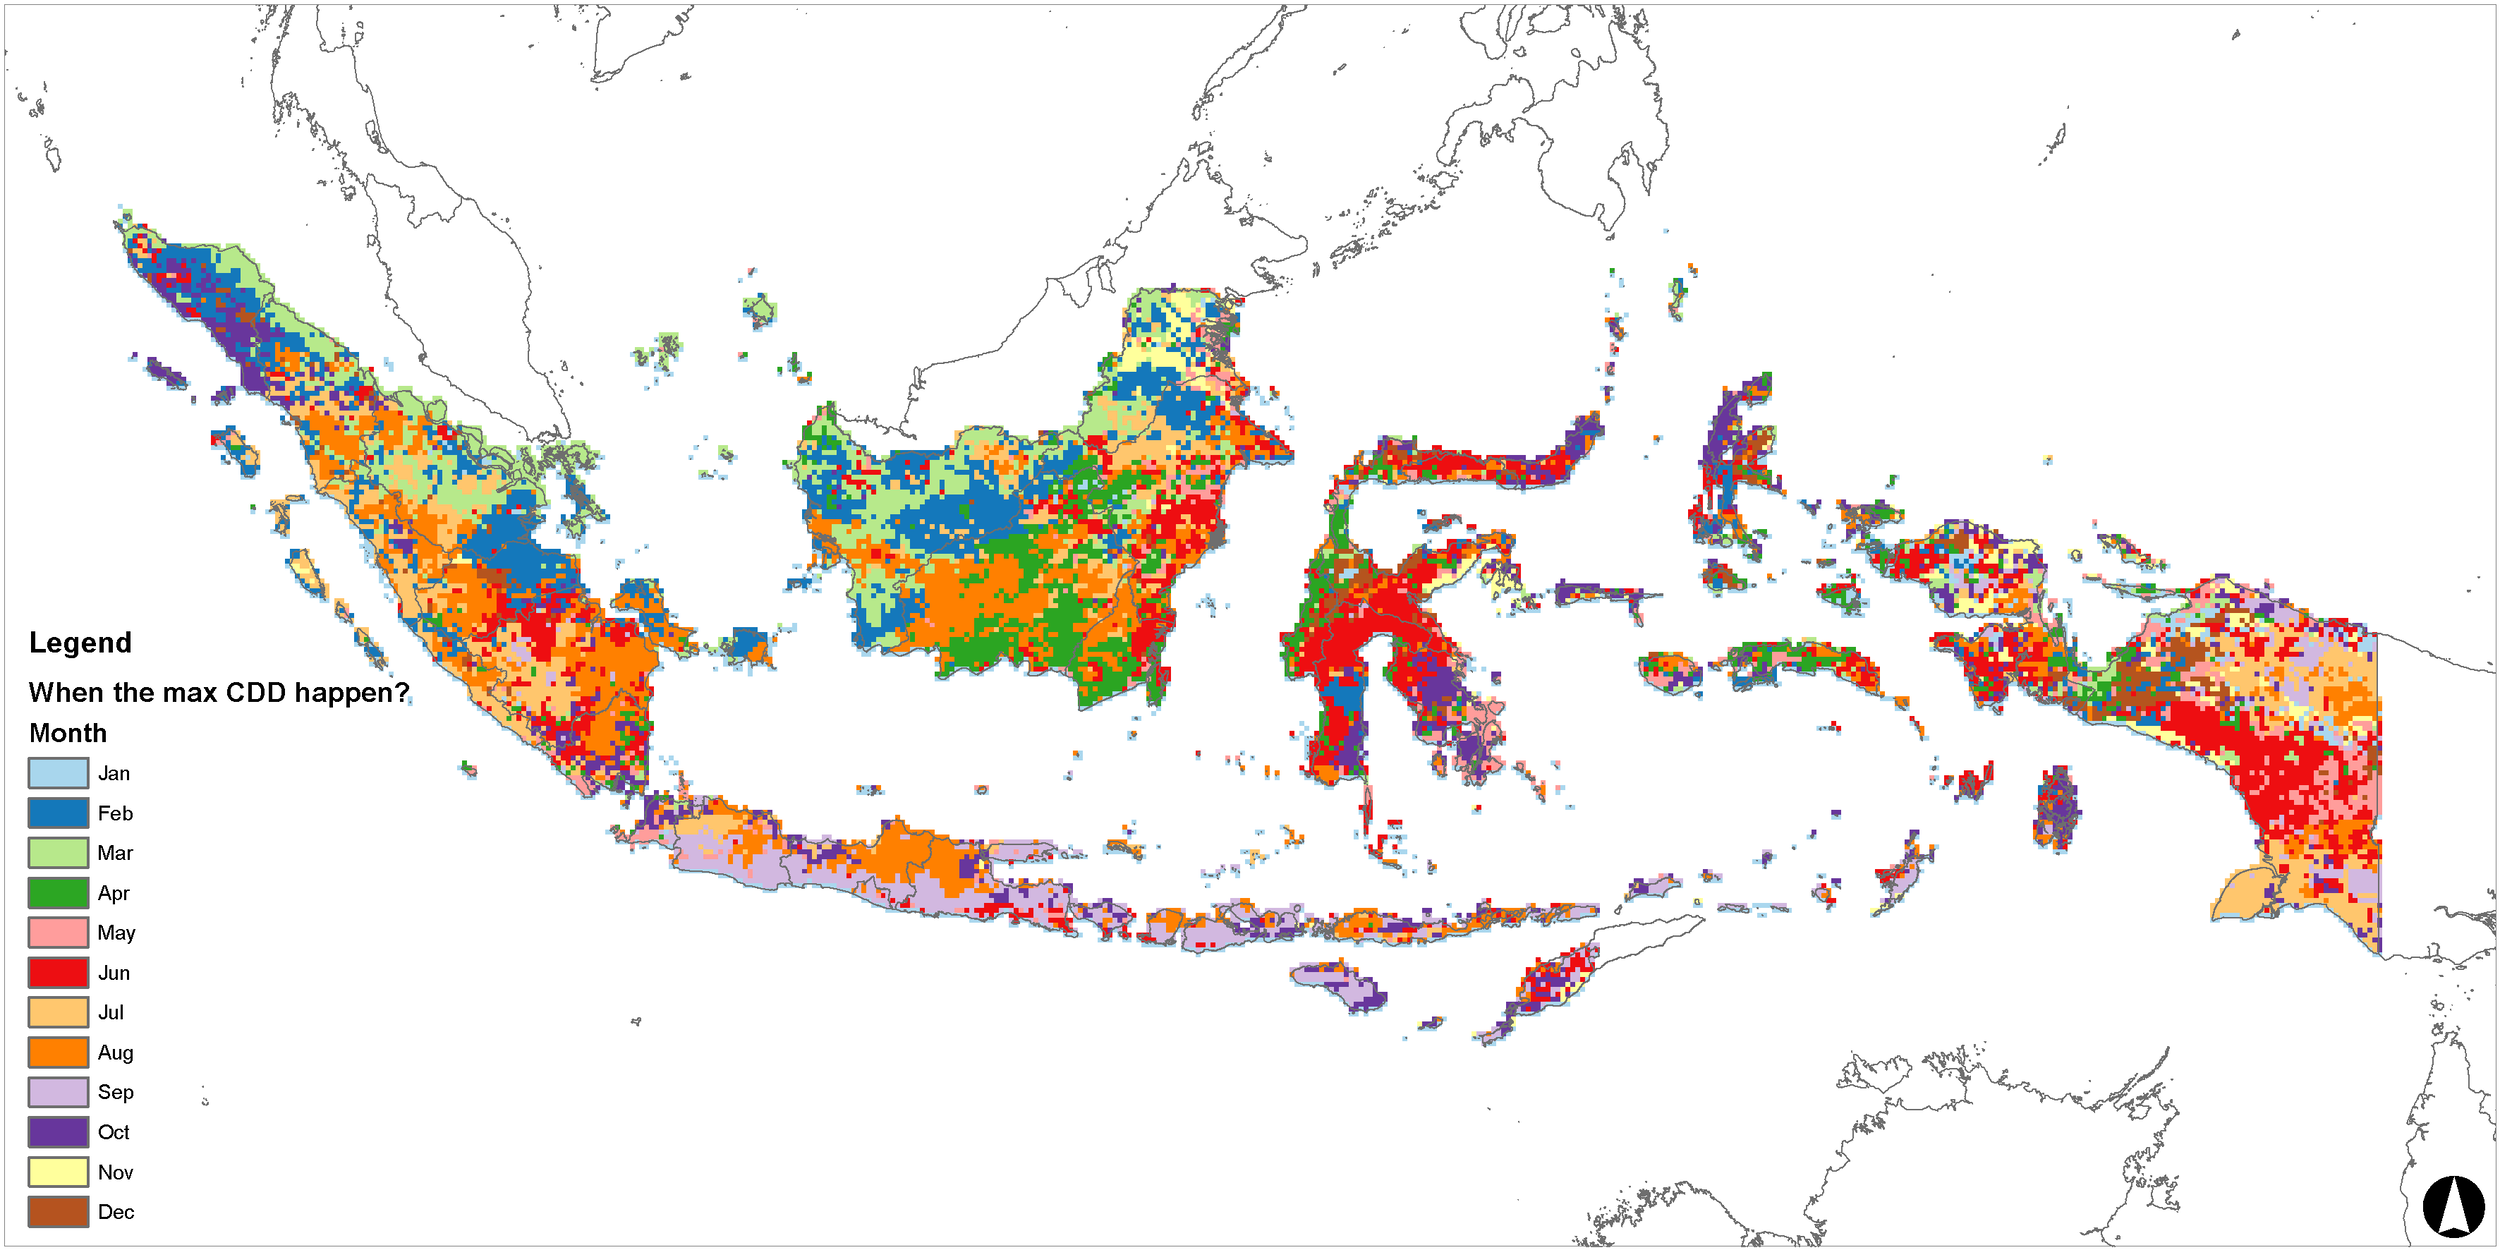
On average, rainy season ends on March. So April marks the onset of dry season. This is inline with above map, where southern part of the country (Java, Bali and Nusa Tenggara) experience the peak of prolonged drought in September.
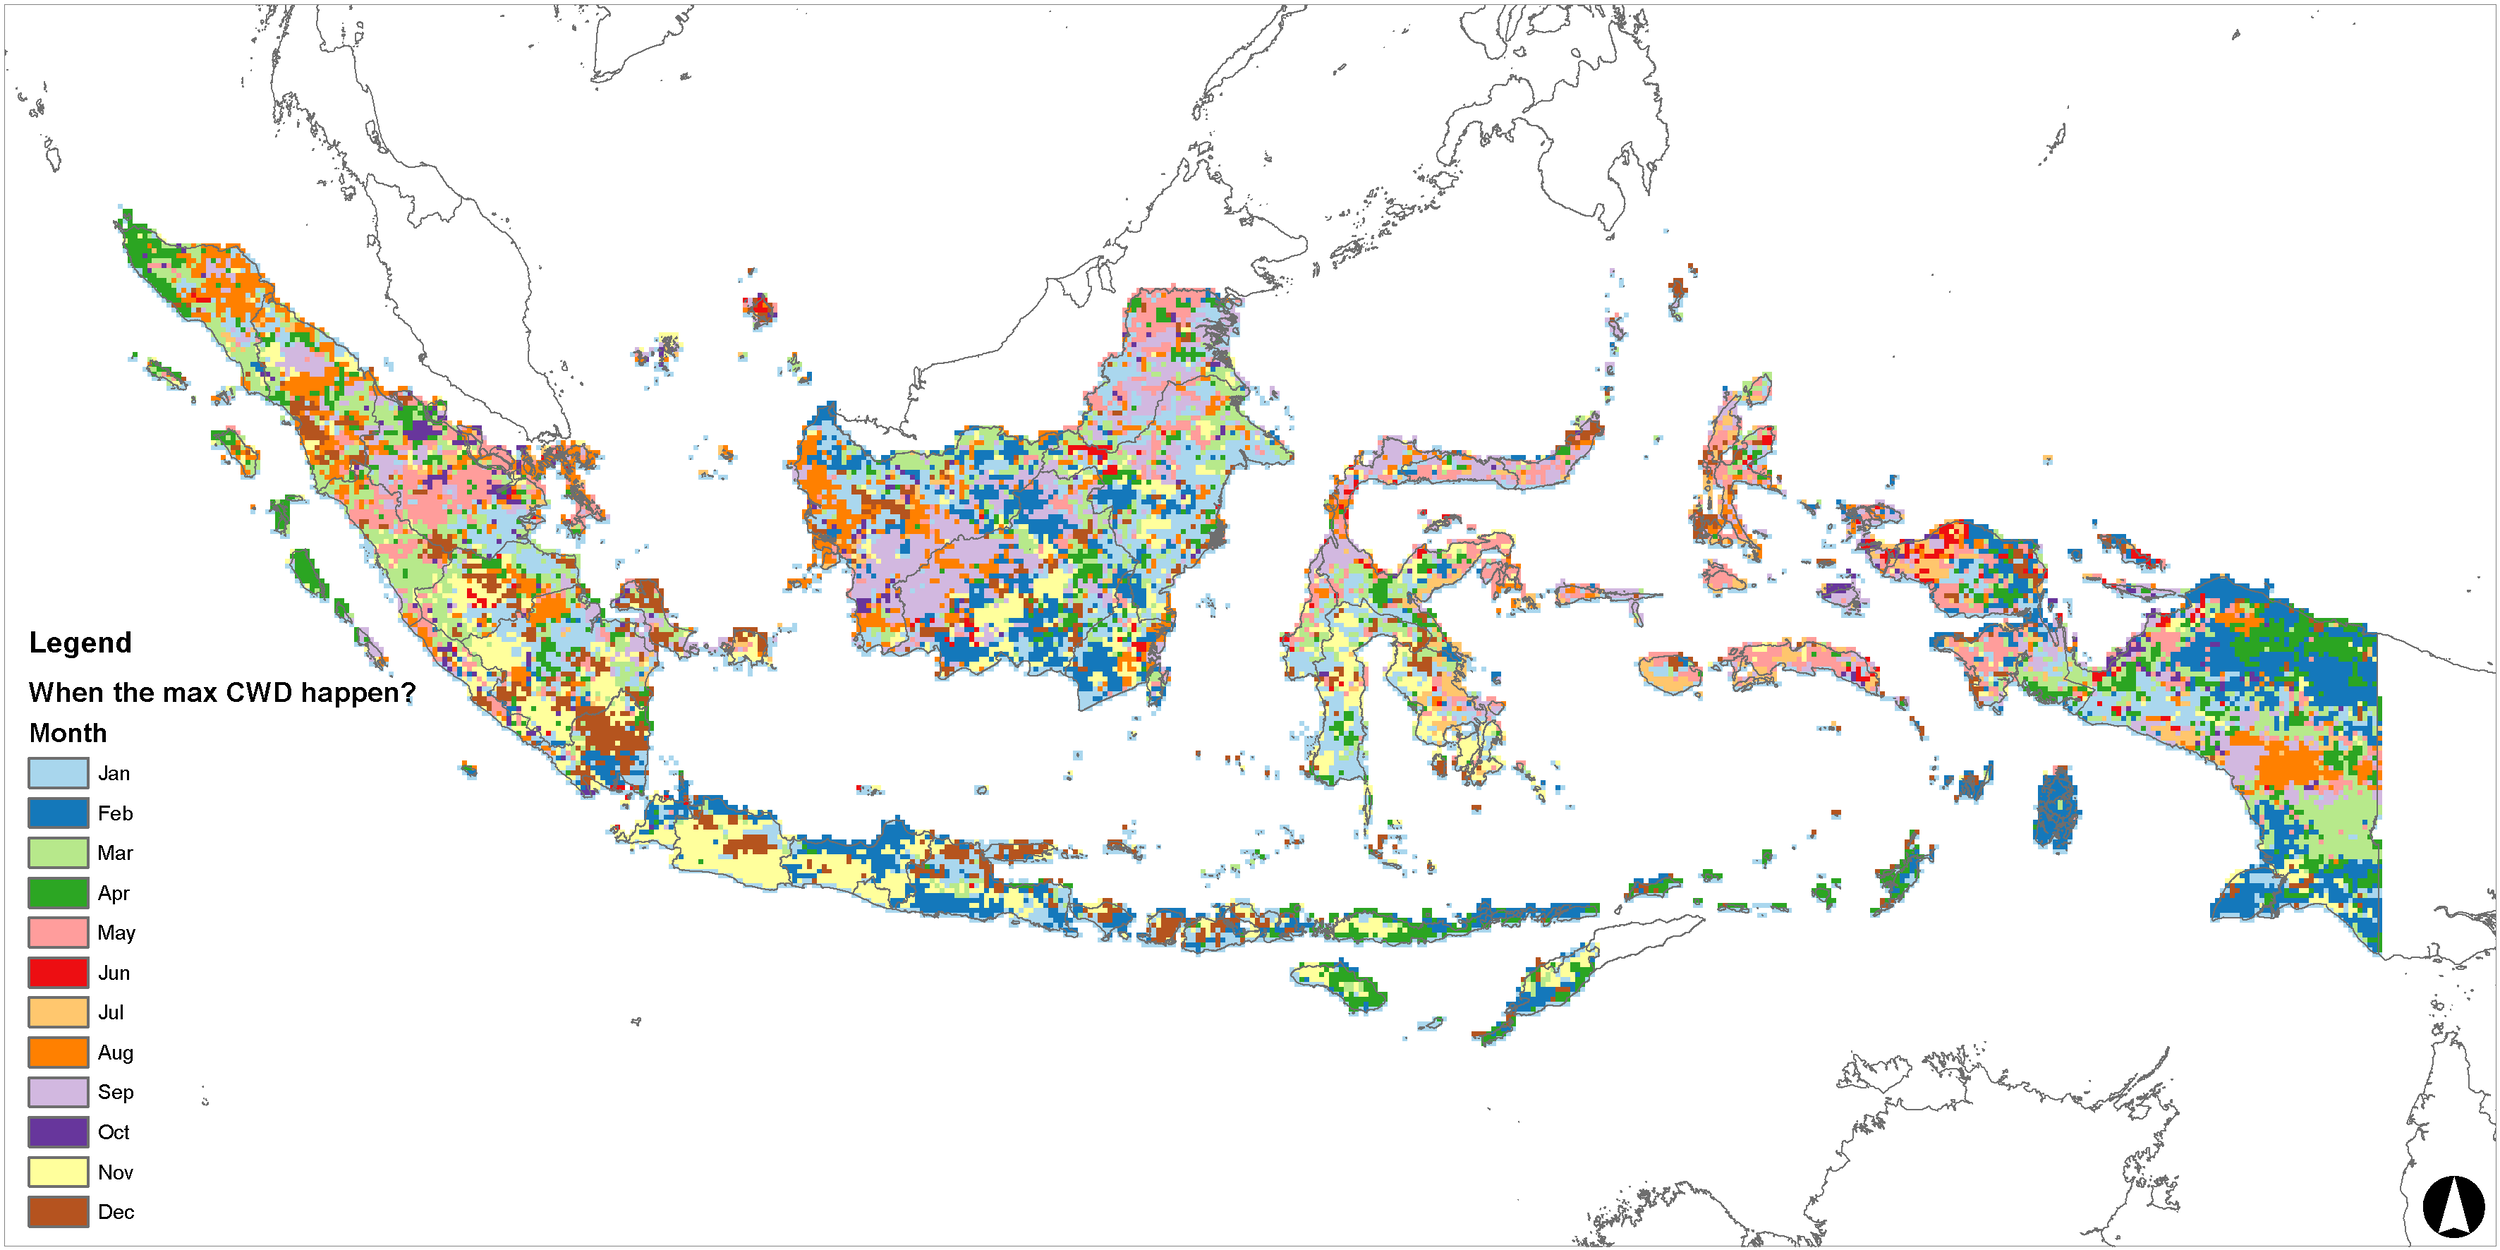
Consecutive Wet Days
Following the prolonged dry season that resulted to an extreme drought, some areas also experience wetter condition i.e 6 to 20 days of wet spell. Moderate CWD (11-20 days) was detected in Java, while short CWD (6-10 days) occurred in other areas of Indonesia. Moderate to long number of dry spell was experienced scatteredly in small part of Central Java and Papua.
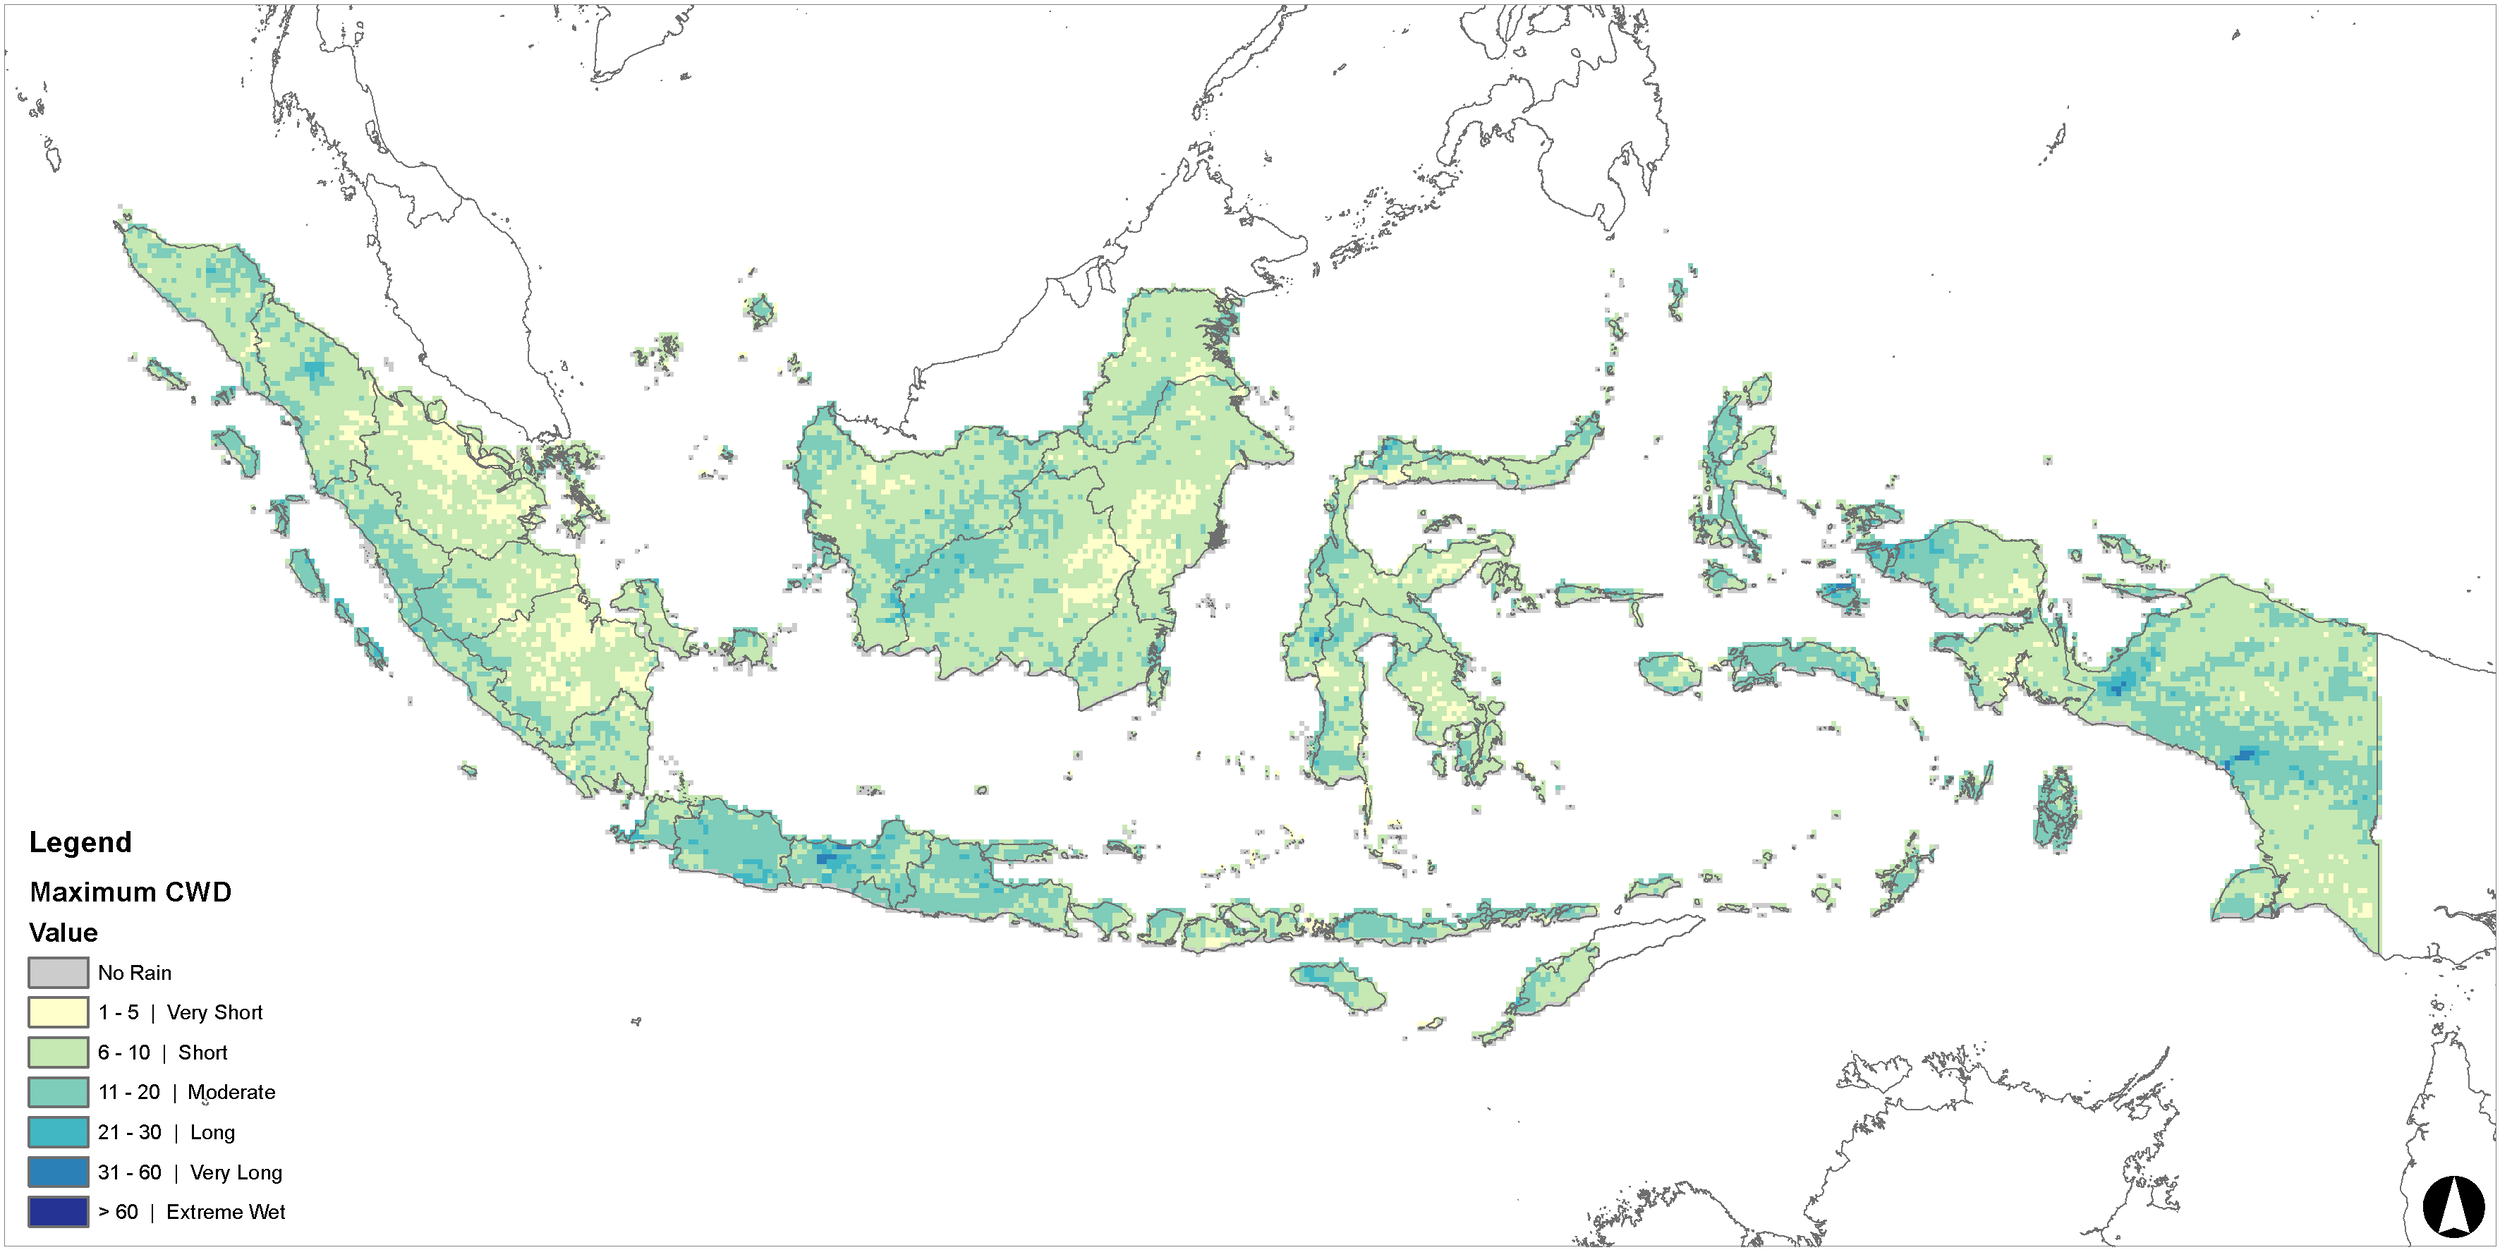
Each areas experienced peak of wet condition in different periods as explained in below map.
Total Dry and Wet Days in a Year
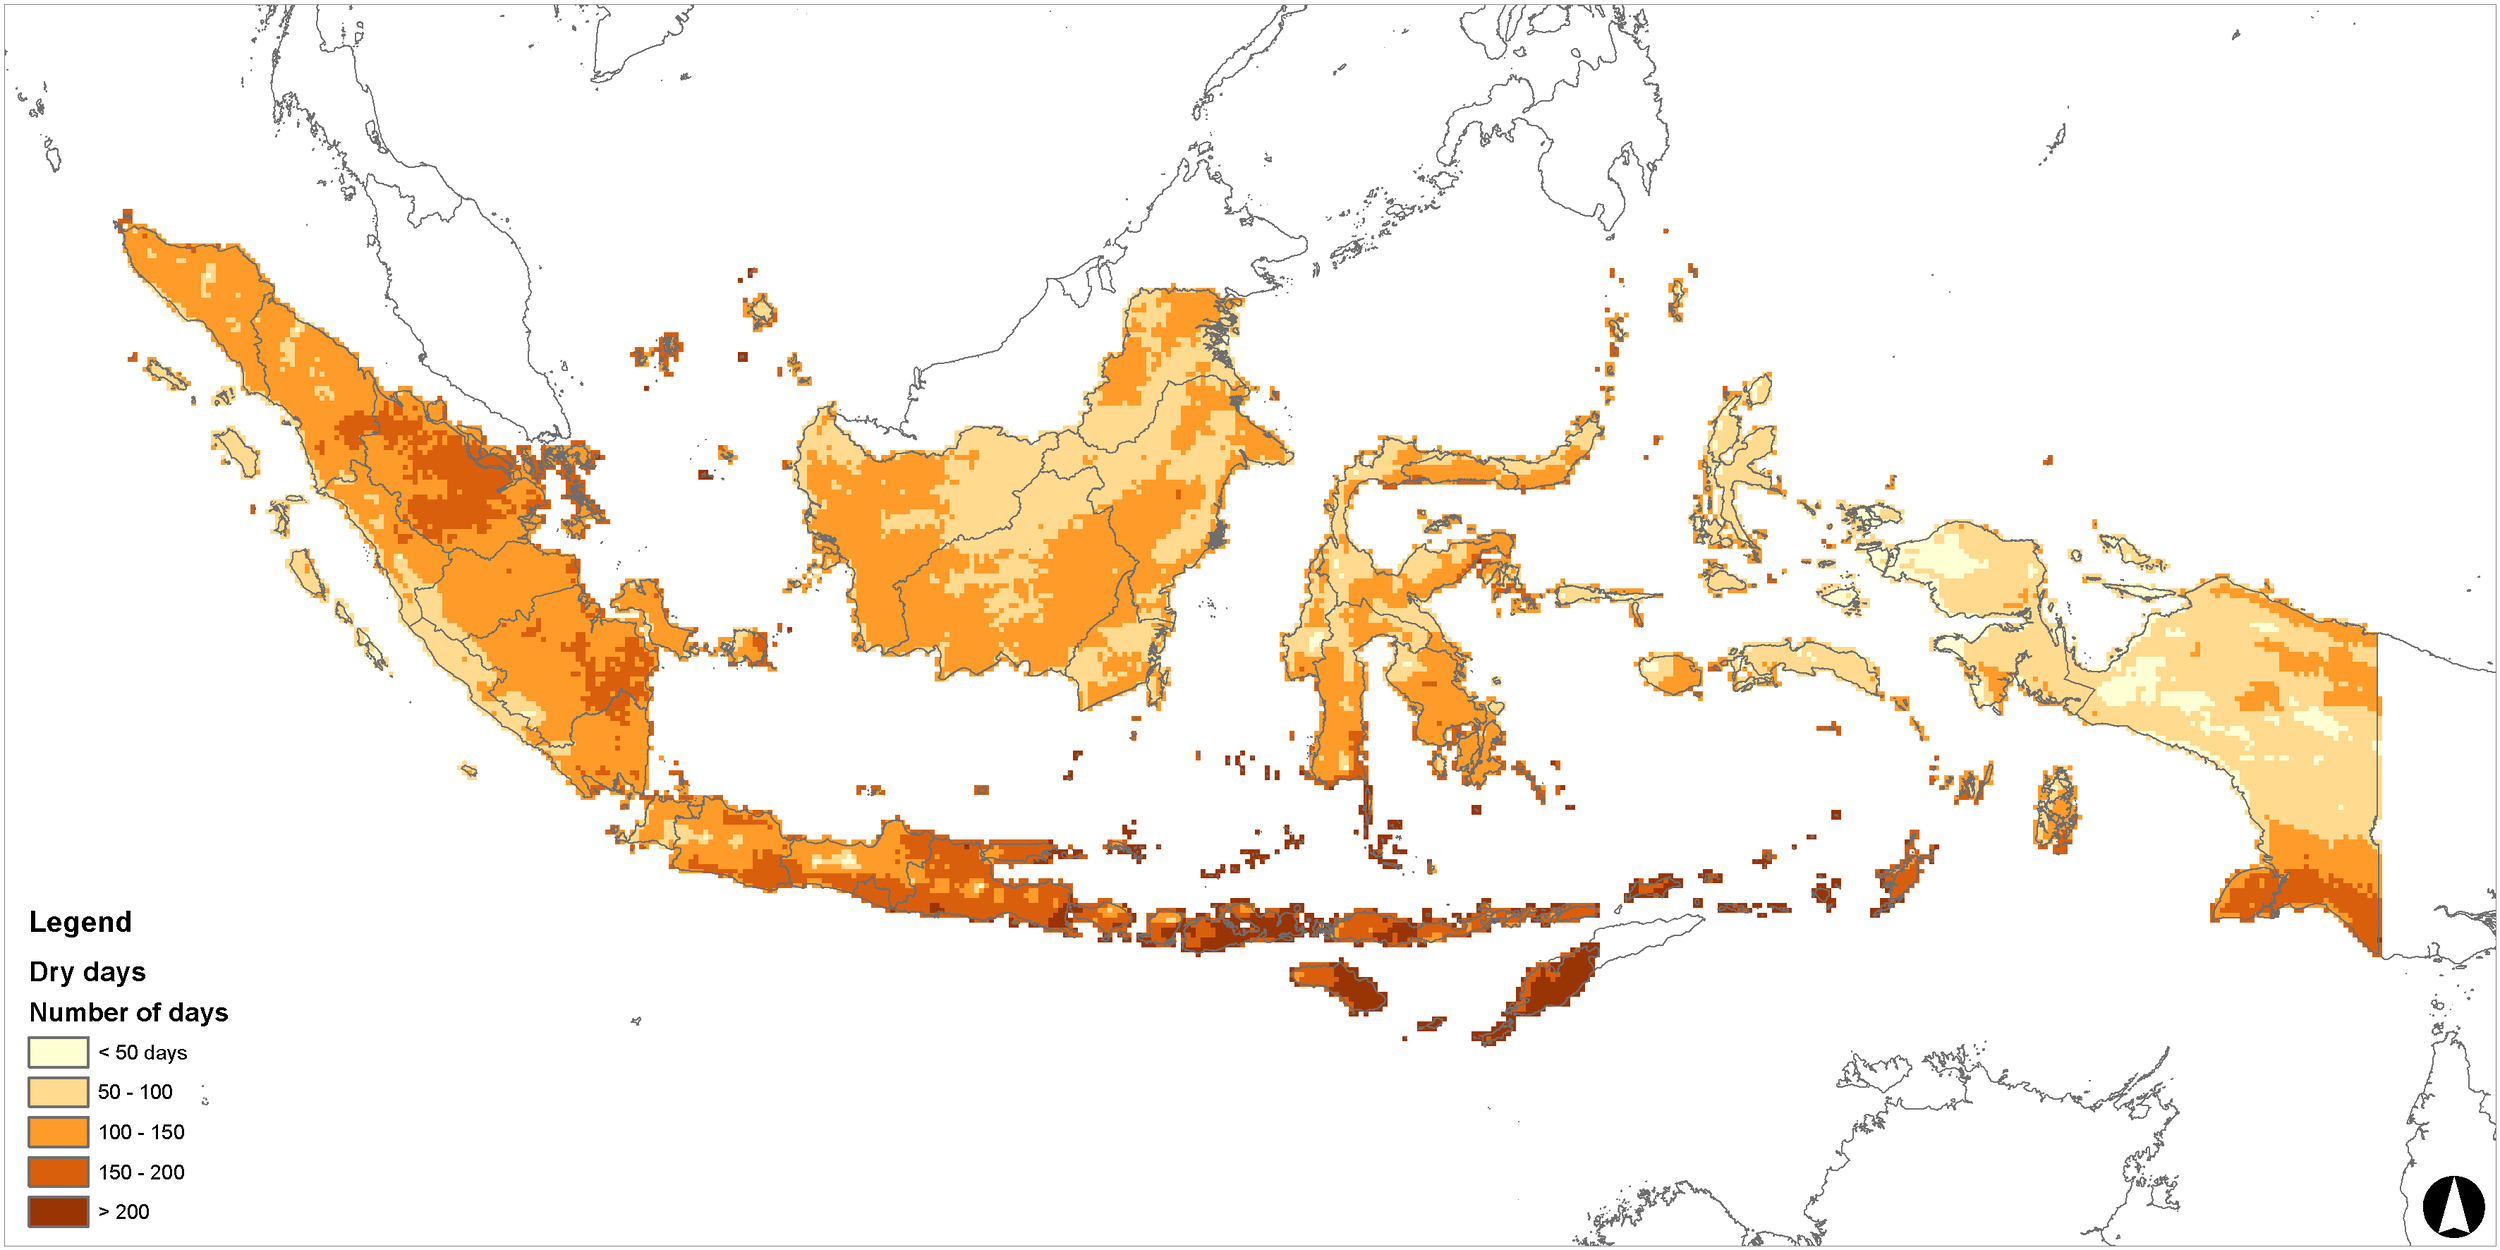
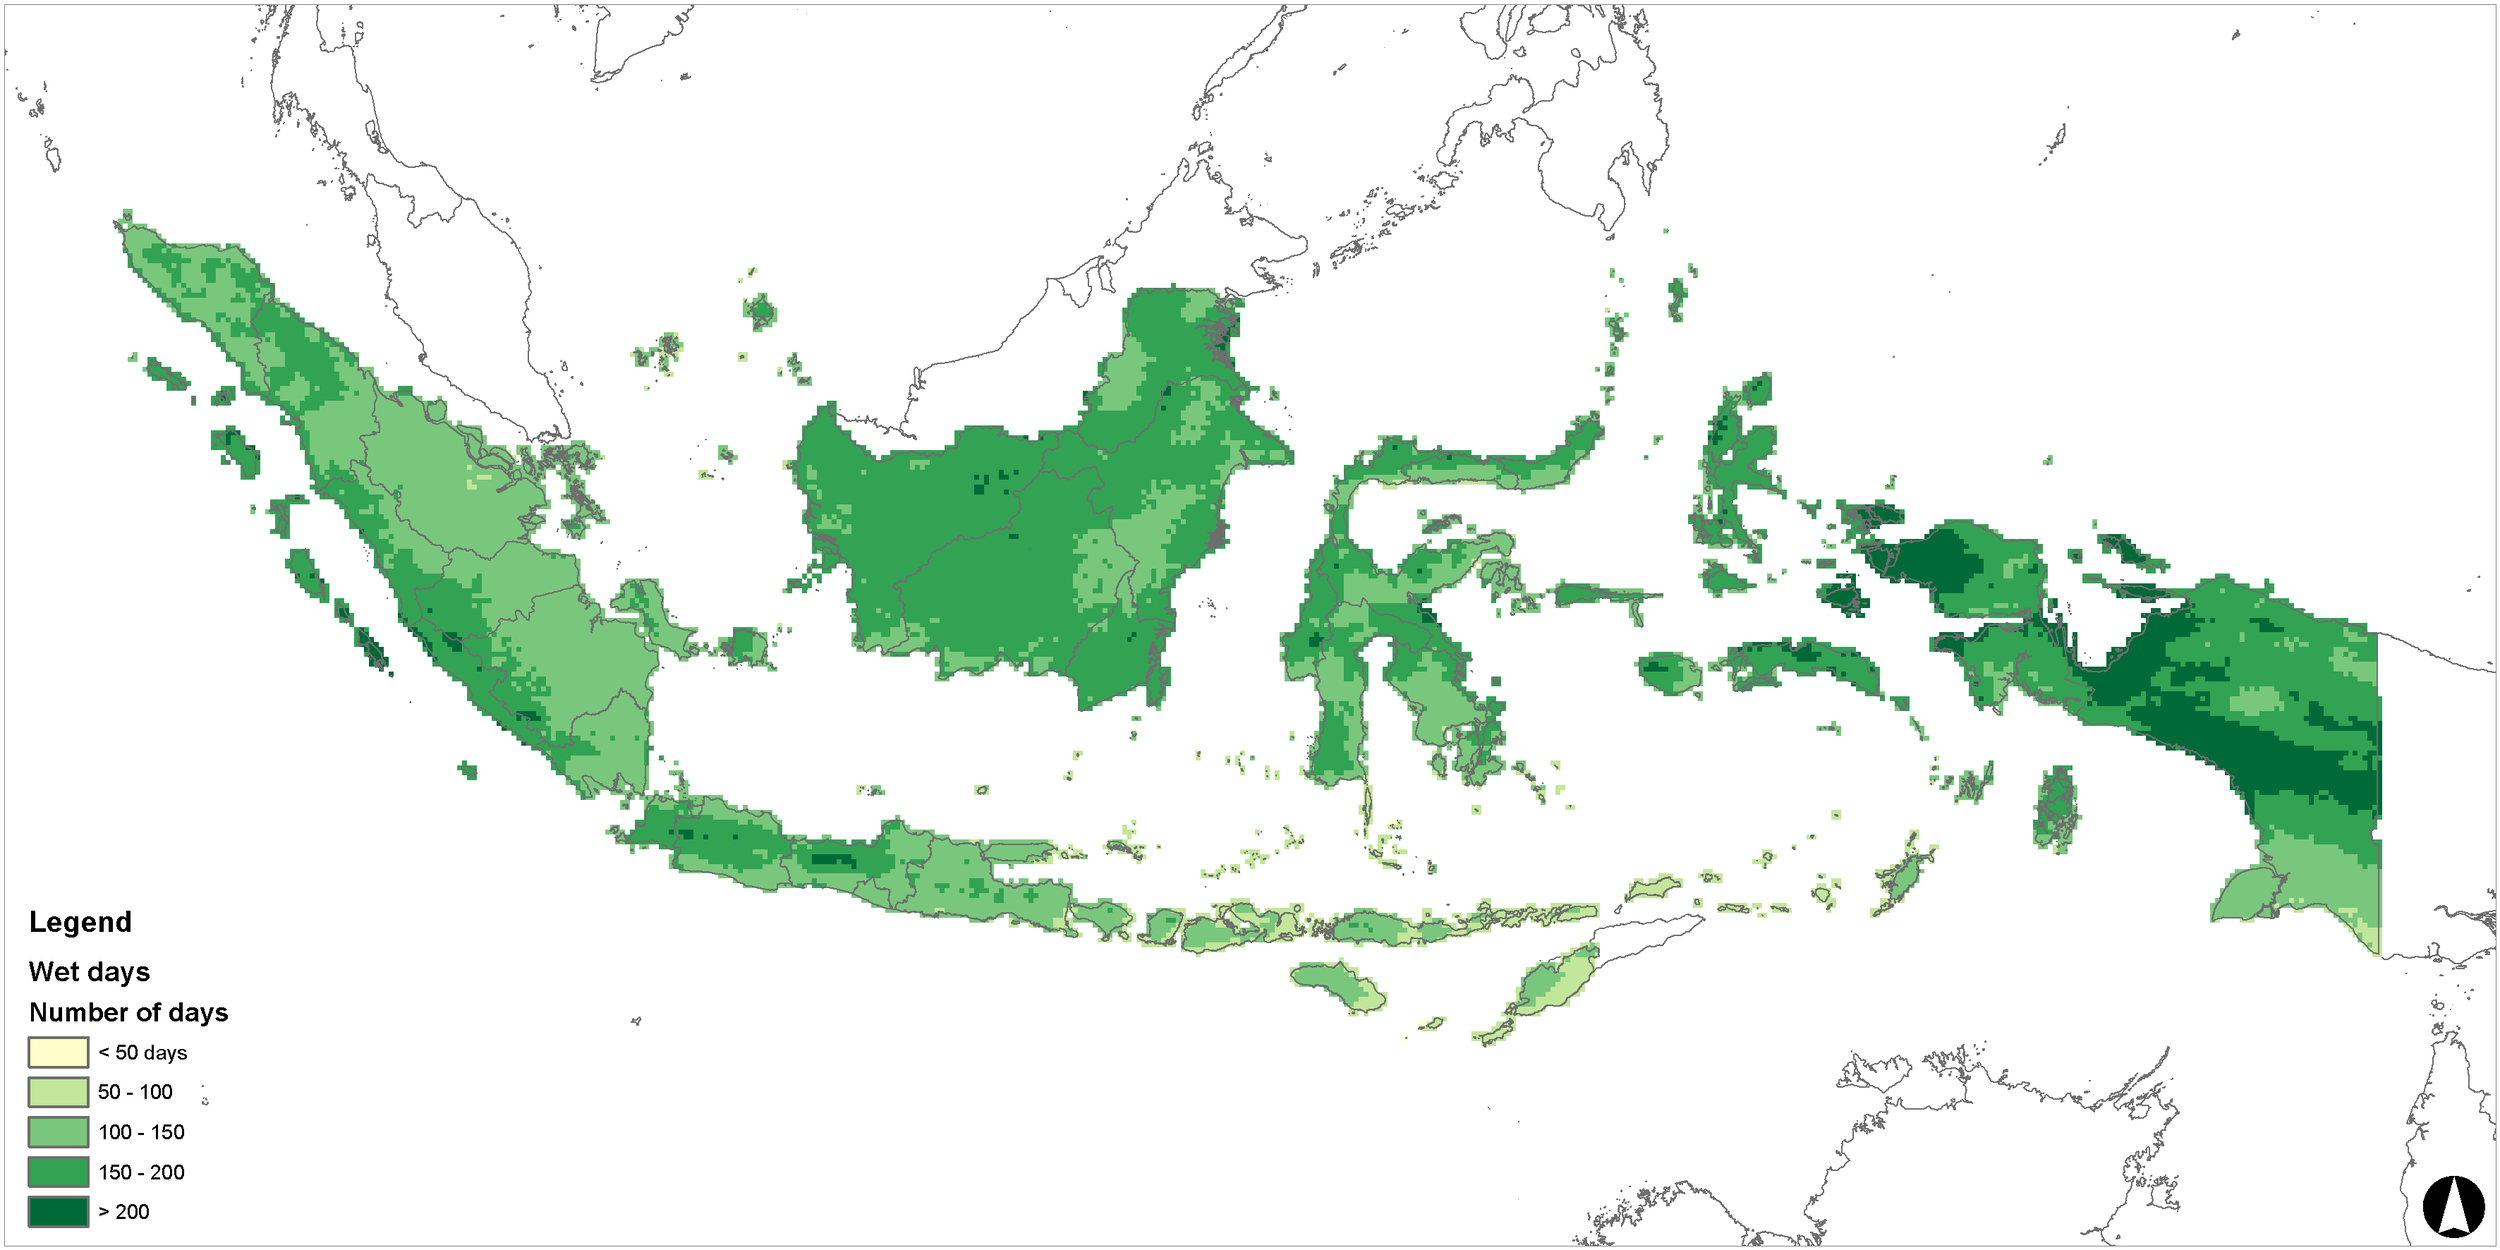
For above maps, I am using 5 mm is a threshold of rainfall total for each day which can be categorised as rainy day and slightly different from what is used widely by meteorological bureau (1 mm).
The highest annual number of dry days is found in Sabu Raijua, East Nusa Tenggara, while for highest wet days is found in Weyland mountain, Dogiyai - Papua.
Disclaimer:
All content related to climate within this blog post is merely based upon the most current available remote sensing data. As the climate phenomena is a dynamic situation, the current realities may differ from what is depicted in this post.
Ground check is necessary to ensure if satellite and field situation data are corresponding.