CHIRPS SPI
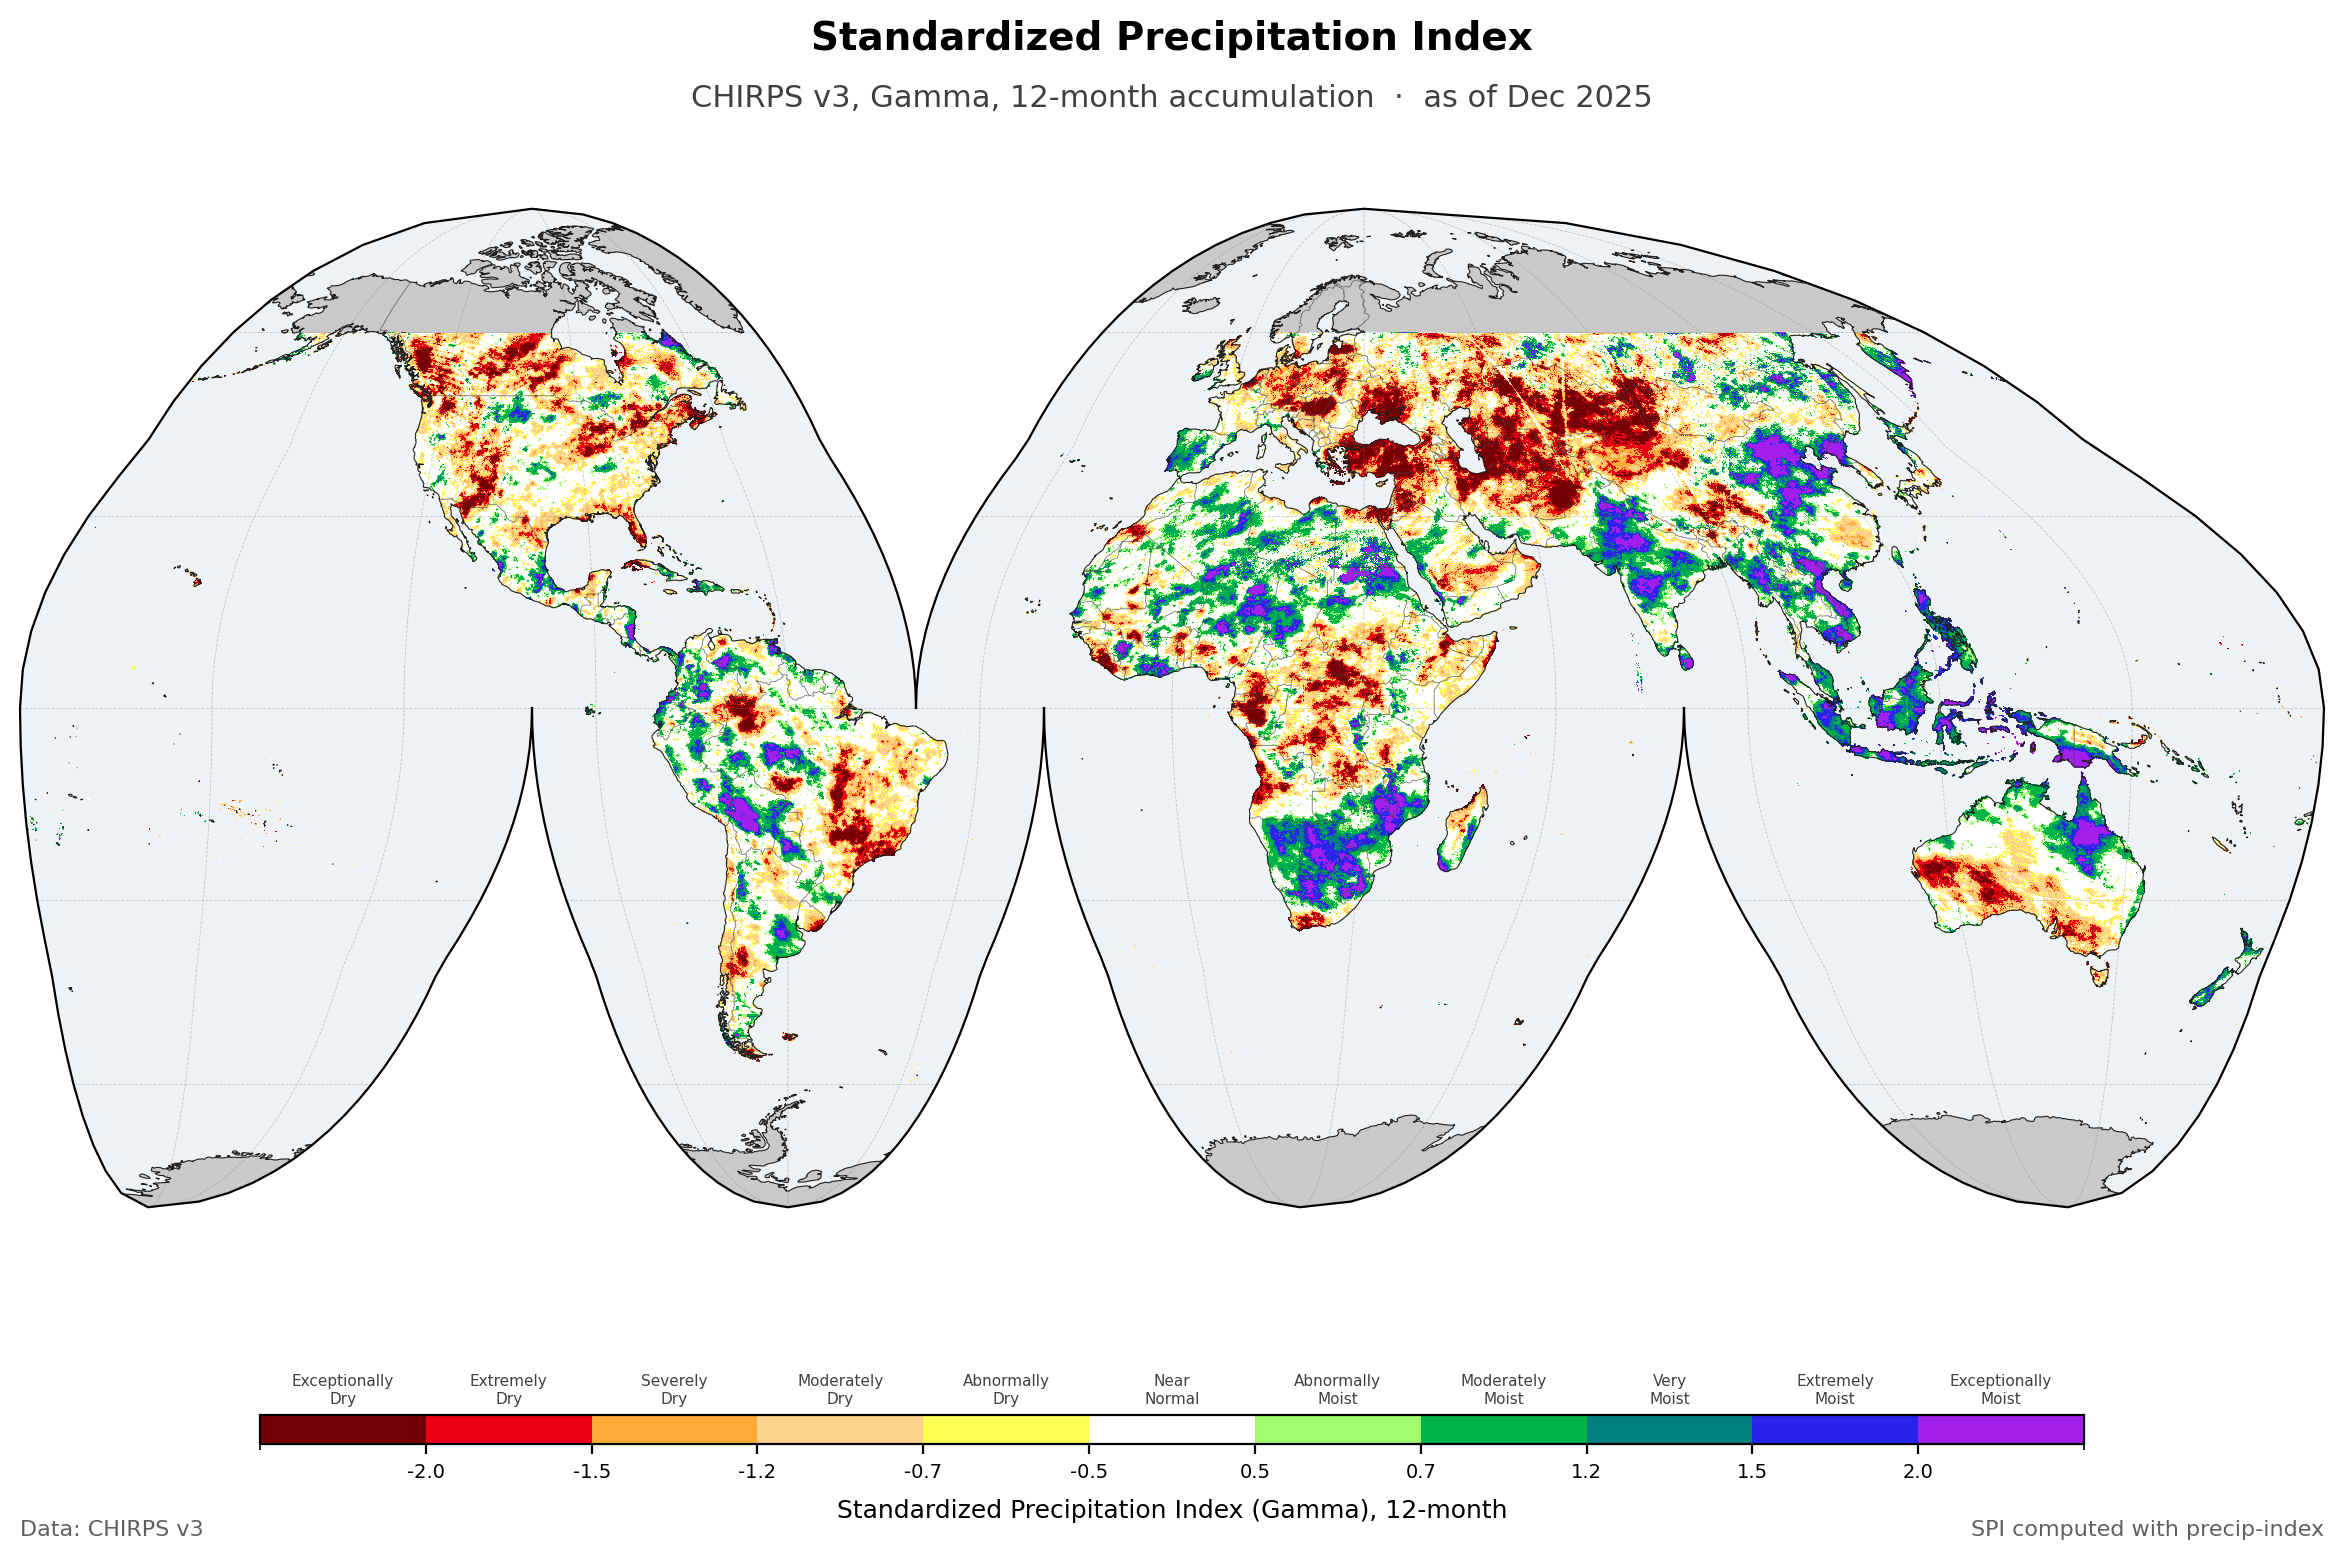
Standardized Precipitation Index, 1981 to 2025
The Standardized Precipitation Index over the global land surface between 60N and 60S, monthly, at about 5.5 km, from 1981 to 2025. SPI compares accumulated rainfall against the rainfall distribution for that place and that time of year, so it answers one question and only that one: is this wetter or drier than usual here. It knows nothing about temperature or evaporative demand, which is what separates it from SPEI. Twelve accumulation periods are published, from 1 to 72 months.
Method
SPI is calculated with precip-index from CHIRPS v3 monthly precipitation. The distribution is fitted with a gamma, against 1991 to 2020 as the baseline period.
Coverage stops at 60N and 60S because that is where CHIRPS stops. The grid is global in longitude, so the poleward rows are present in the file and simply carry no data.
Interpretation
The eleven classes below are the WMO scheme, and they are what the colours on the map mean. The hex values are given so a map you make from this data can be read alongside one made from mine.
| Category | SPI Value | Hex | RGB |
|---|---|---|---|
| Exceptionally Dry | -2.00 and below | #760005 |
rgb(118, 0, 5) |
| Extremely Dry | -2.00 to -1.50 | #ec0013 |
rgb(236, 0, 19) |
| Severely Dry | -1.50 to -1.20 | #ffa938 |
rgb(255, 169, 56) |
| Moderately Dry | -1.20 to -0.70 | #fdd28a |
rgb(253, 210, 138) |
| Abnormally Dry | -0.70 to -0.50 | #fefe53 |
rgb(254, 254, 83) |
| Near Normal | -0.50 to +0.50 | #ffffff |
rgb(255, 255, 255) |
| Abnormally Moist | +0.50 to +0.70 | #a2fd6e |
rgb(162, 253, 110) |
| Moderately Moist | +0.70 to +1.20 | #00b44a |
rgb(0, 180, 74) |
| Very Moist | +1.20 to +1.50 | #008180 |
rgb(0, 129, 128) |
| Extremely Moist | +1.50 to +2.00 | #2a23eb |
rgb(42, 35, 235) |
| Exceptionally Moist | +2.00 and above | #a21fec |
rgb(162, 31, 236) |
Reading the time axis
Every time step is stamped on the 21st of the month: 1981-01-21, 1981-02-21, and so on through 2025-12-21. All 540 steps in the record use the 21st.
The day is there because a netCDF time coordinate has to be a complete date. It is not a claim about the 21st. These are monthly values, each one covering its whole month, so 2025-12-21 means December 2025 and nothing narrower.
In practice: slice on the year and month and ignore the day. If your tooling wants an exact match, either select with method="nearest" or group by month rather than indexing on a literal date.
Download
Each accumulation period is a separate netCDF covering the full record.
| Timescale | File | Size |
|---|---|---|
| 1 month | wld_cli_chirps3_spi_gamma_1_month.nc |
In preparation |
| 2 month | wld_cli_chirps3_spi_gamma_2_month.nc |
In preparation |
| 3 month | wld_cli_chirps3_spi_gamma_3_month.nc |
In preparation |
| 6 month | wld_cli_chirps3_spi_gamma_6_month.nc |
8.02 GB |
| 9 month | wld_cli_chirps3_spi_gamma_9_month.nc |
In preparation |
| 12 month | wld_cli_chirps3_spi_gamma_12_month.nc |
7.93 GB |
| 18 month | wld_cli_chirps3_spi_gamma_18_month.nc |
In preparation |
| 24 month | wld_cli_chirps3_spi_gamma_24_month.nc |
In preparation |
| 36 month | wld_cli_chirps3_spi_gamma_36_month.nc |
In preparation |
| 48 month | wld_cli_chirps3_spi_gamma_48_month.nc |
In preparation |
| 60 month | wld_cli_chirps3_spi_gamma_60_month.nc |
In preparation |
| 72 month | wld_cli_chirps3_spi_gamma_72_month.nc |
In preparation |
License
- CHIRPS v3, the source data: CC-BY-4.0, or refer to the Climate Hazards Center.
- SPI derived from CHIRPS v3: CC-BY-4.0. Credit this site and the Climate Hazards Center, note it if you changed anything, and otherwise do as you like with it. The attribution the Climate Hazards Center asks for travels with the source data, so it carries through to anything derived from it.