Interactive FSVA
2015 Food Security and Vulnerability Atlas
Since 2003 the Government of Indonesia, in collaboration with WFP, has built up its understanding of food security in Indonesia, including at the local level, through the food security and vulnerability atlases (FSVA). The atlases are used to target programmes and design policy aimed at improving food and nutrition security across the country. The 2015 FSVA is the most recent product of that collaboration, and the first published as an interactive web atlas alongside the printed report.
The indicators
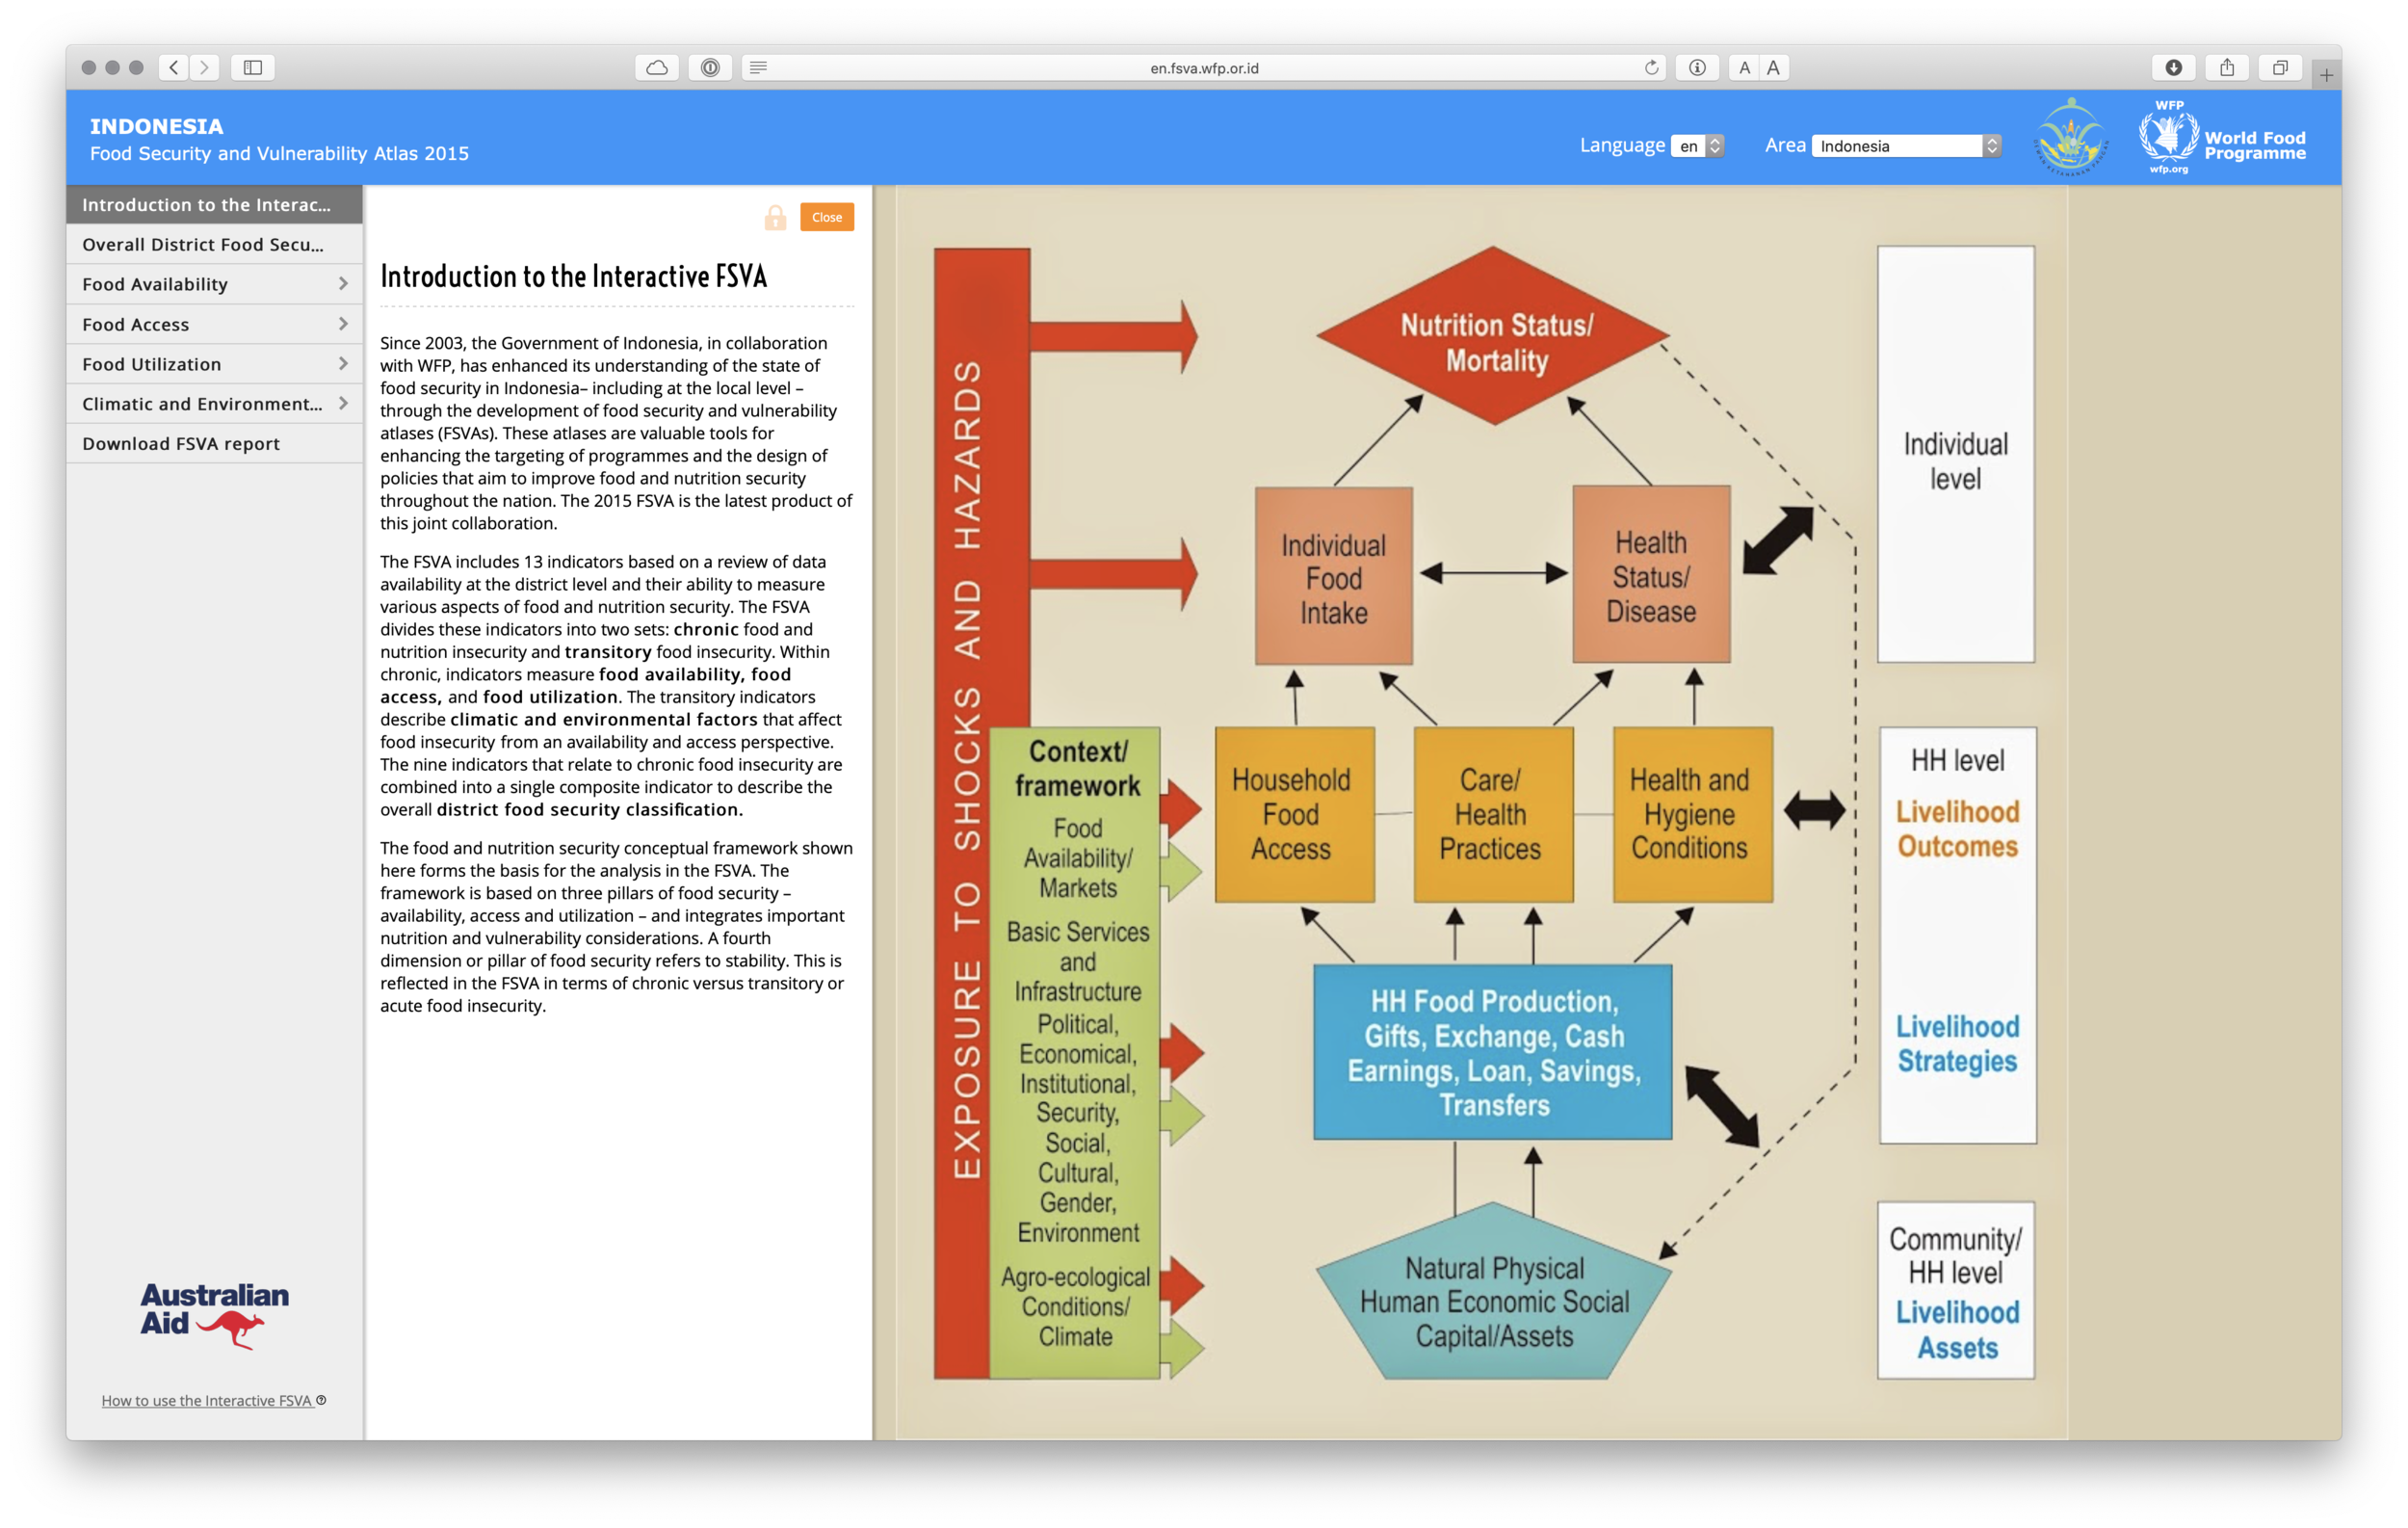
The FSVA uses 13 indicators, chosen by reviewing what data was available at district level and how well each measures an aspect of food and nutrition security. They fall into two sets: chronic food and nutrition insecurity, and transitory food insecurity. The chronic indicators measure food availability, food access and food utilization. The transitory indicators describe the climatic and environmental factors that affect food insecurity from an availability and access perspective. The nine chronic indicators are combined into a single composite indicator that gives each district its overall food security classification.
The conceptual framework behind the analysis rests on three pillars, availability, access and utilization, and folds in nutrition and vulnerability. A fourth pillar, stability, appears in the FSVA as the split between chronic and transitory food insecurity.
Overall district classification
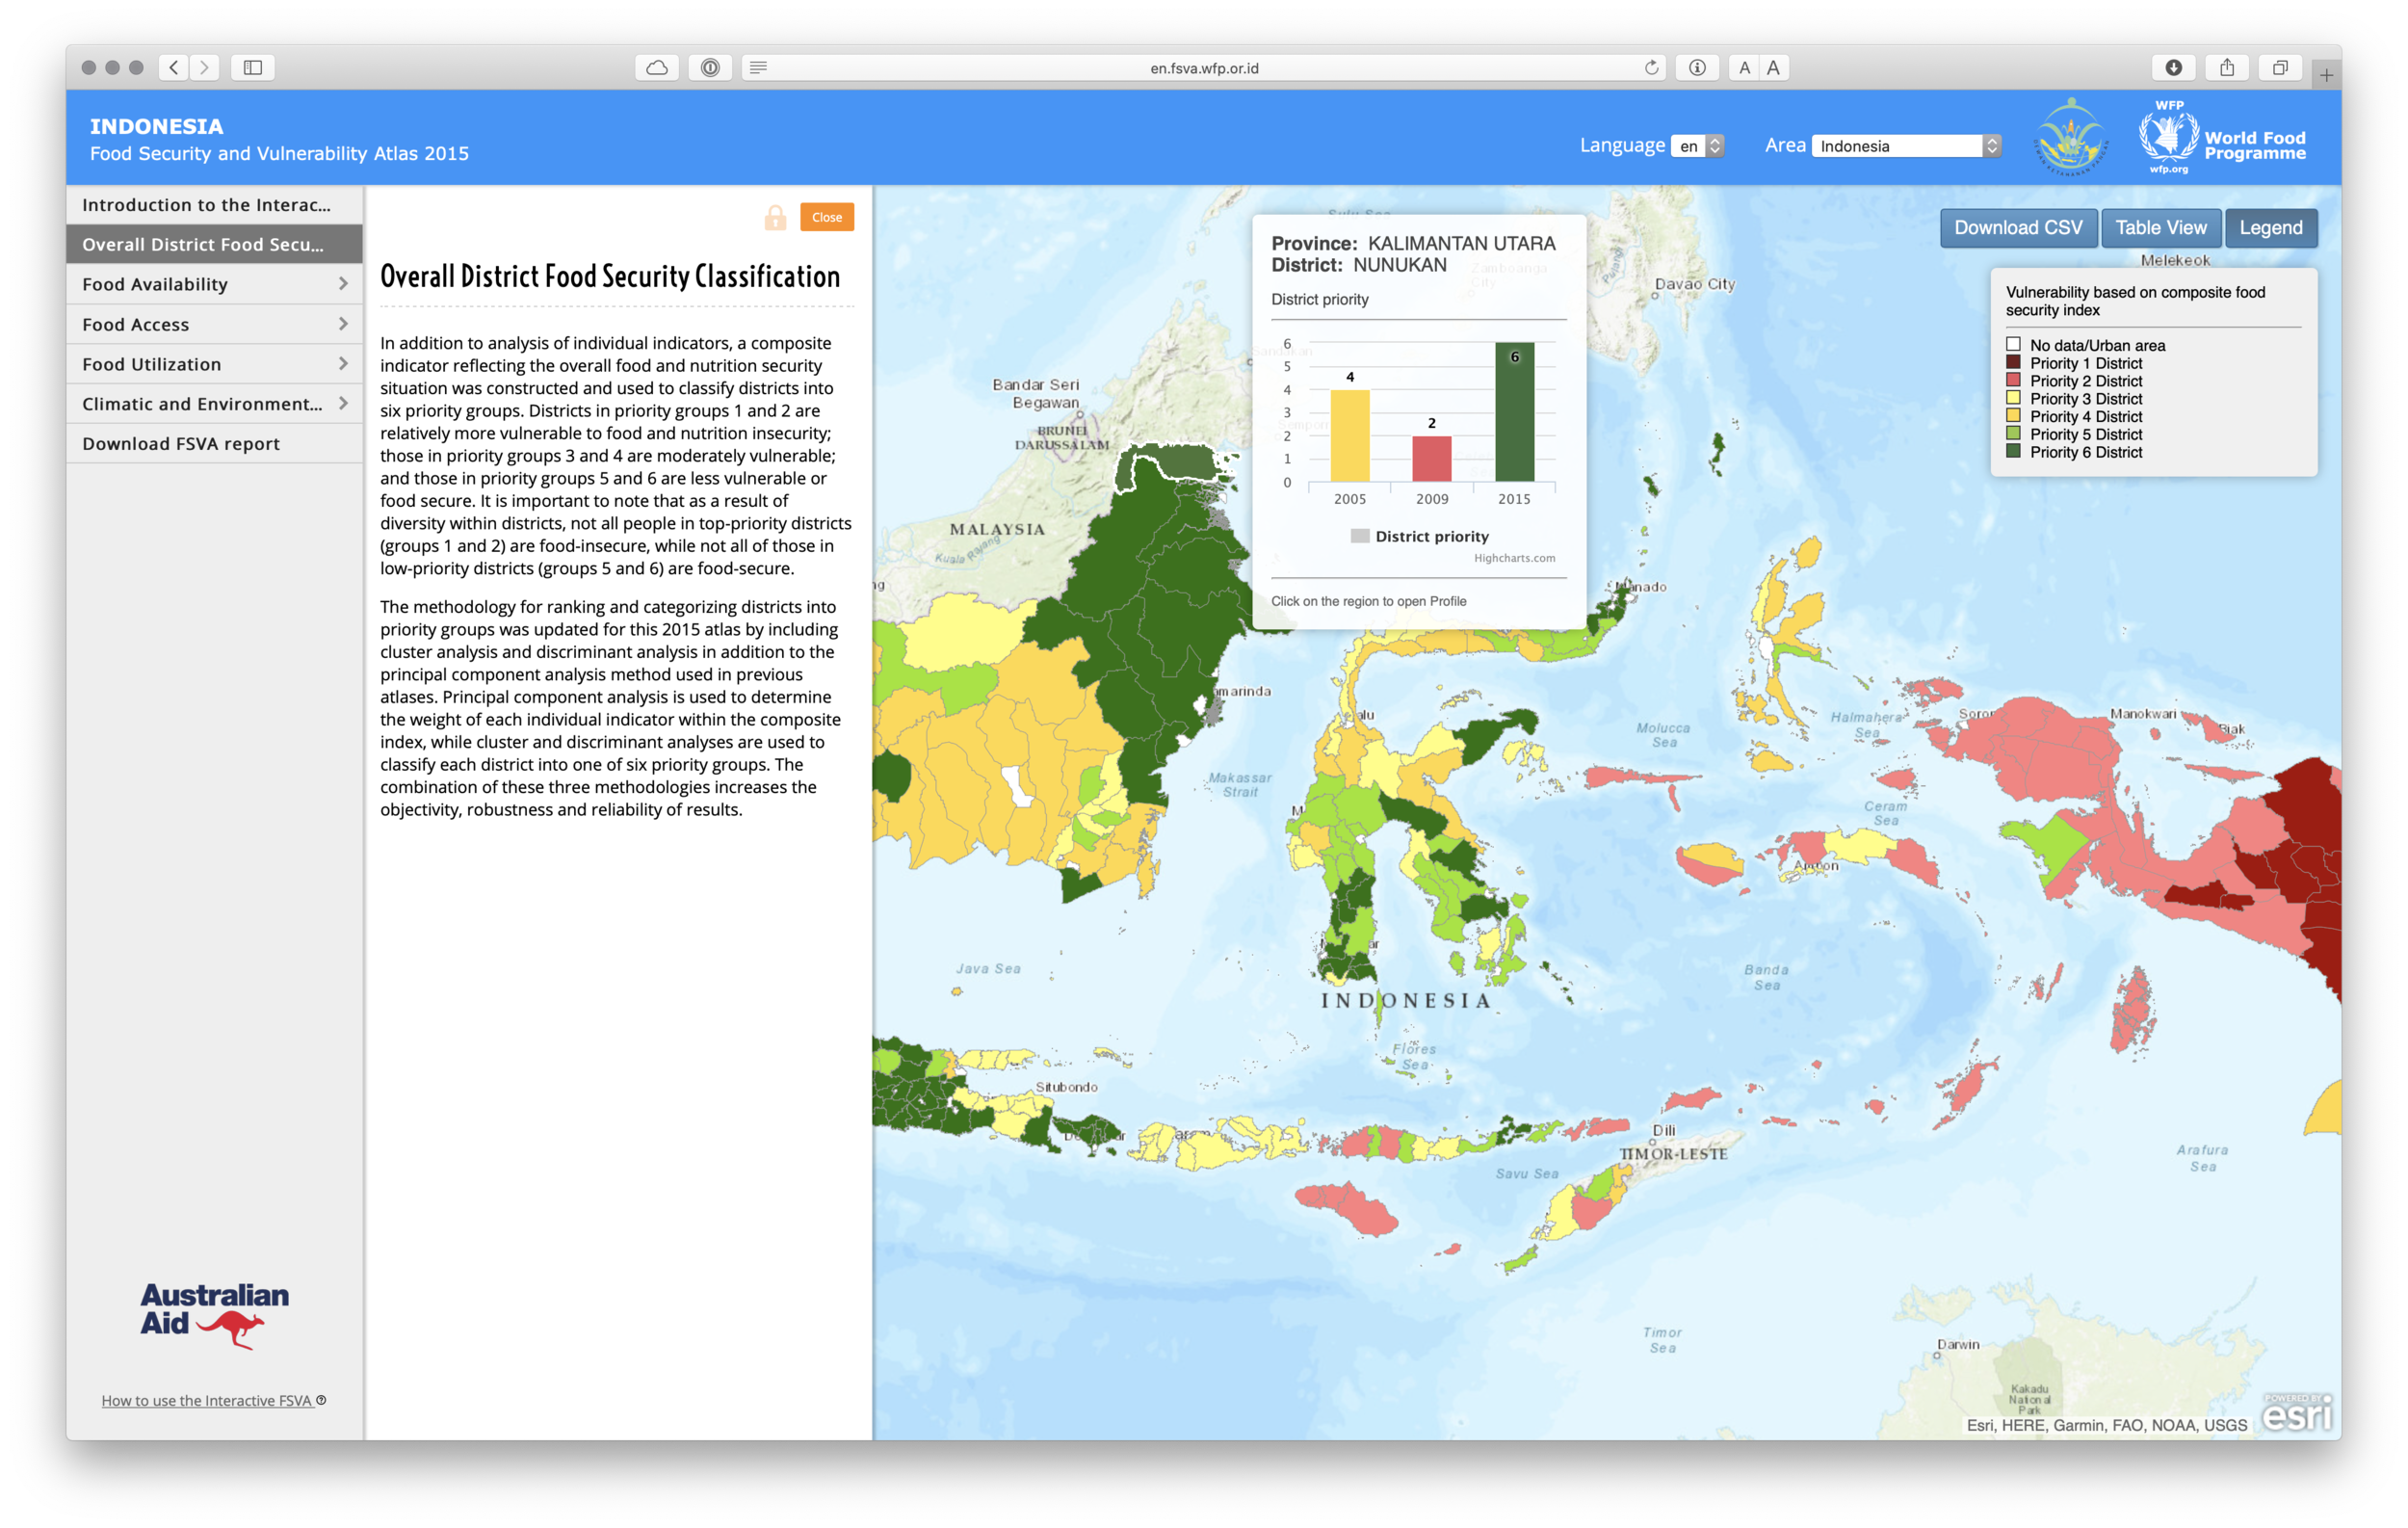
The nine chronic indicators combine into a composite index that sorts every district into one of six priority groups. Groups 1 and 2 are the most vulnerable to food and nutrition insecurity, groups 3 and 4 moderately so, and groups 5 and 6 the least. Clicking a district opens its profile, including how its priority group has moved across the 2005, 2009 and 2015 atlases.
Exploring the indicators
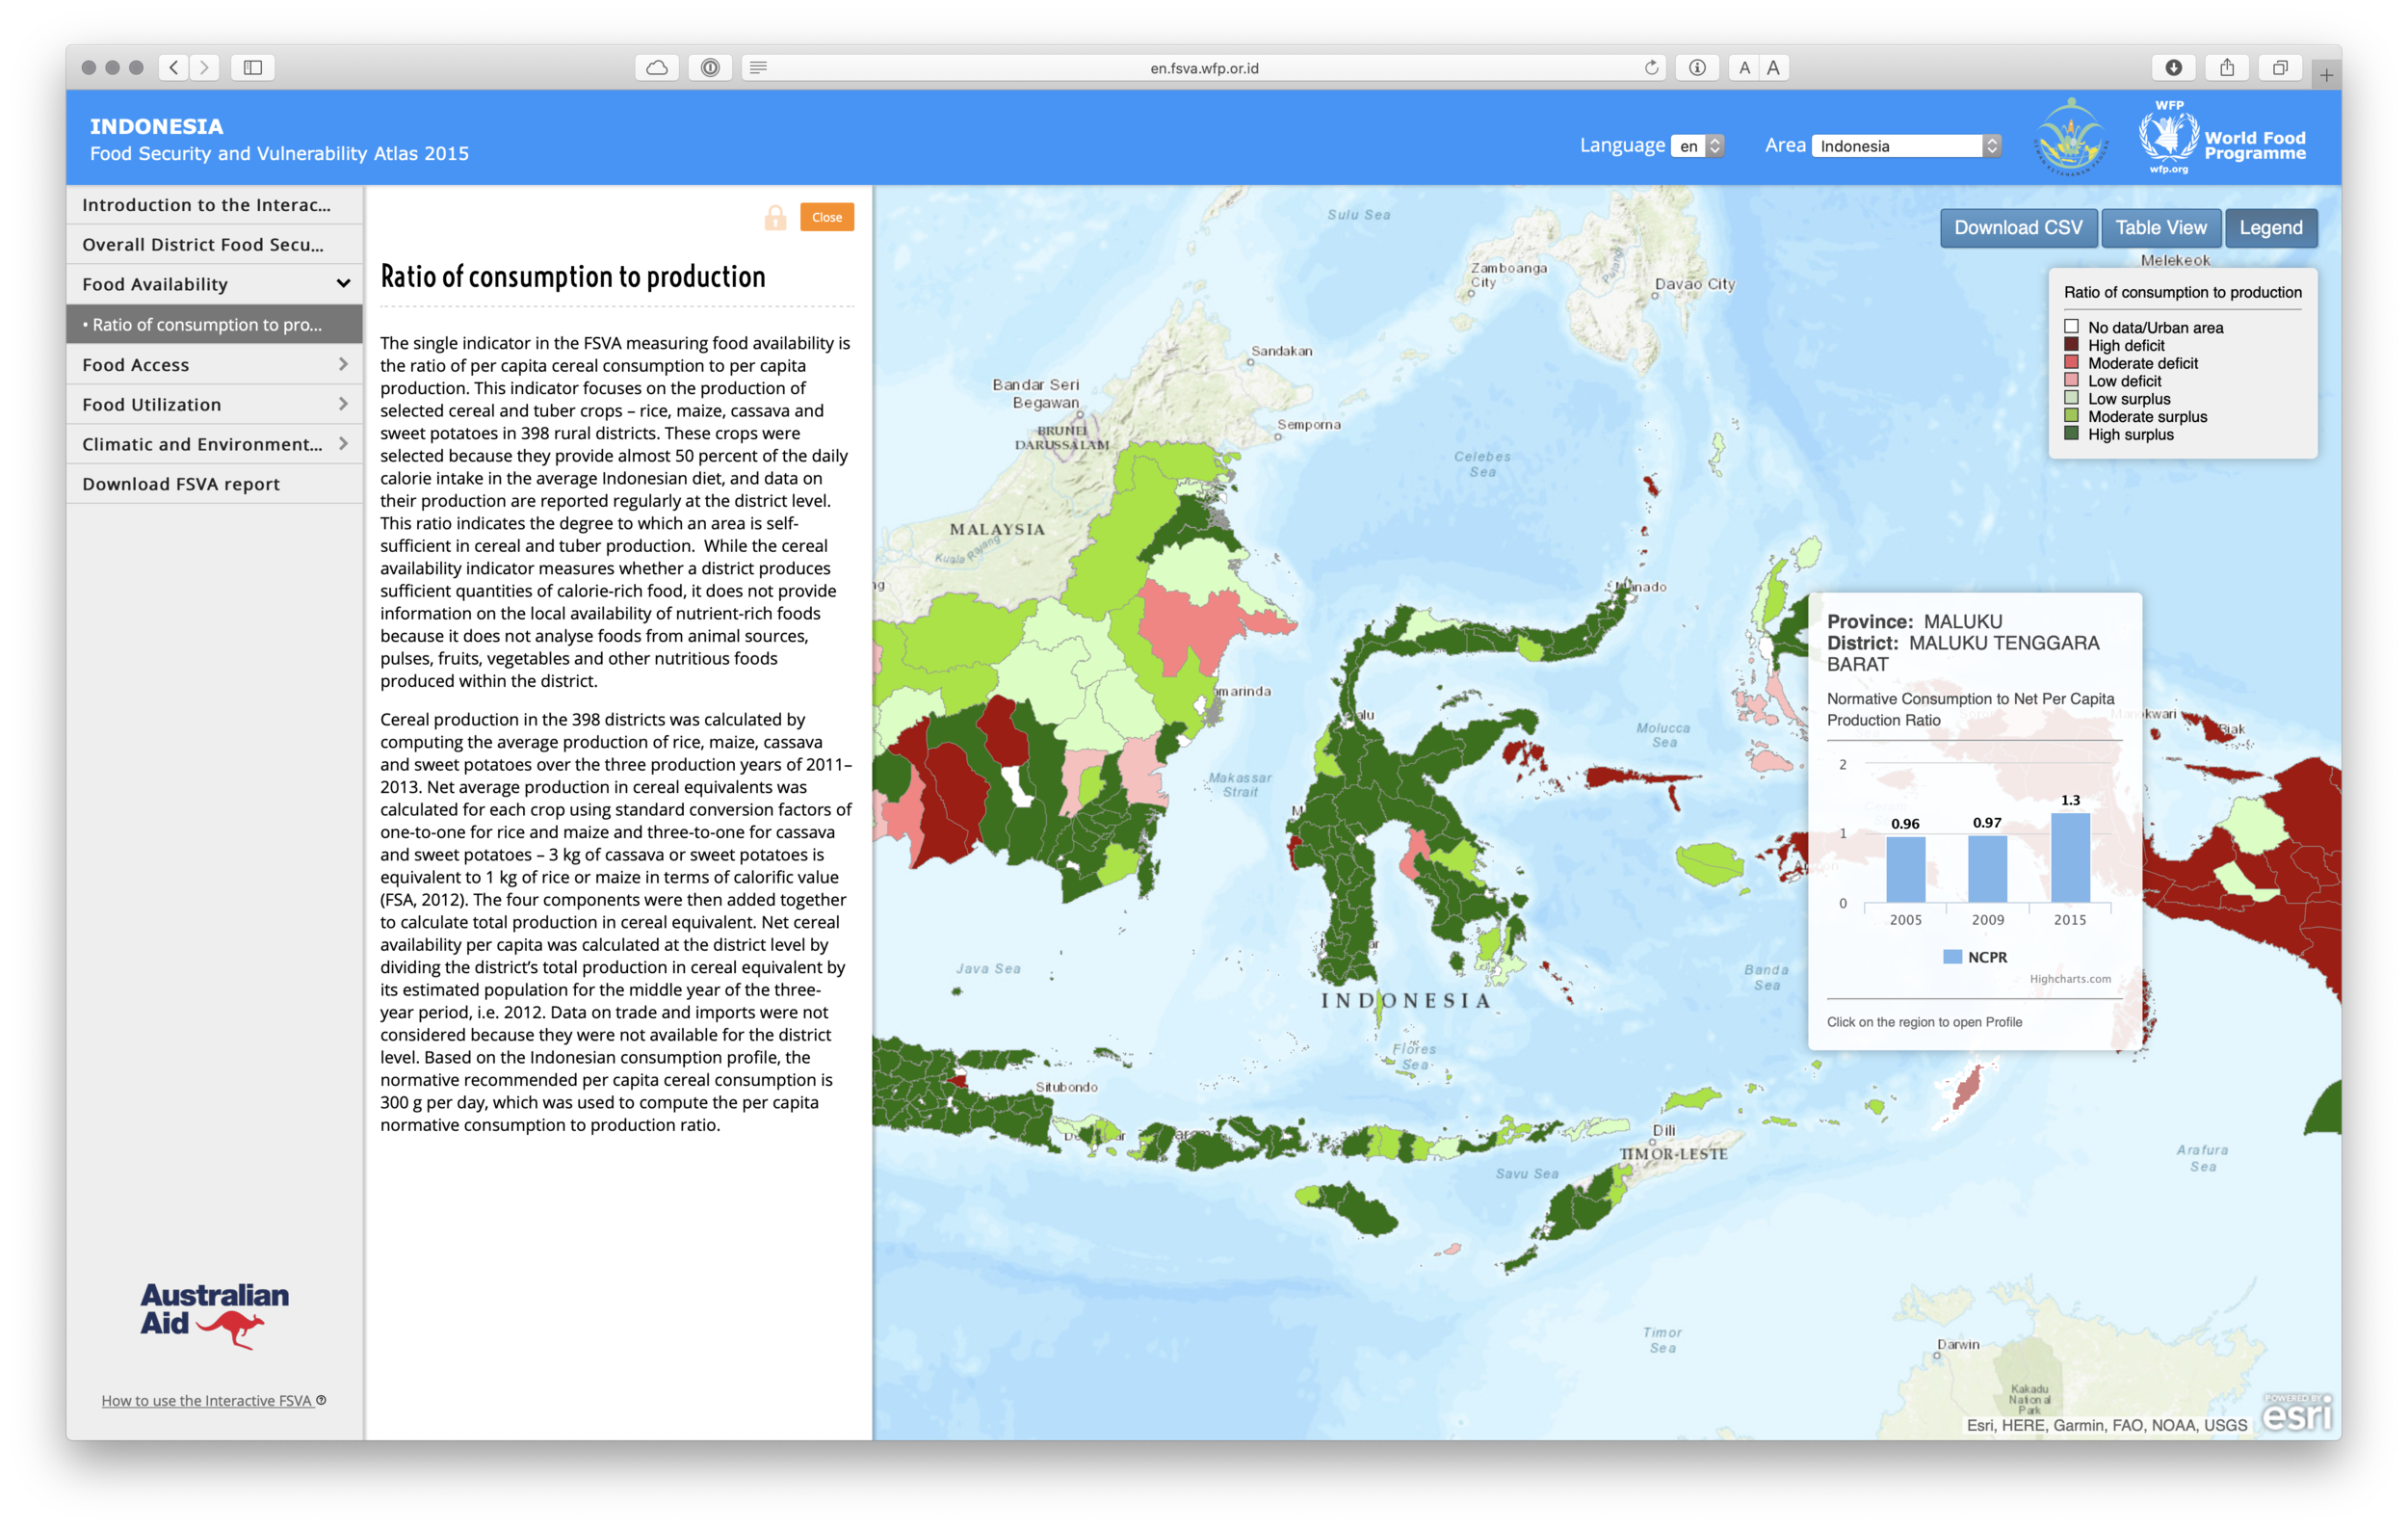
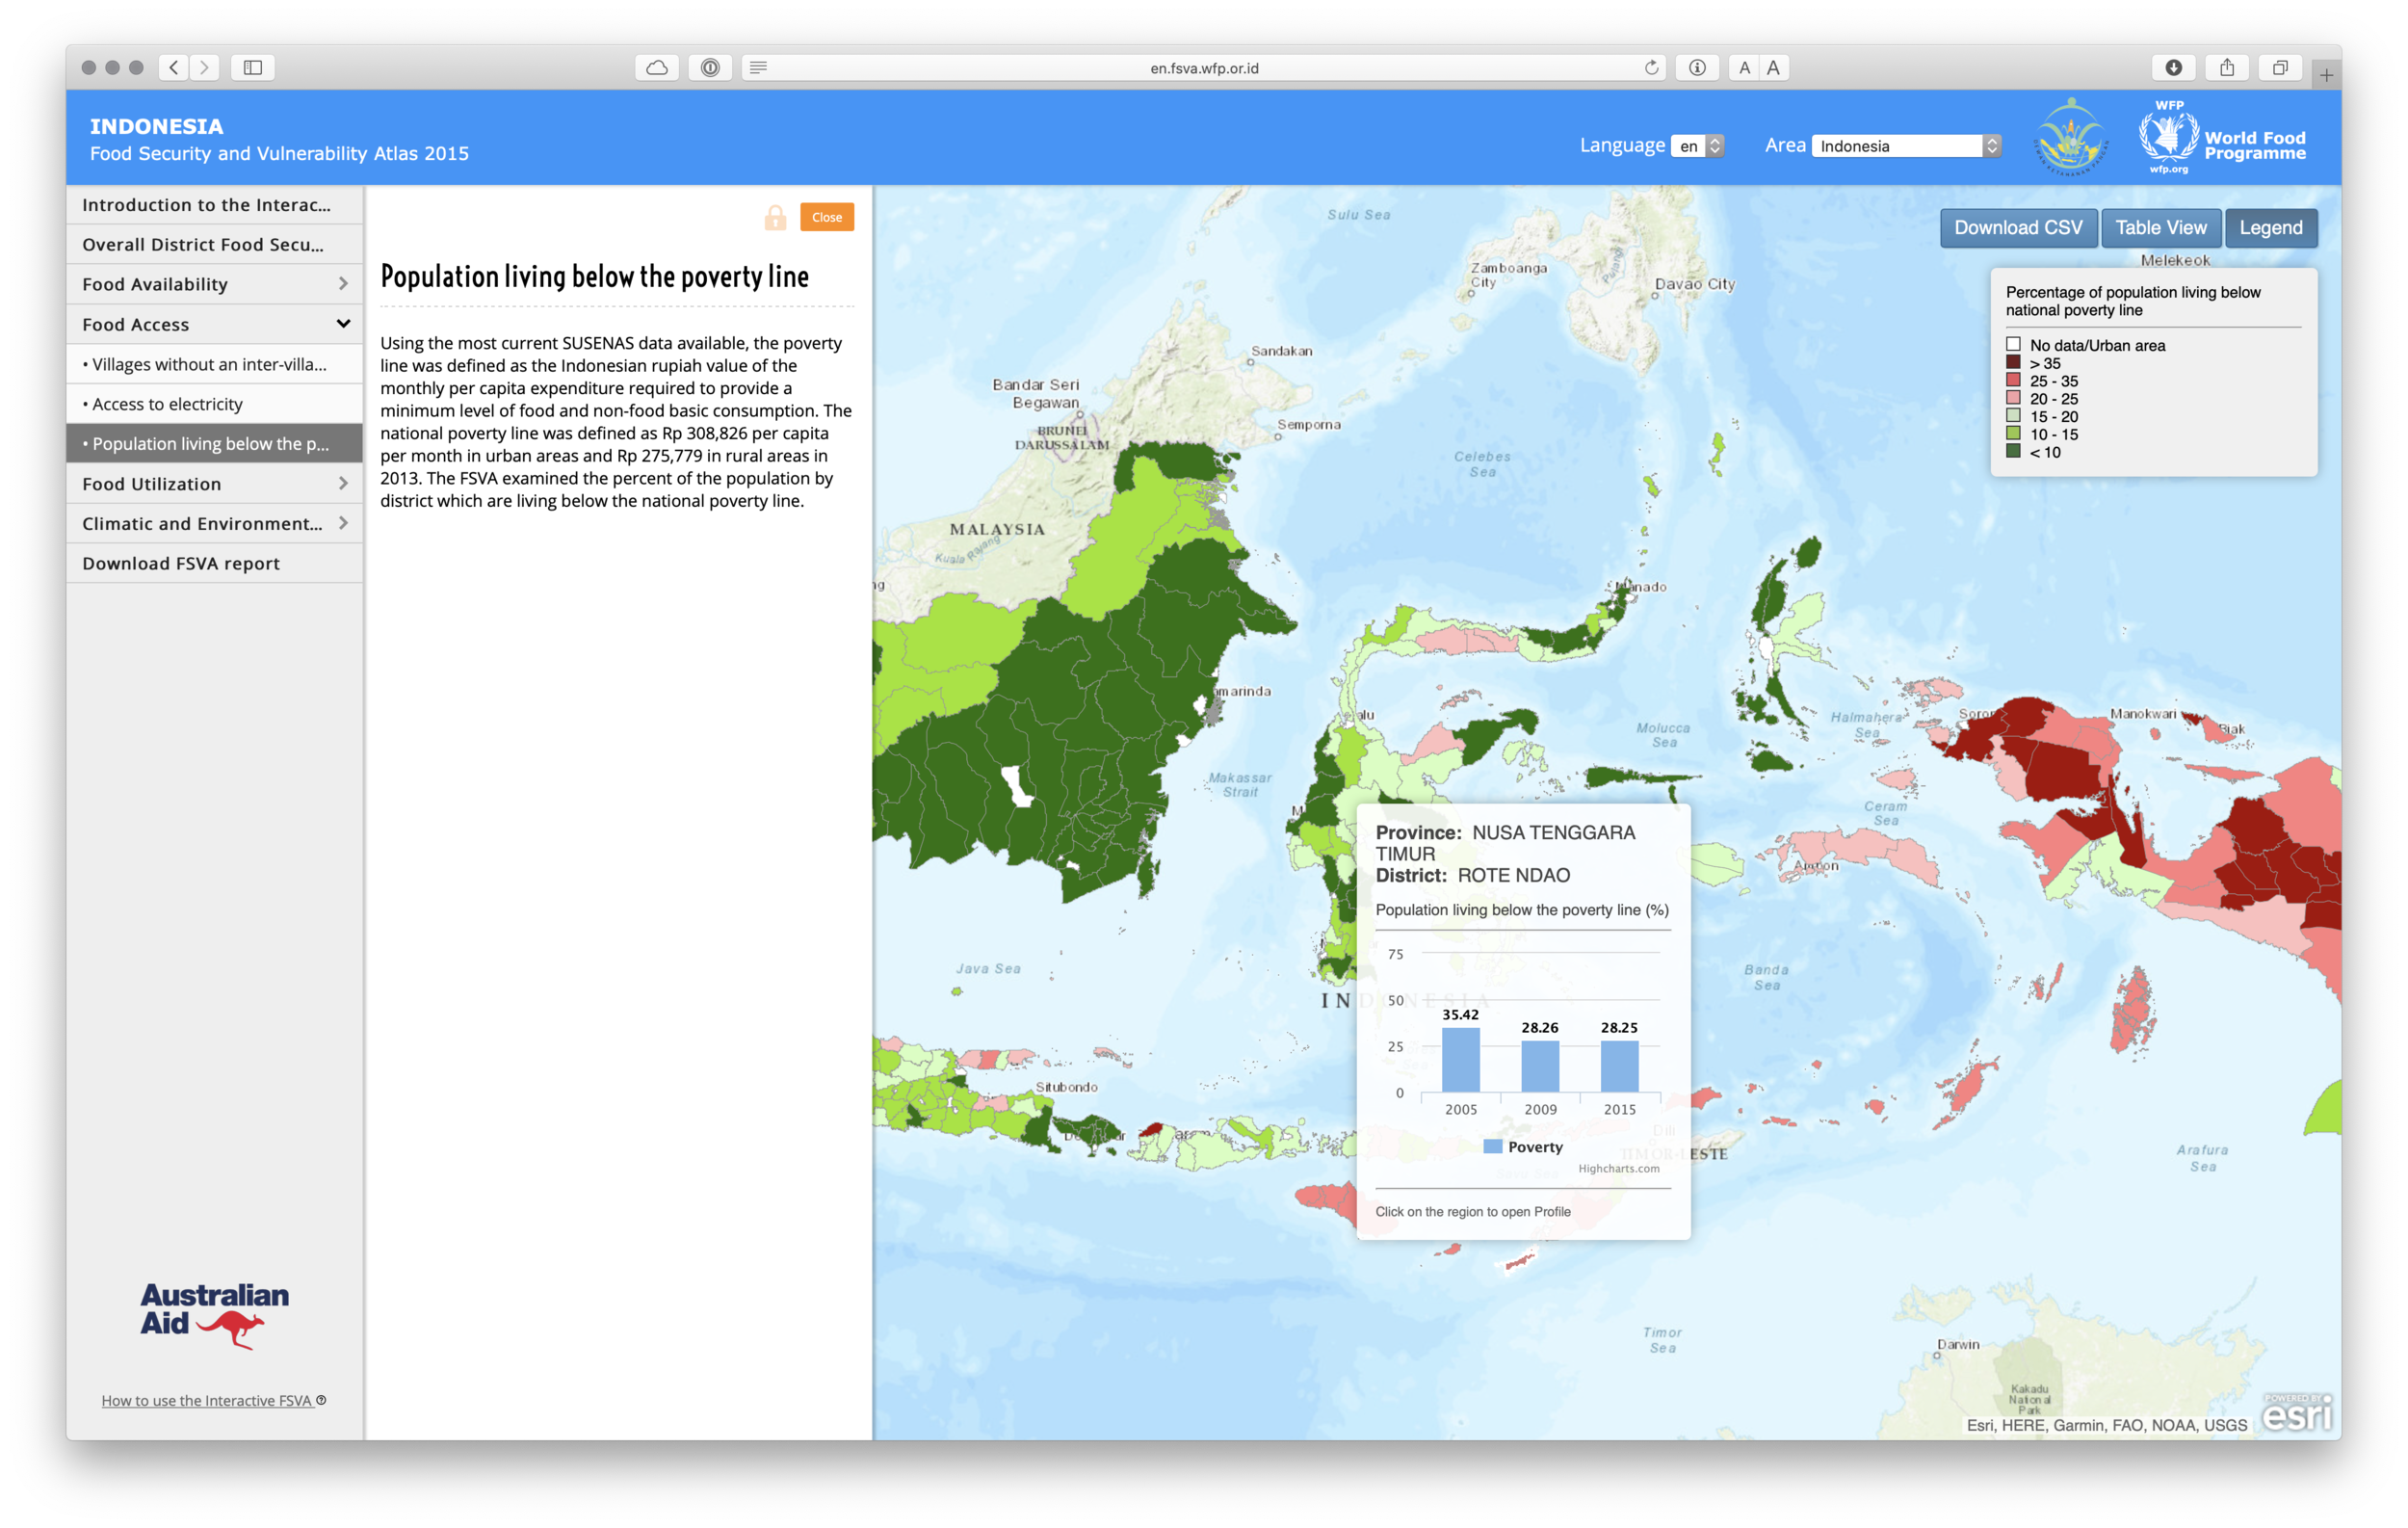
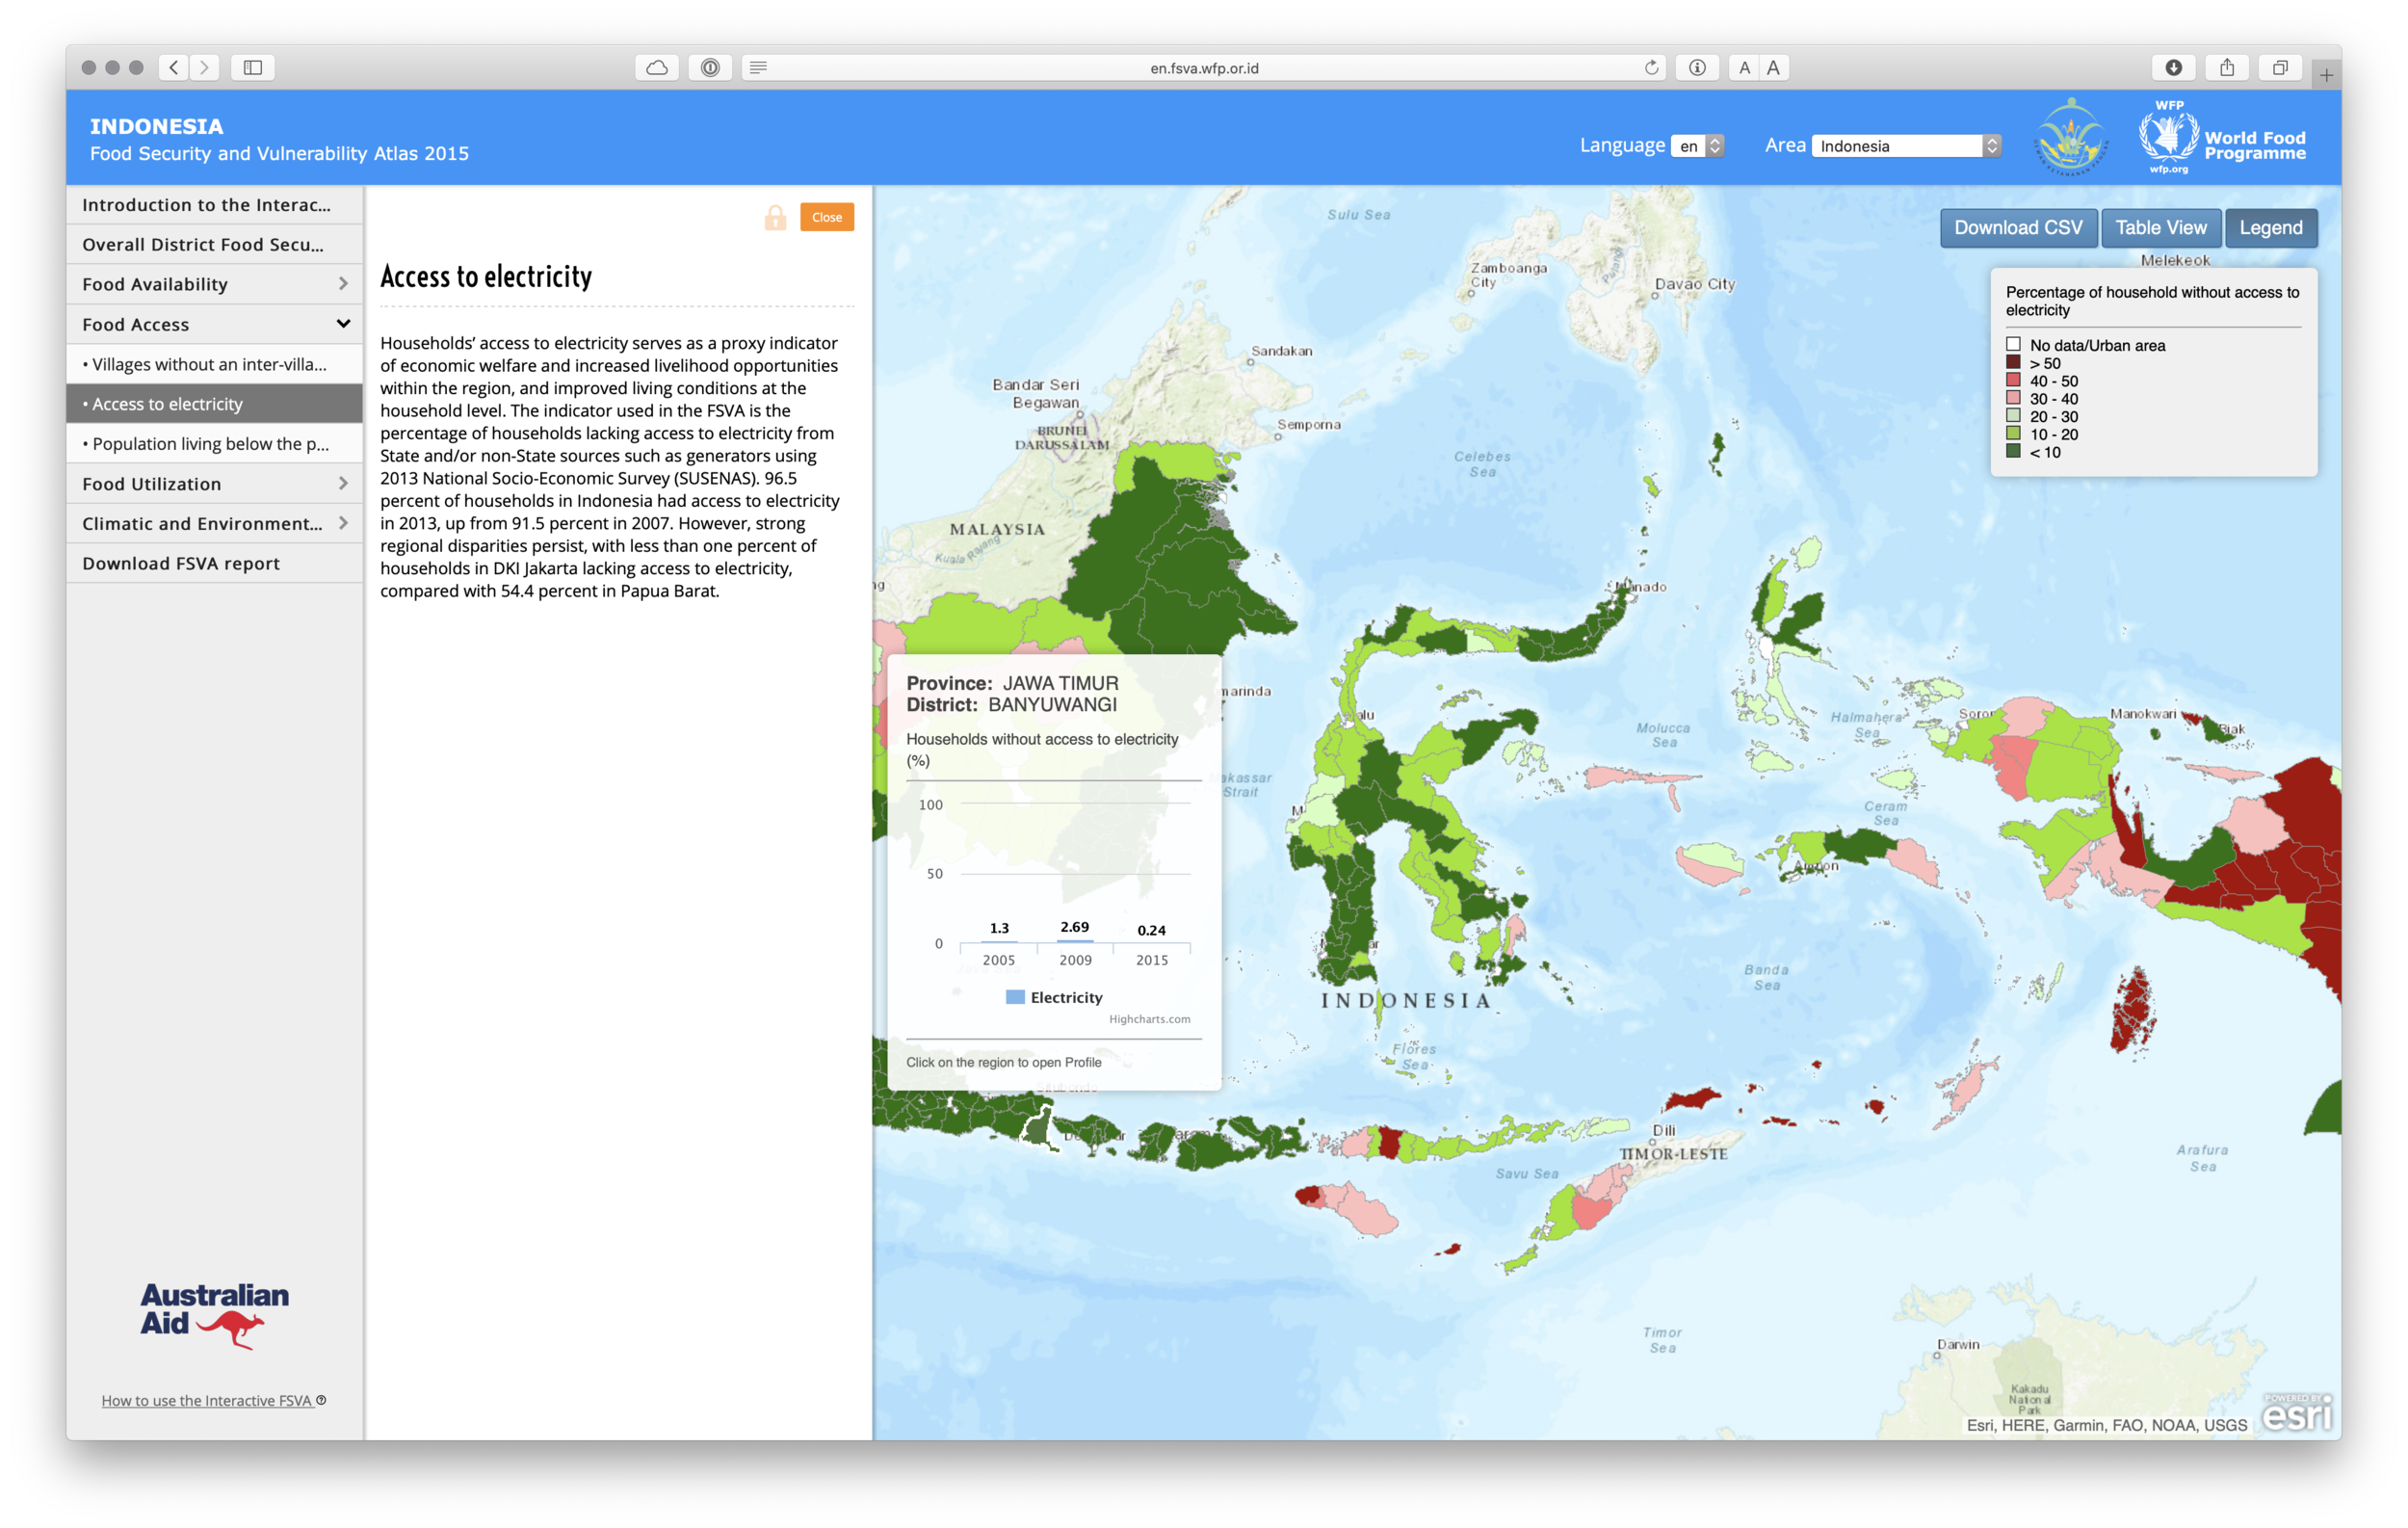
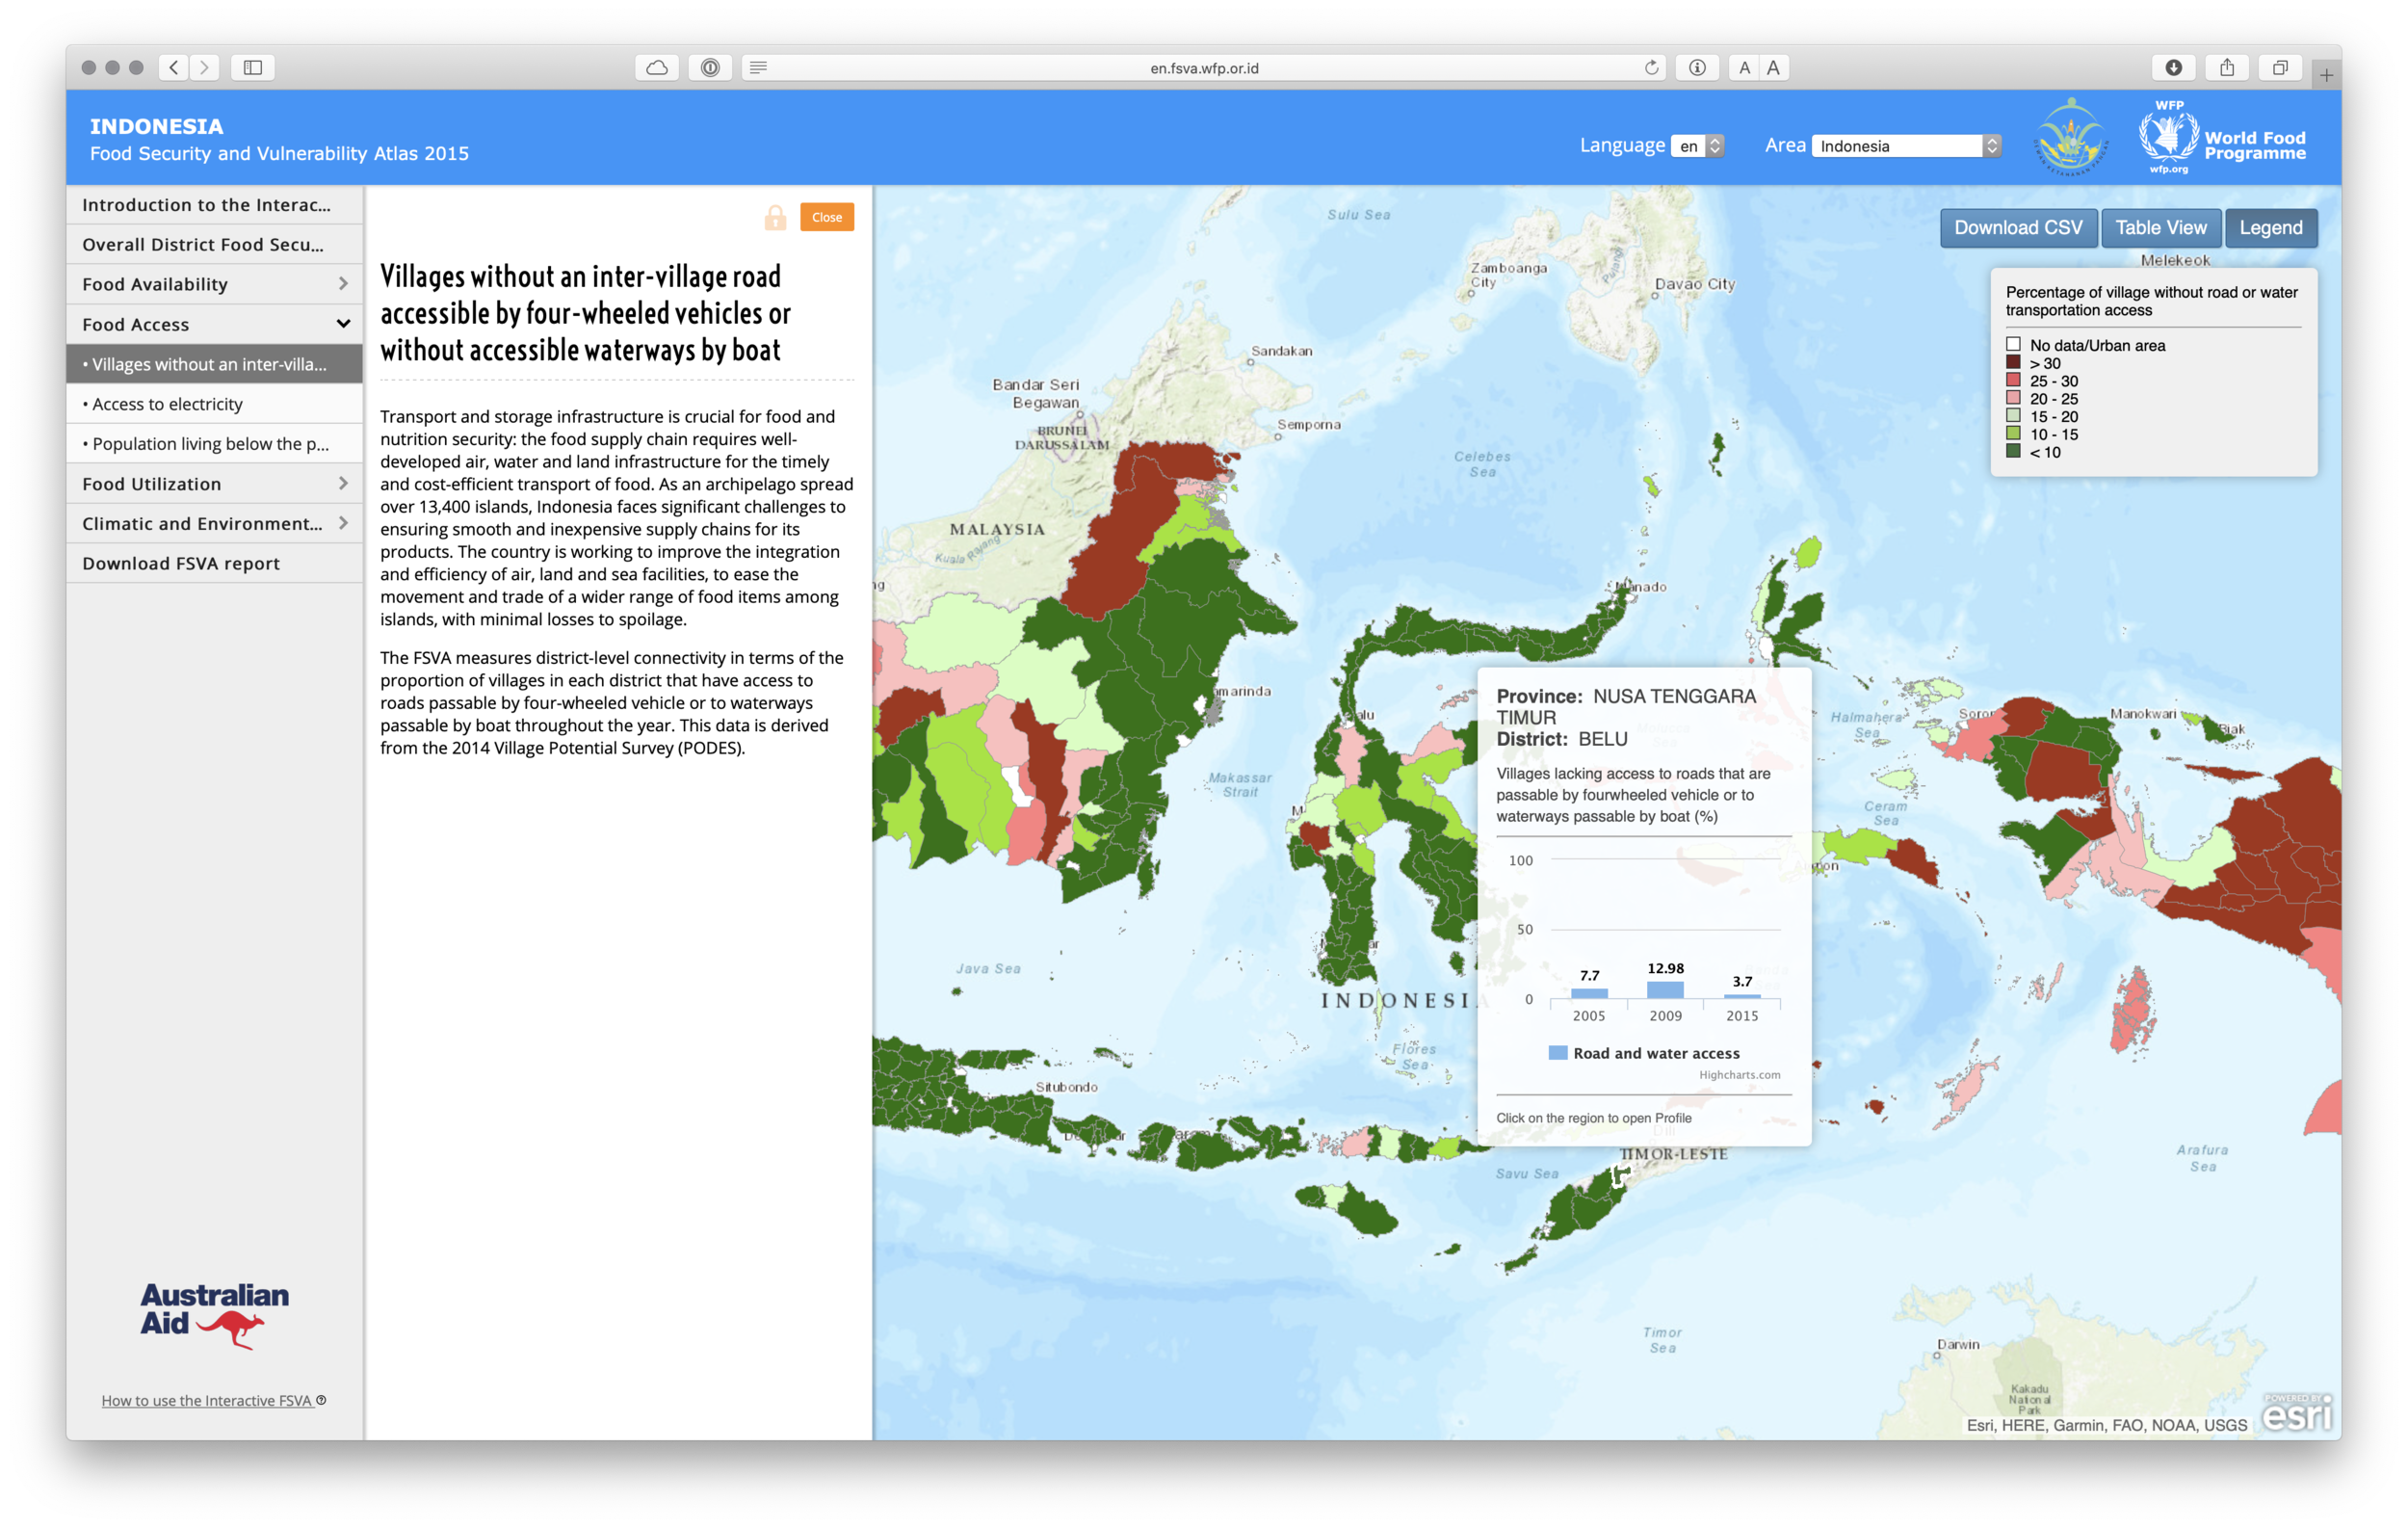
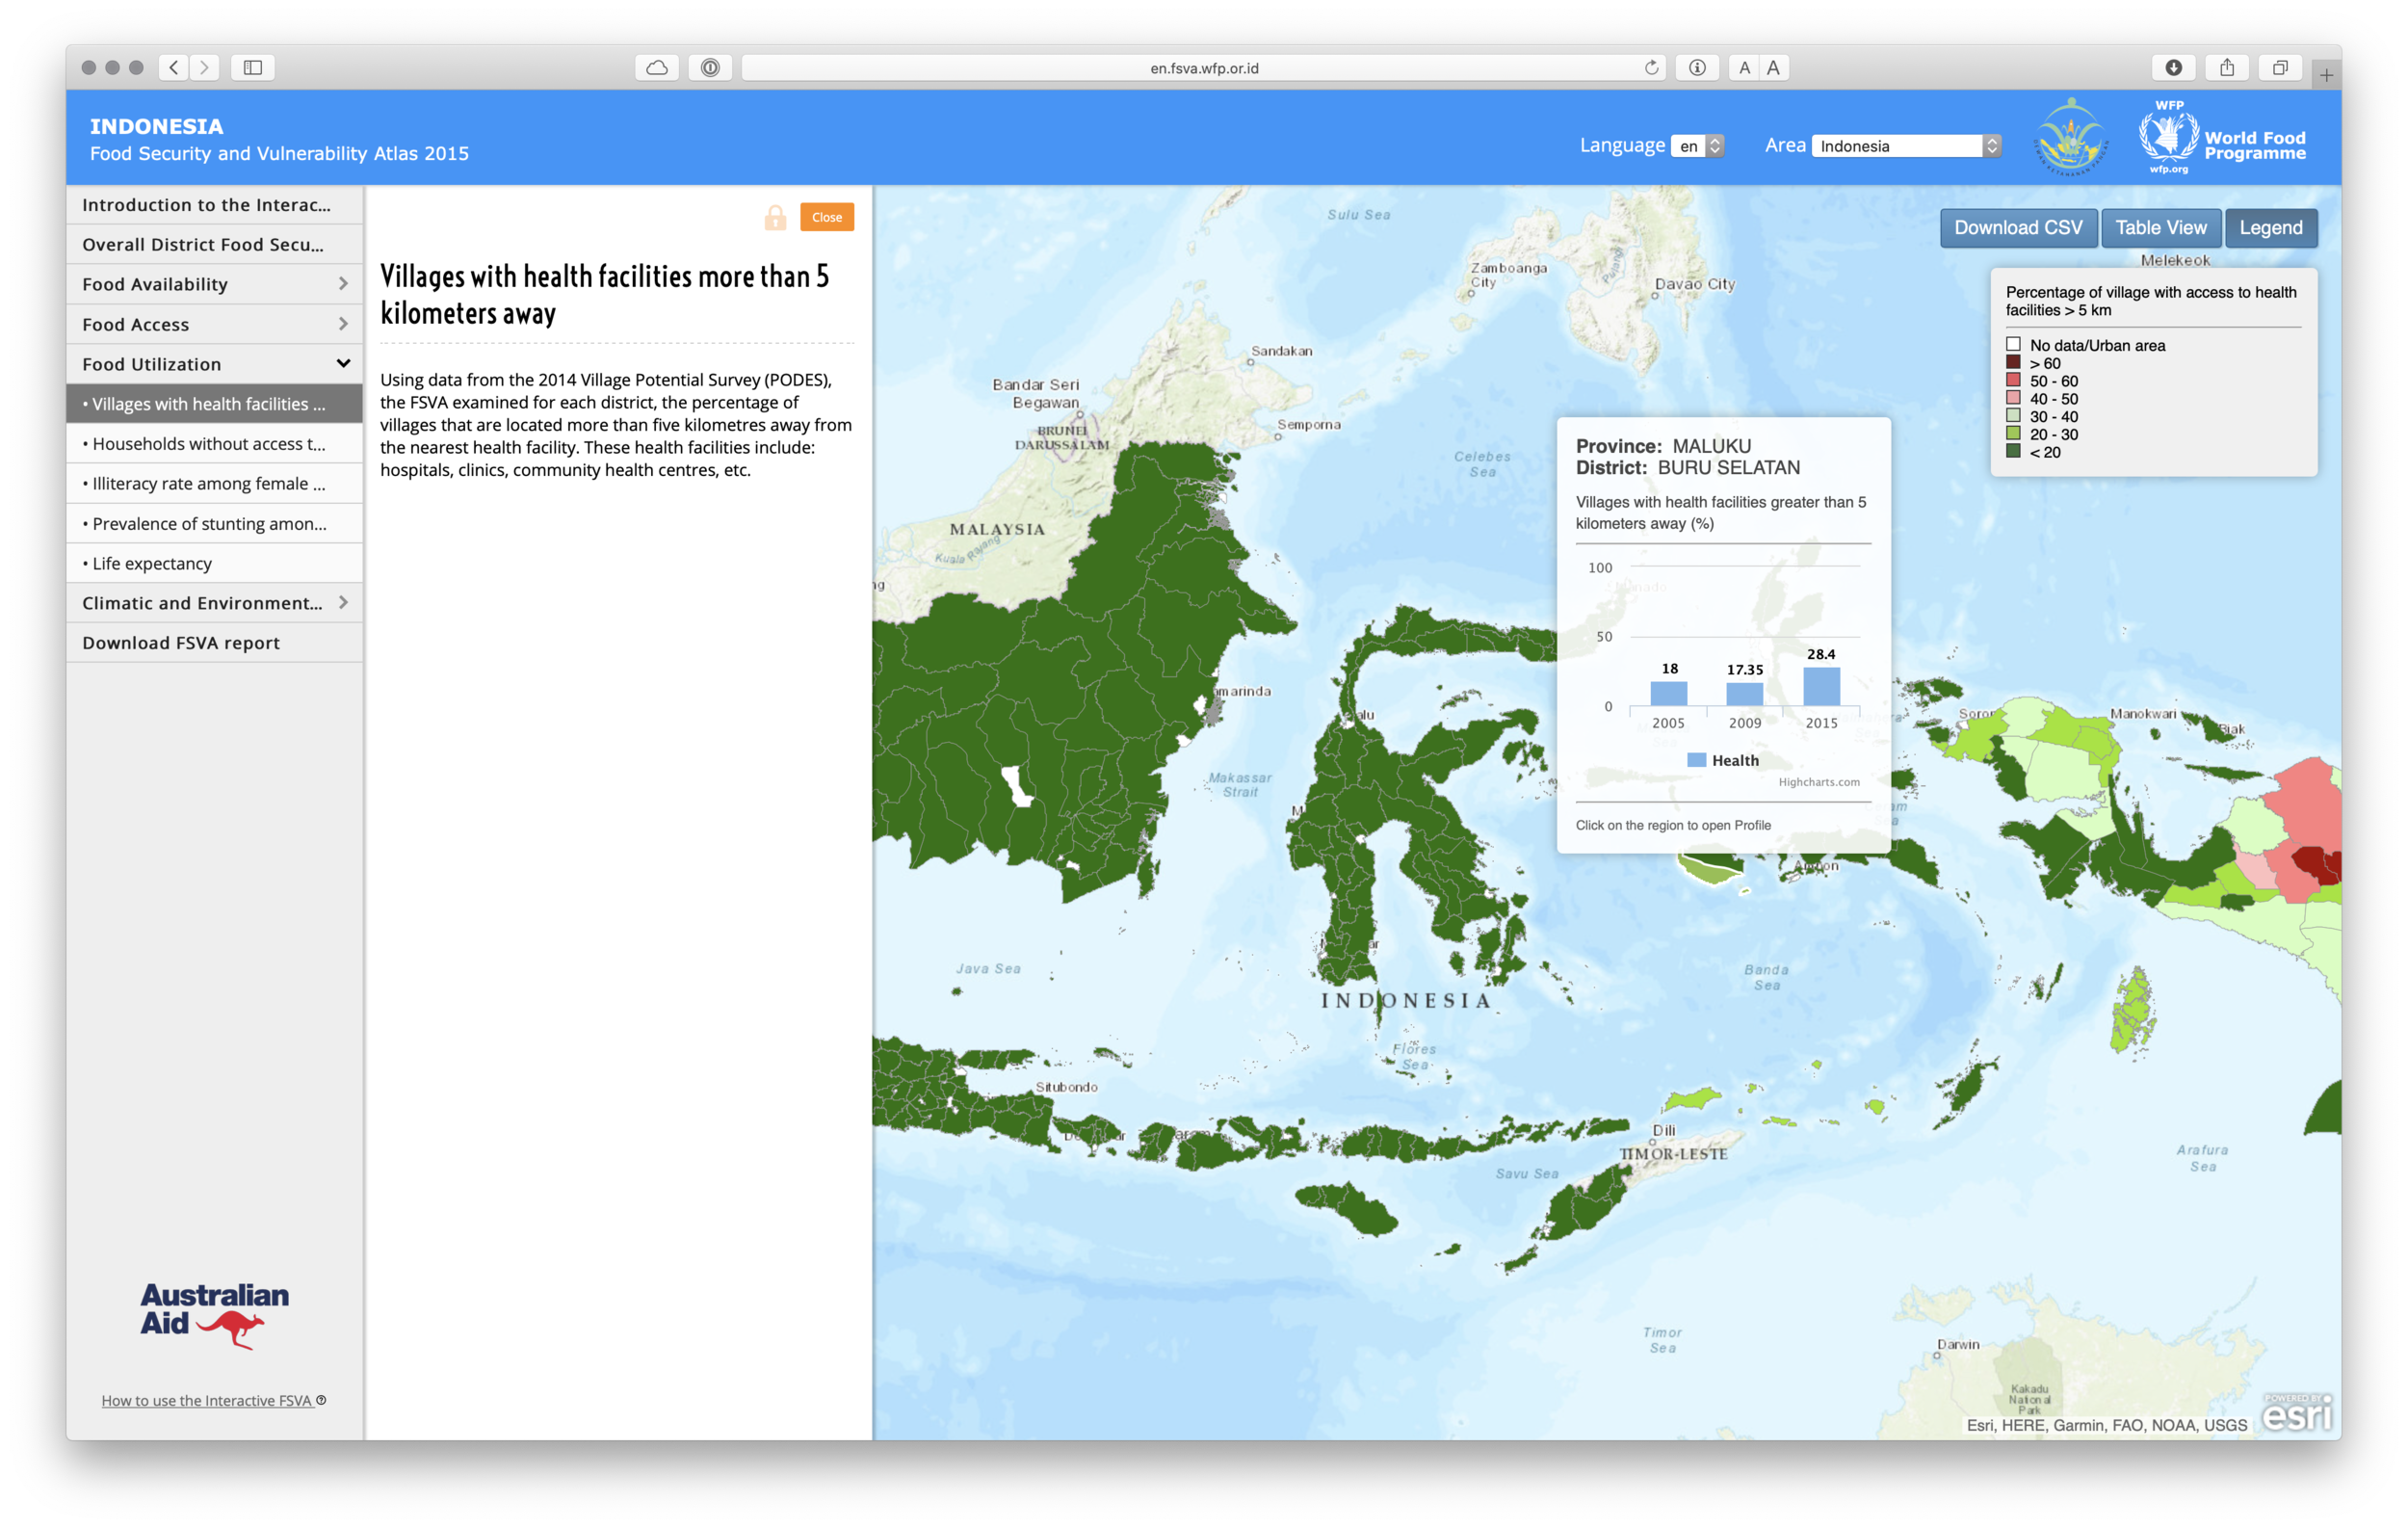
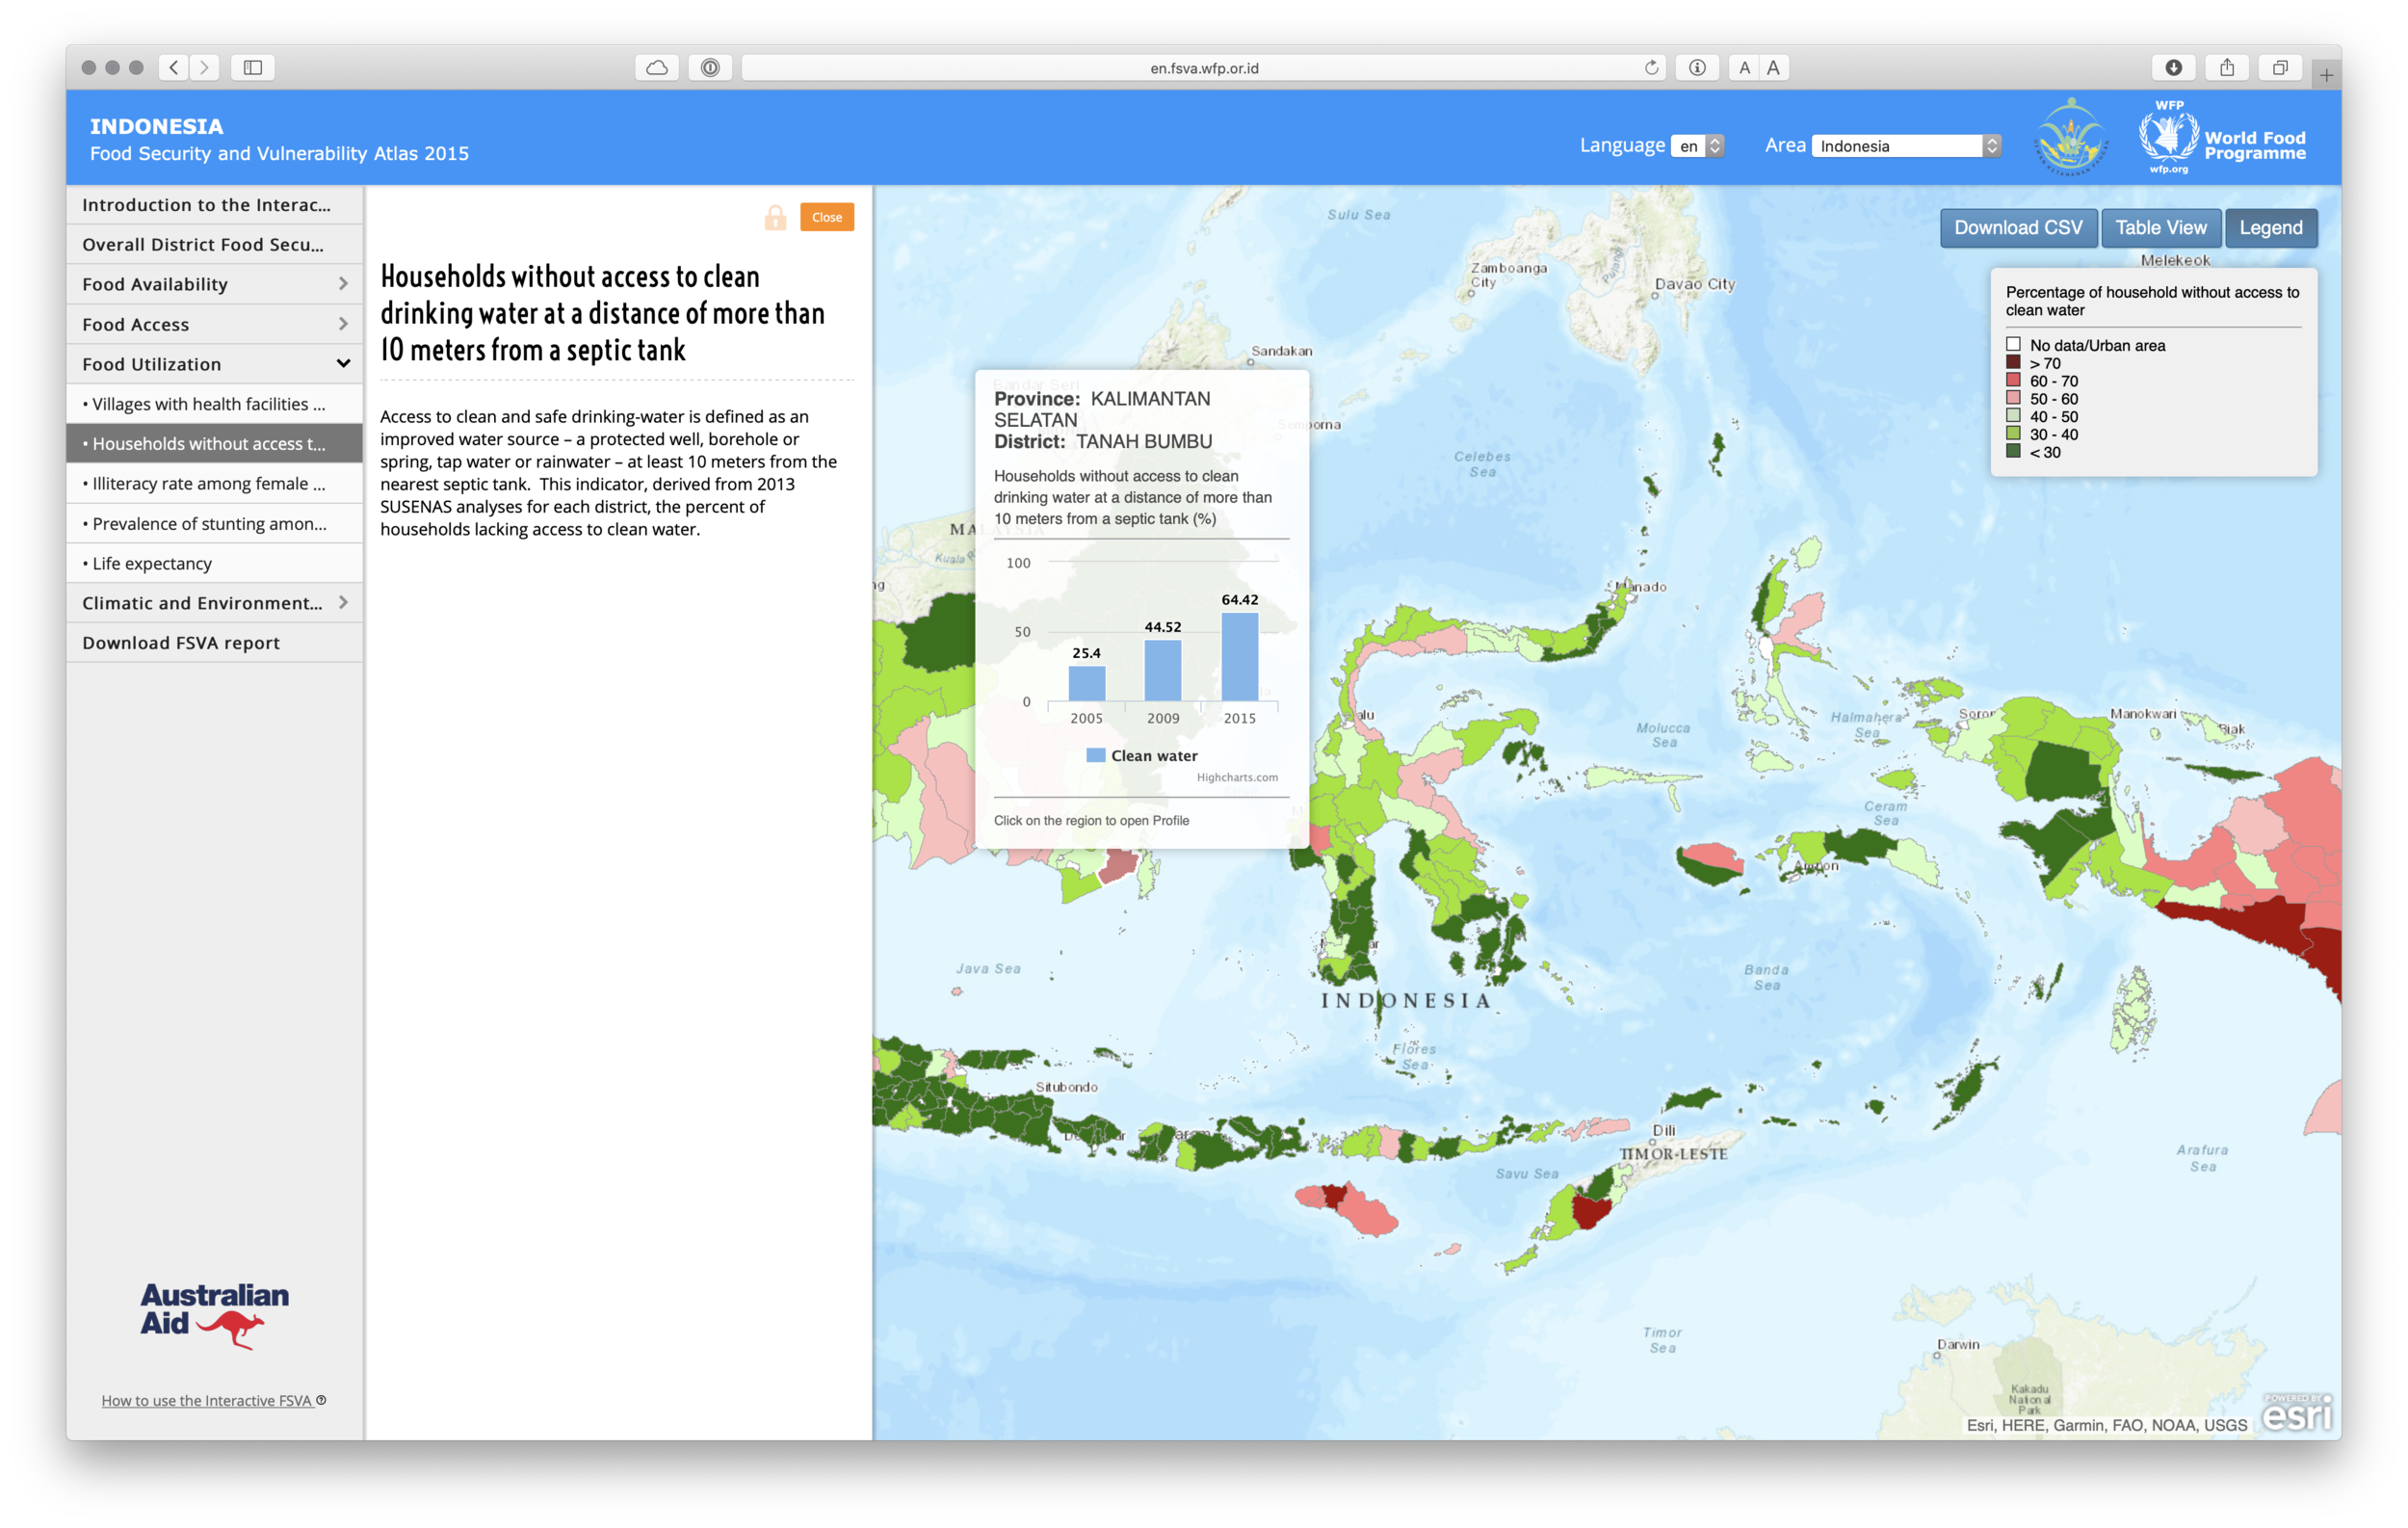
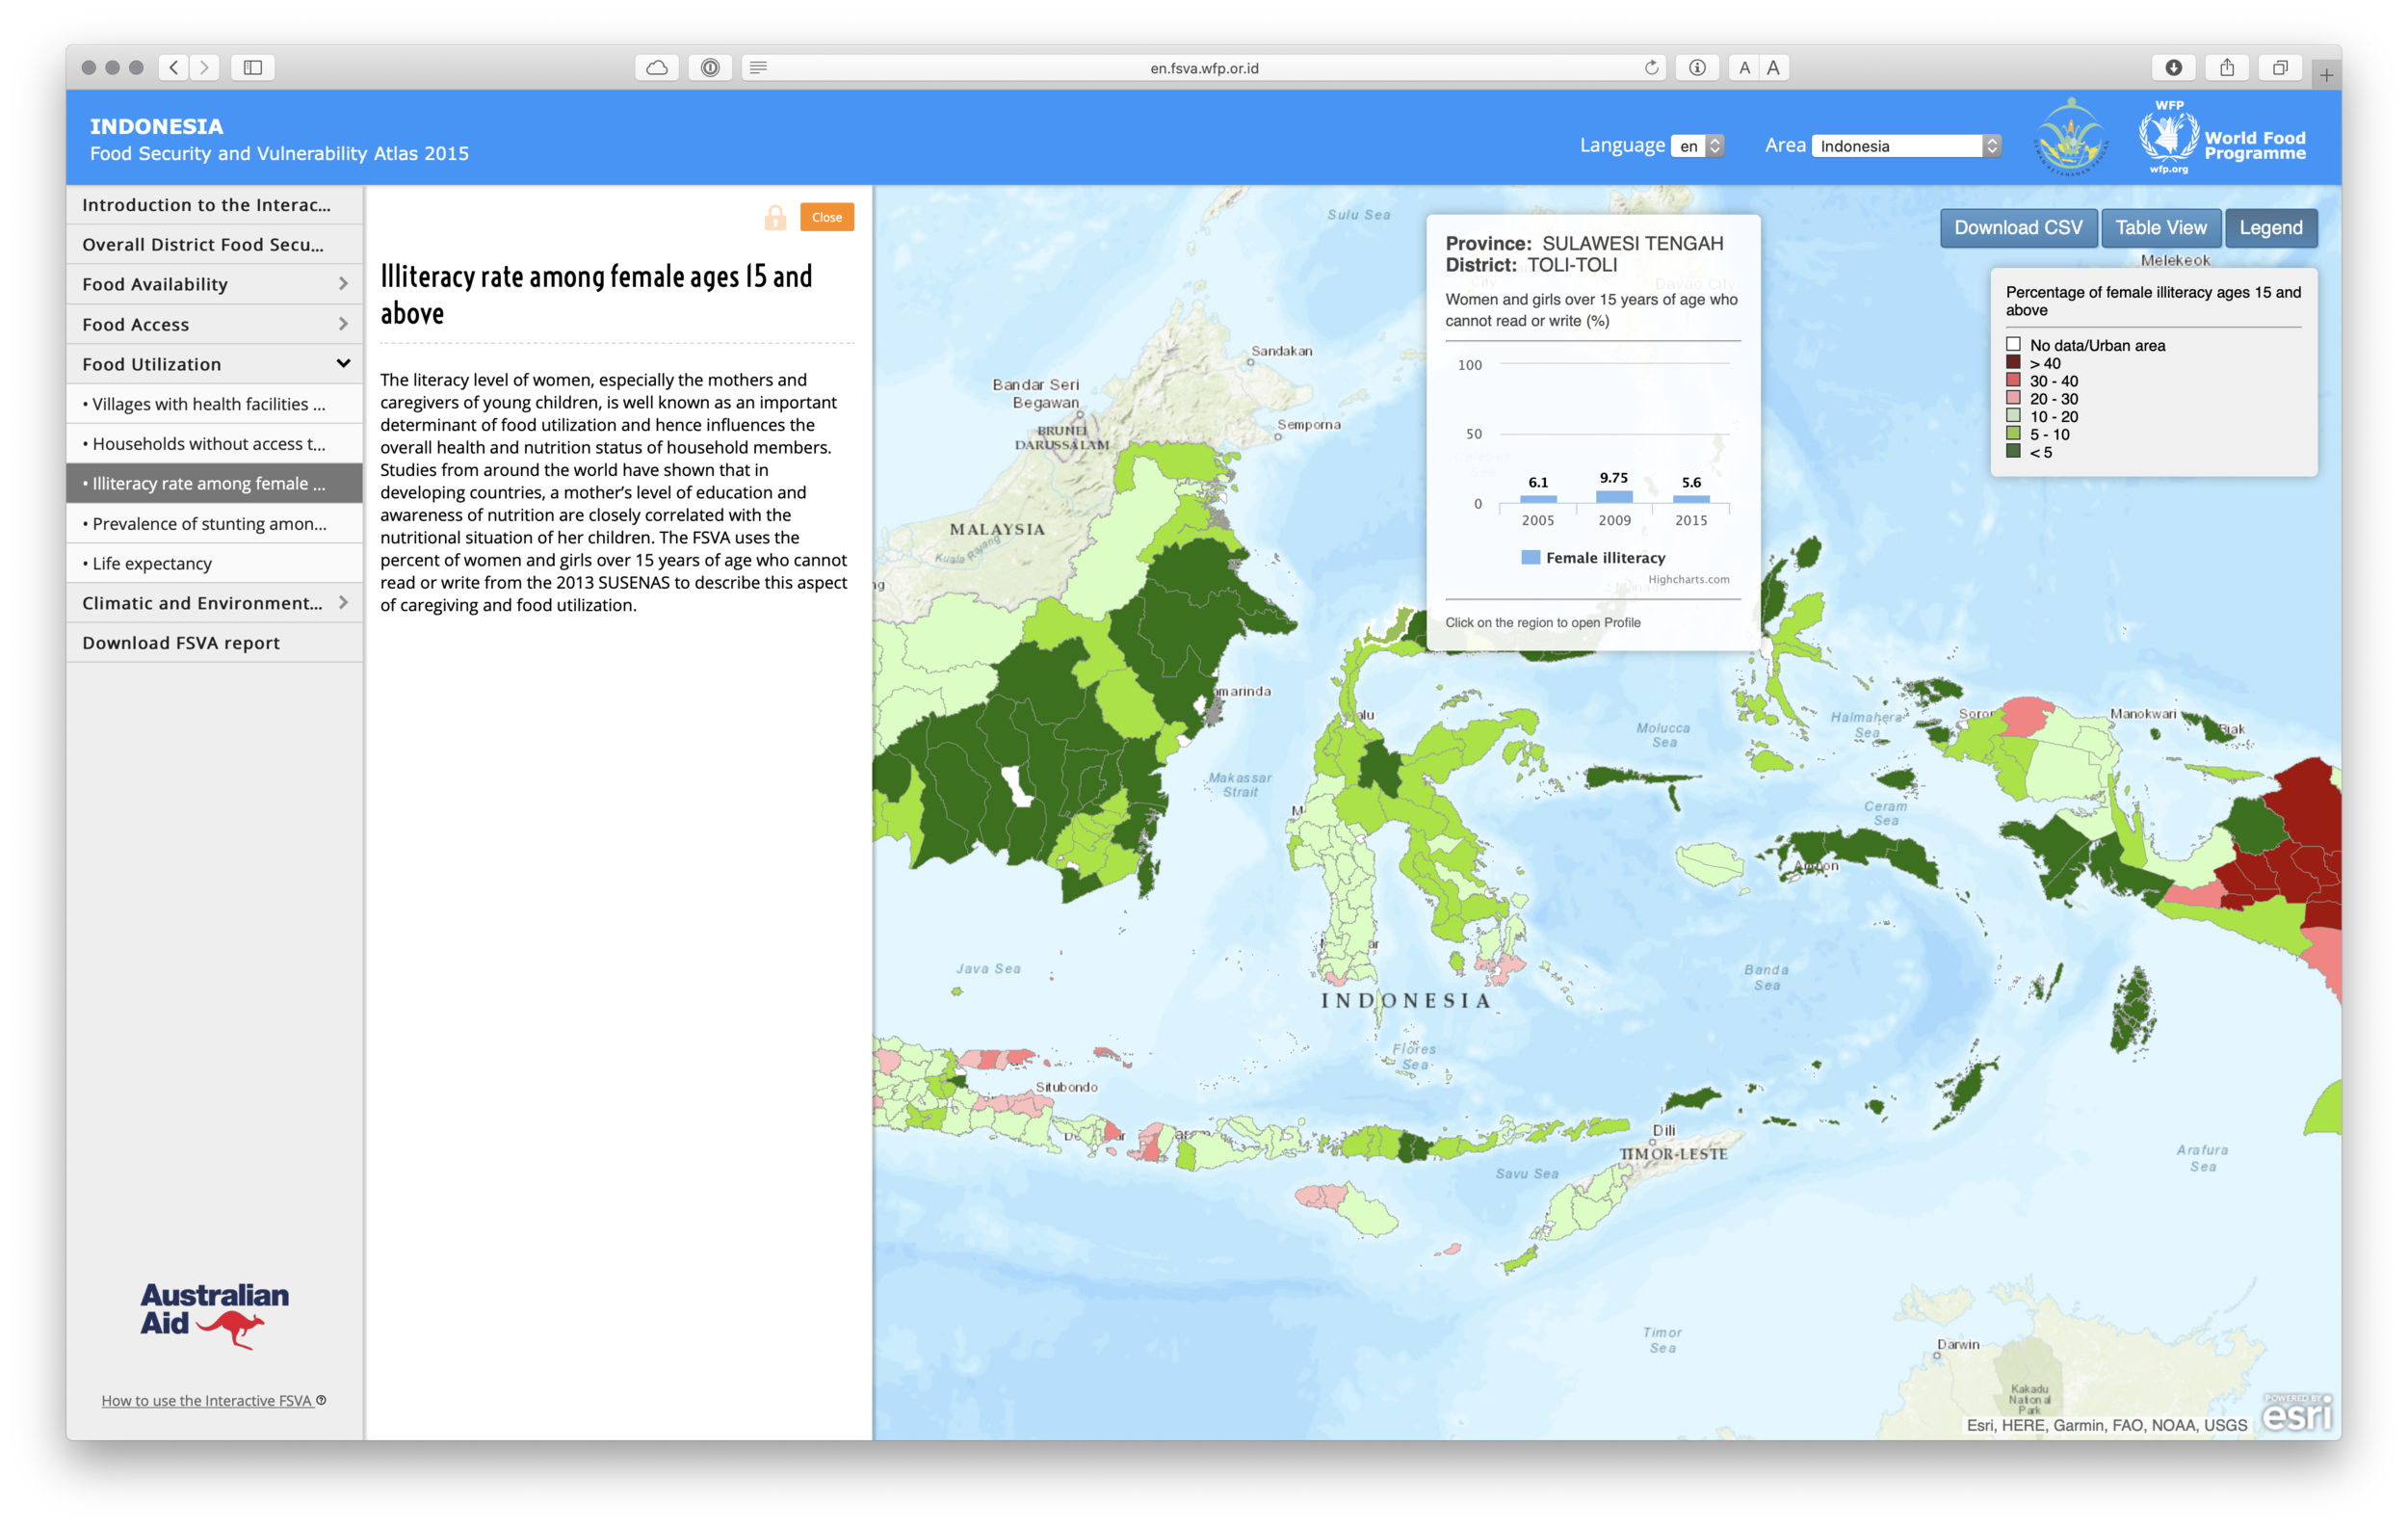
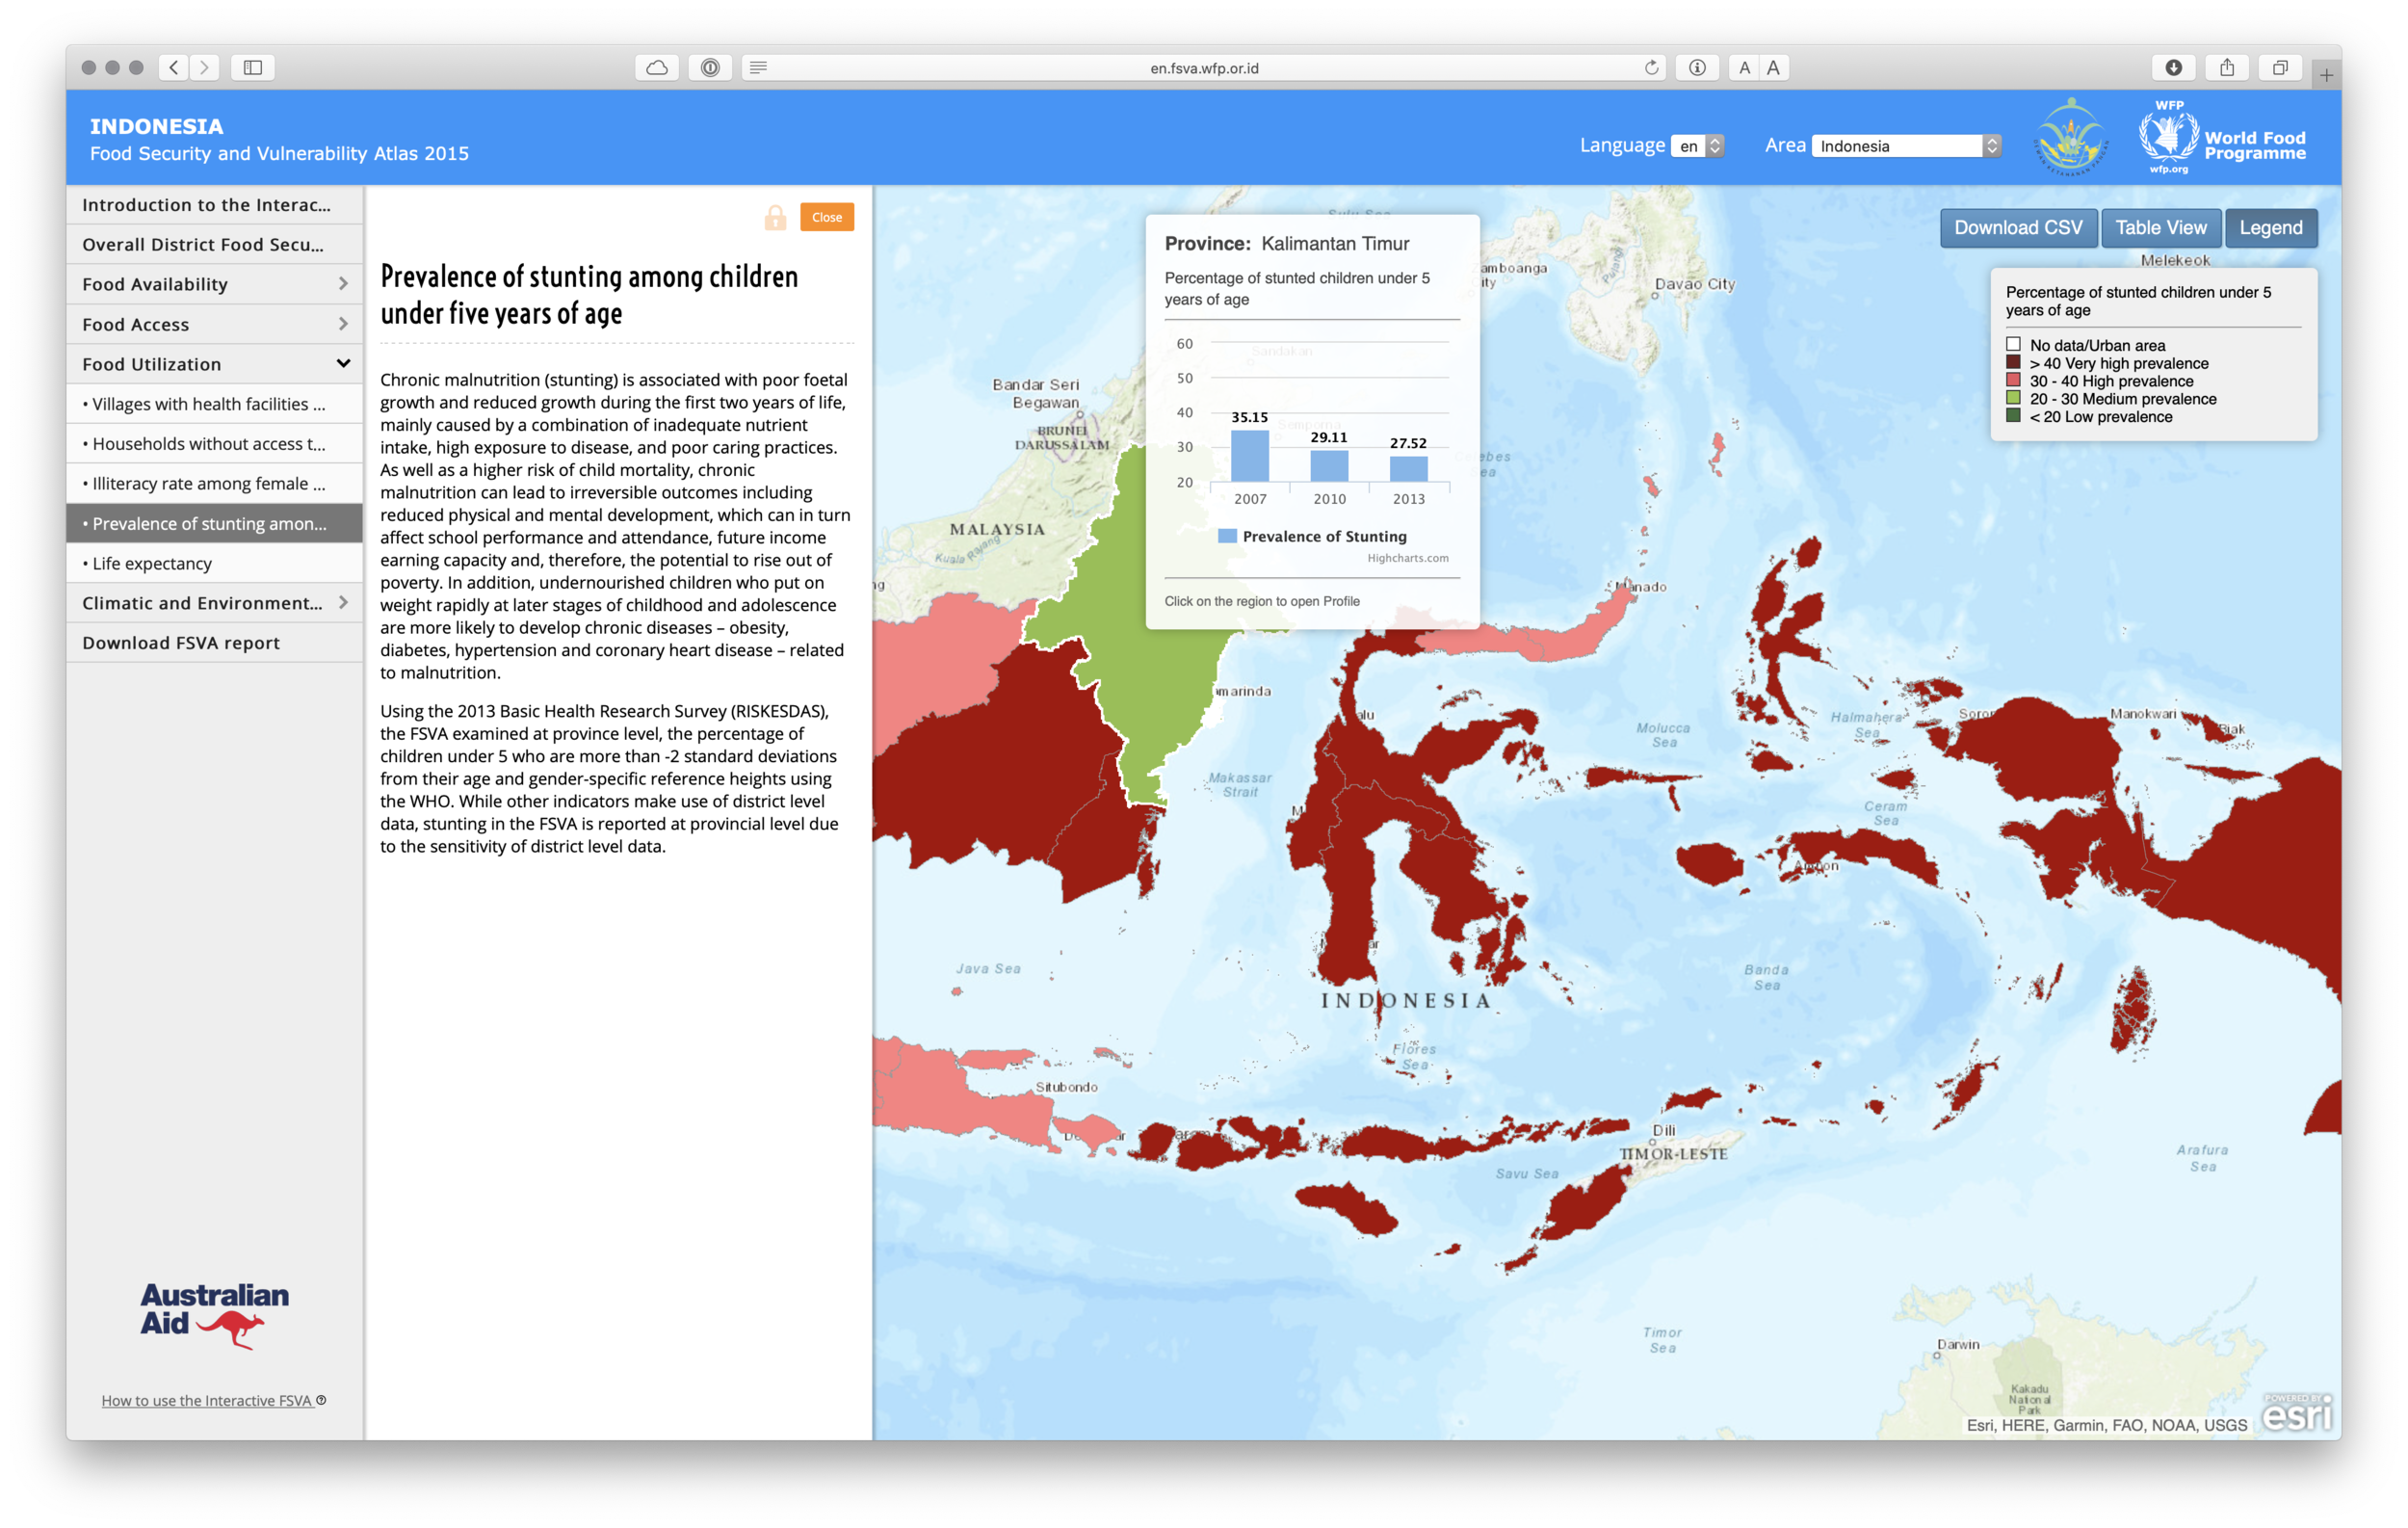
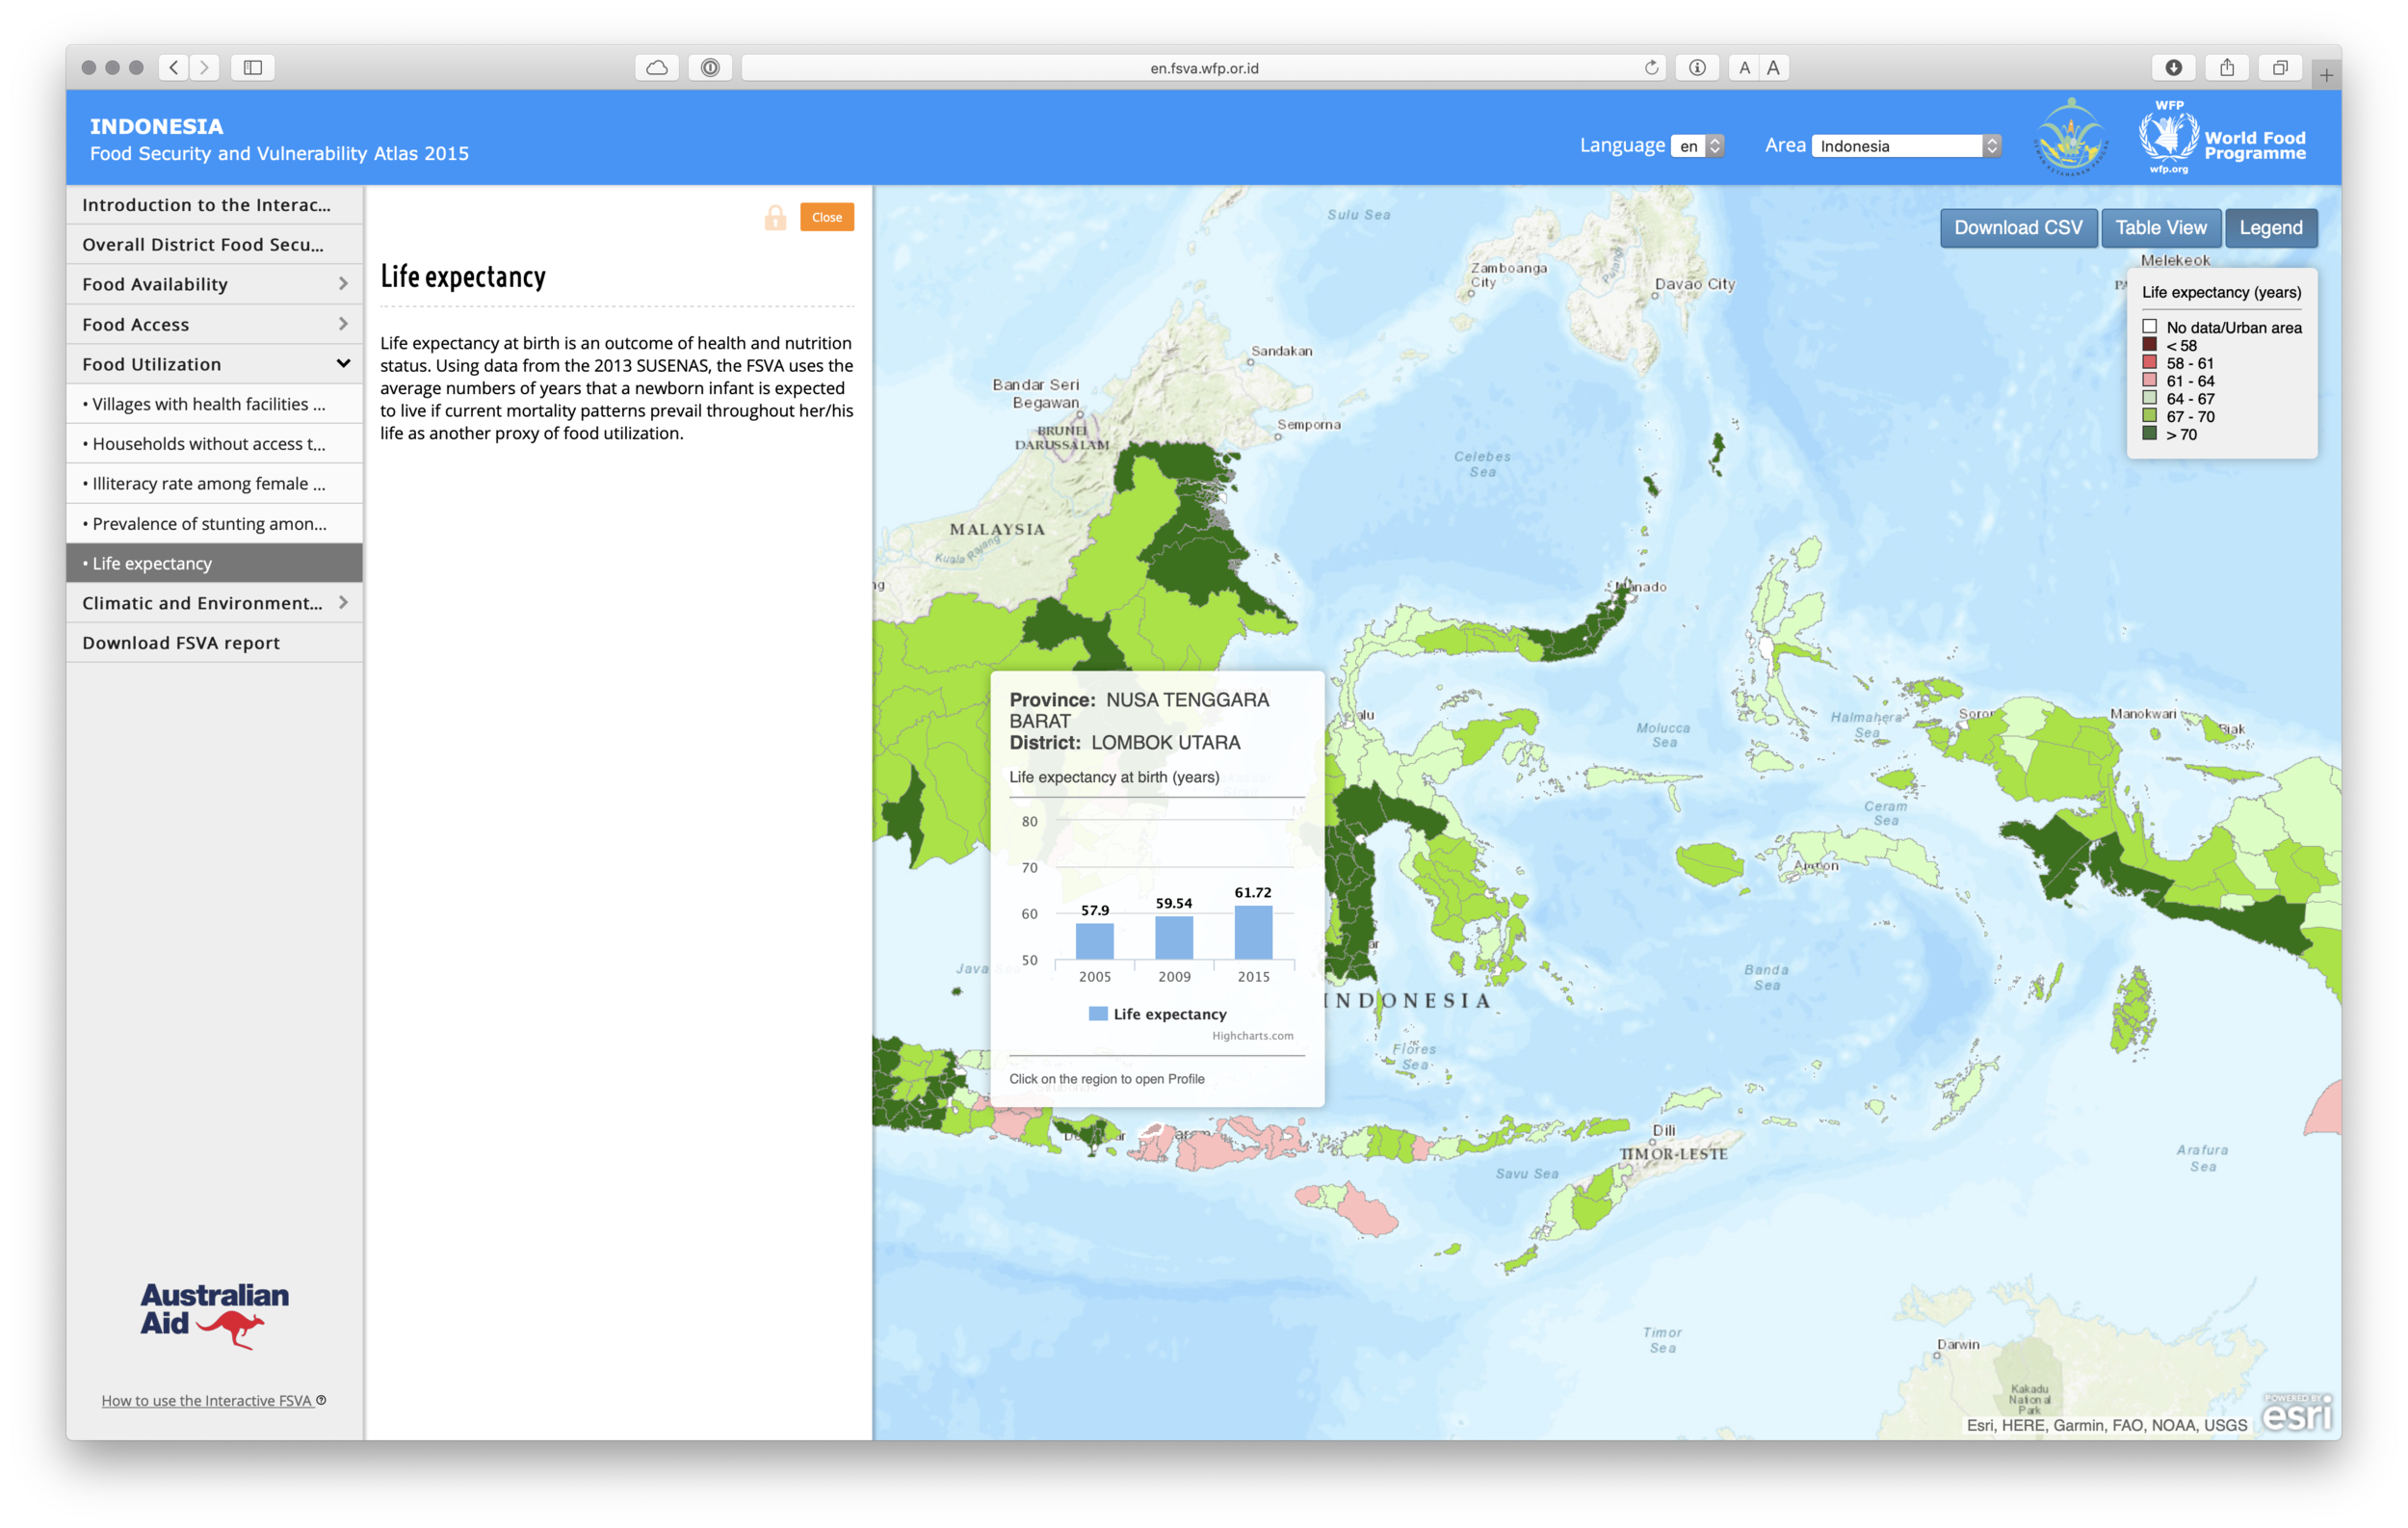
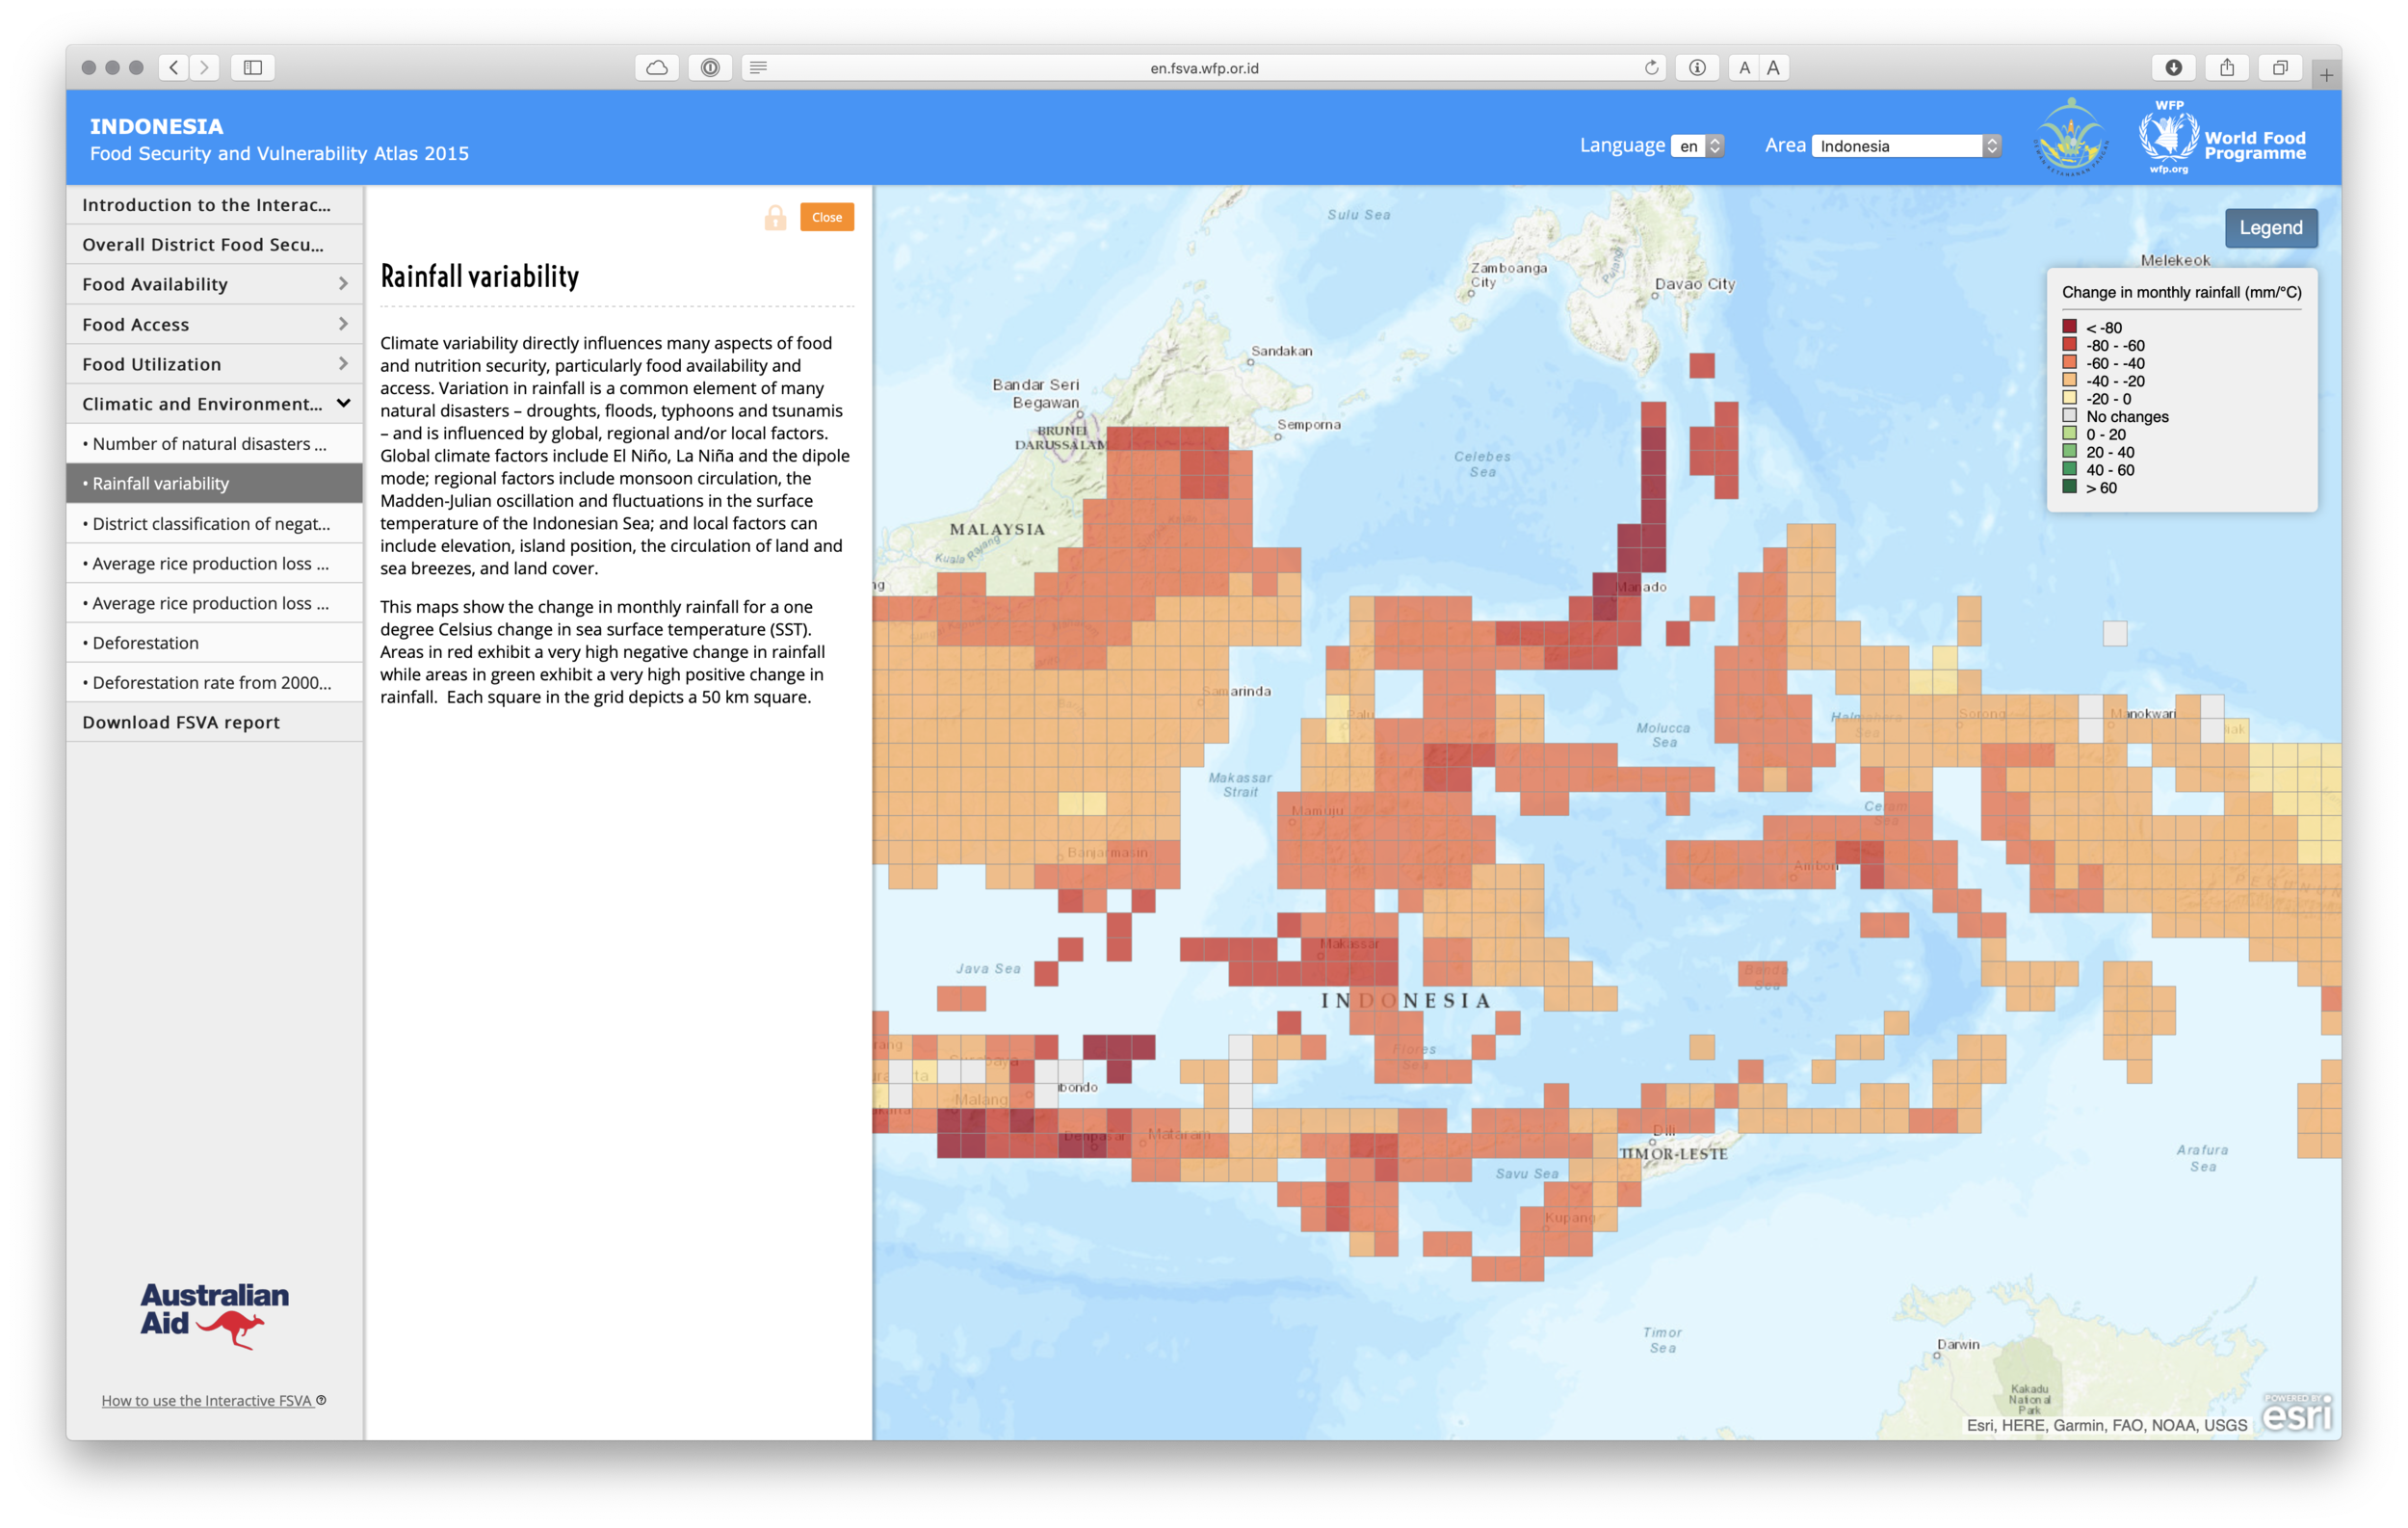
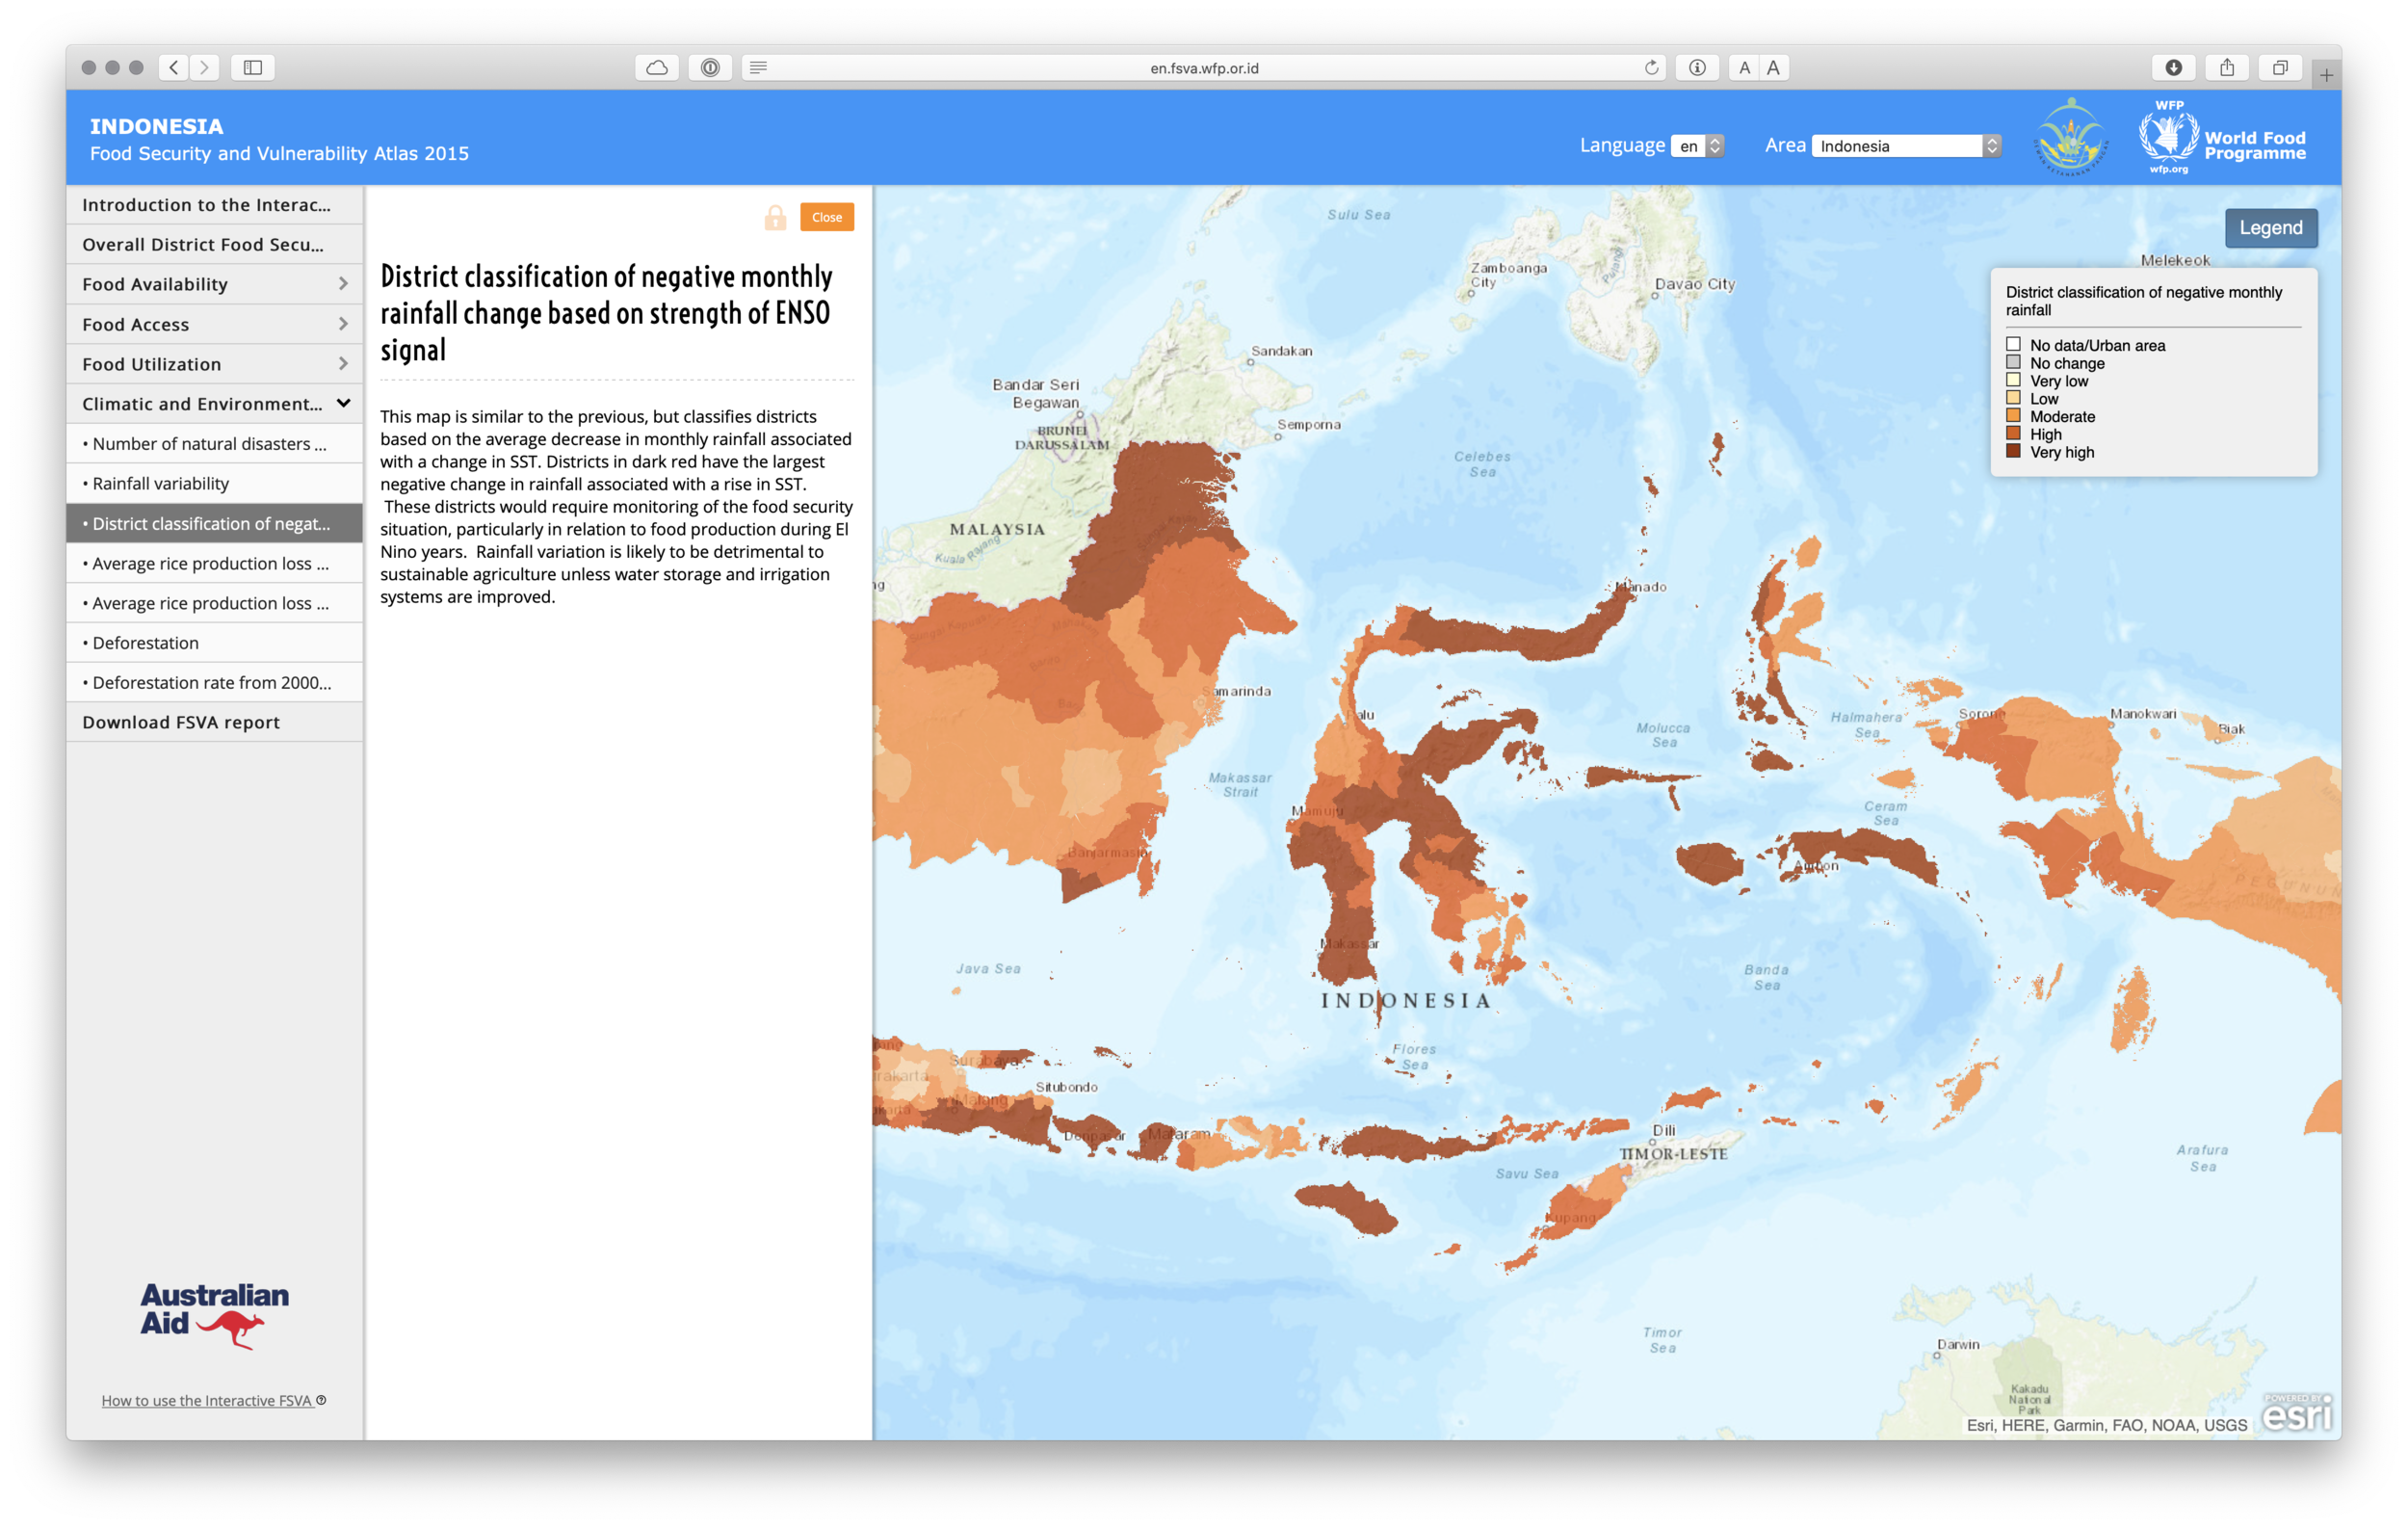
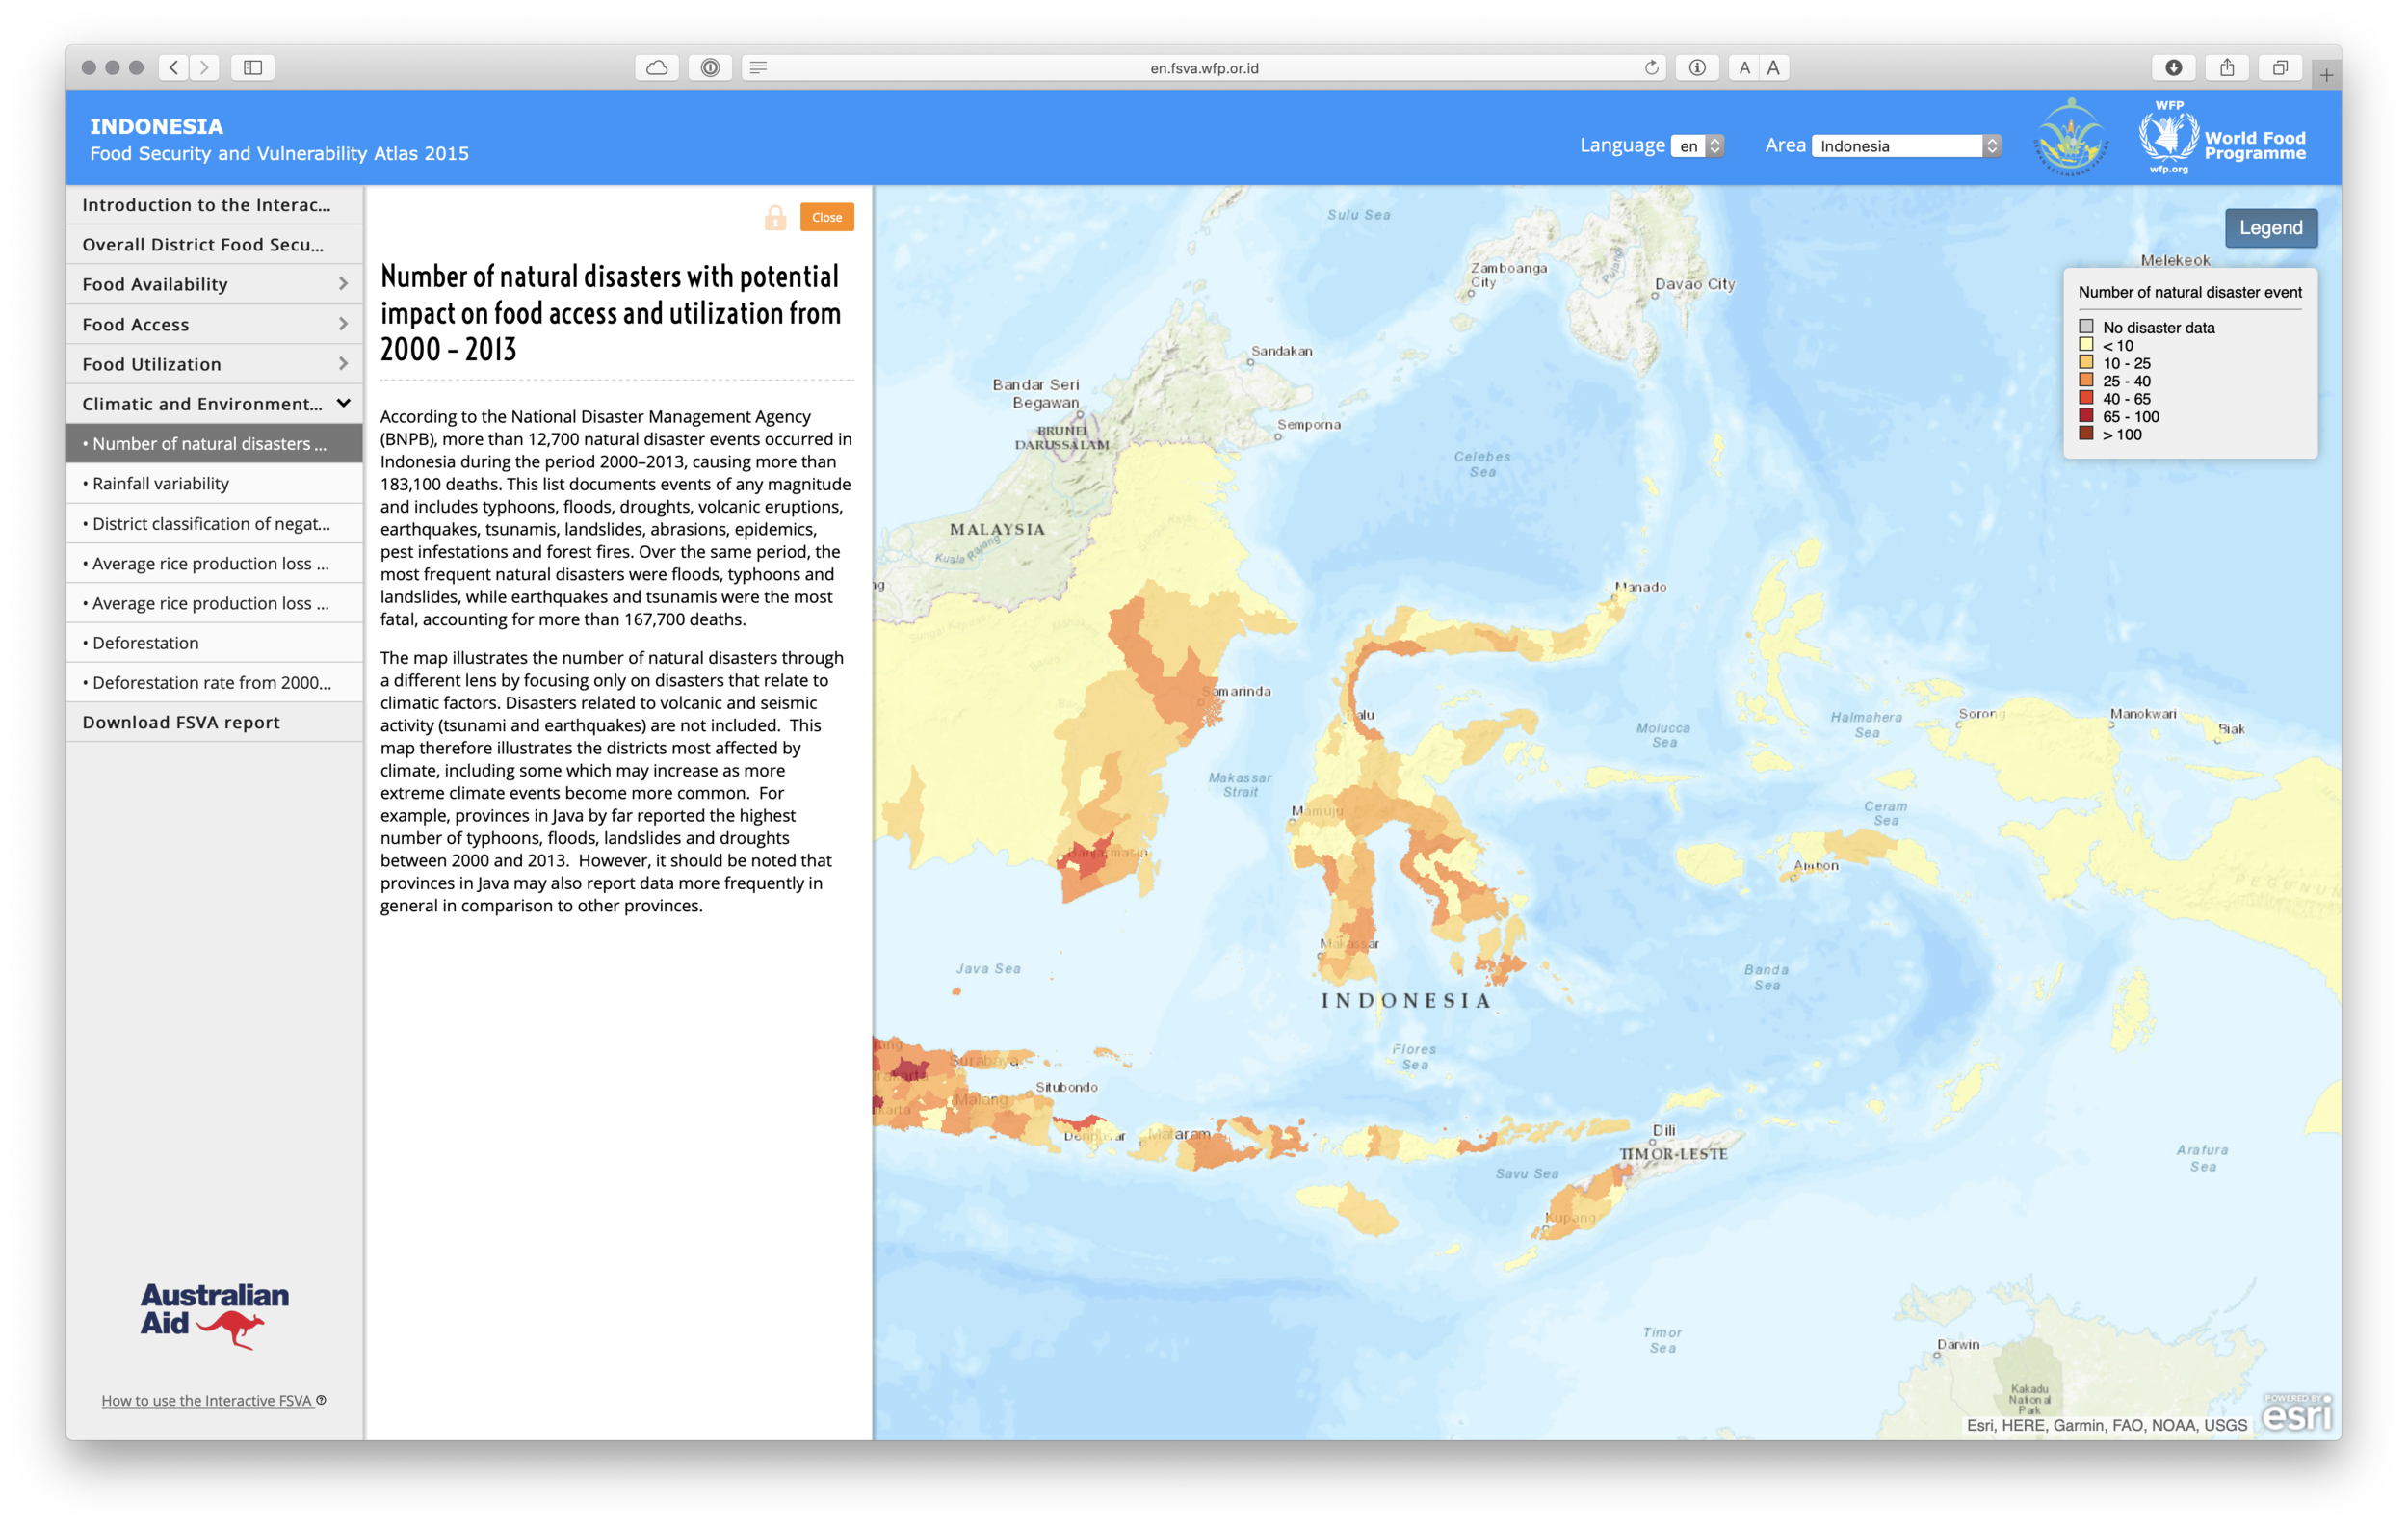
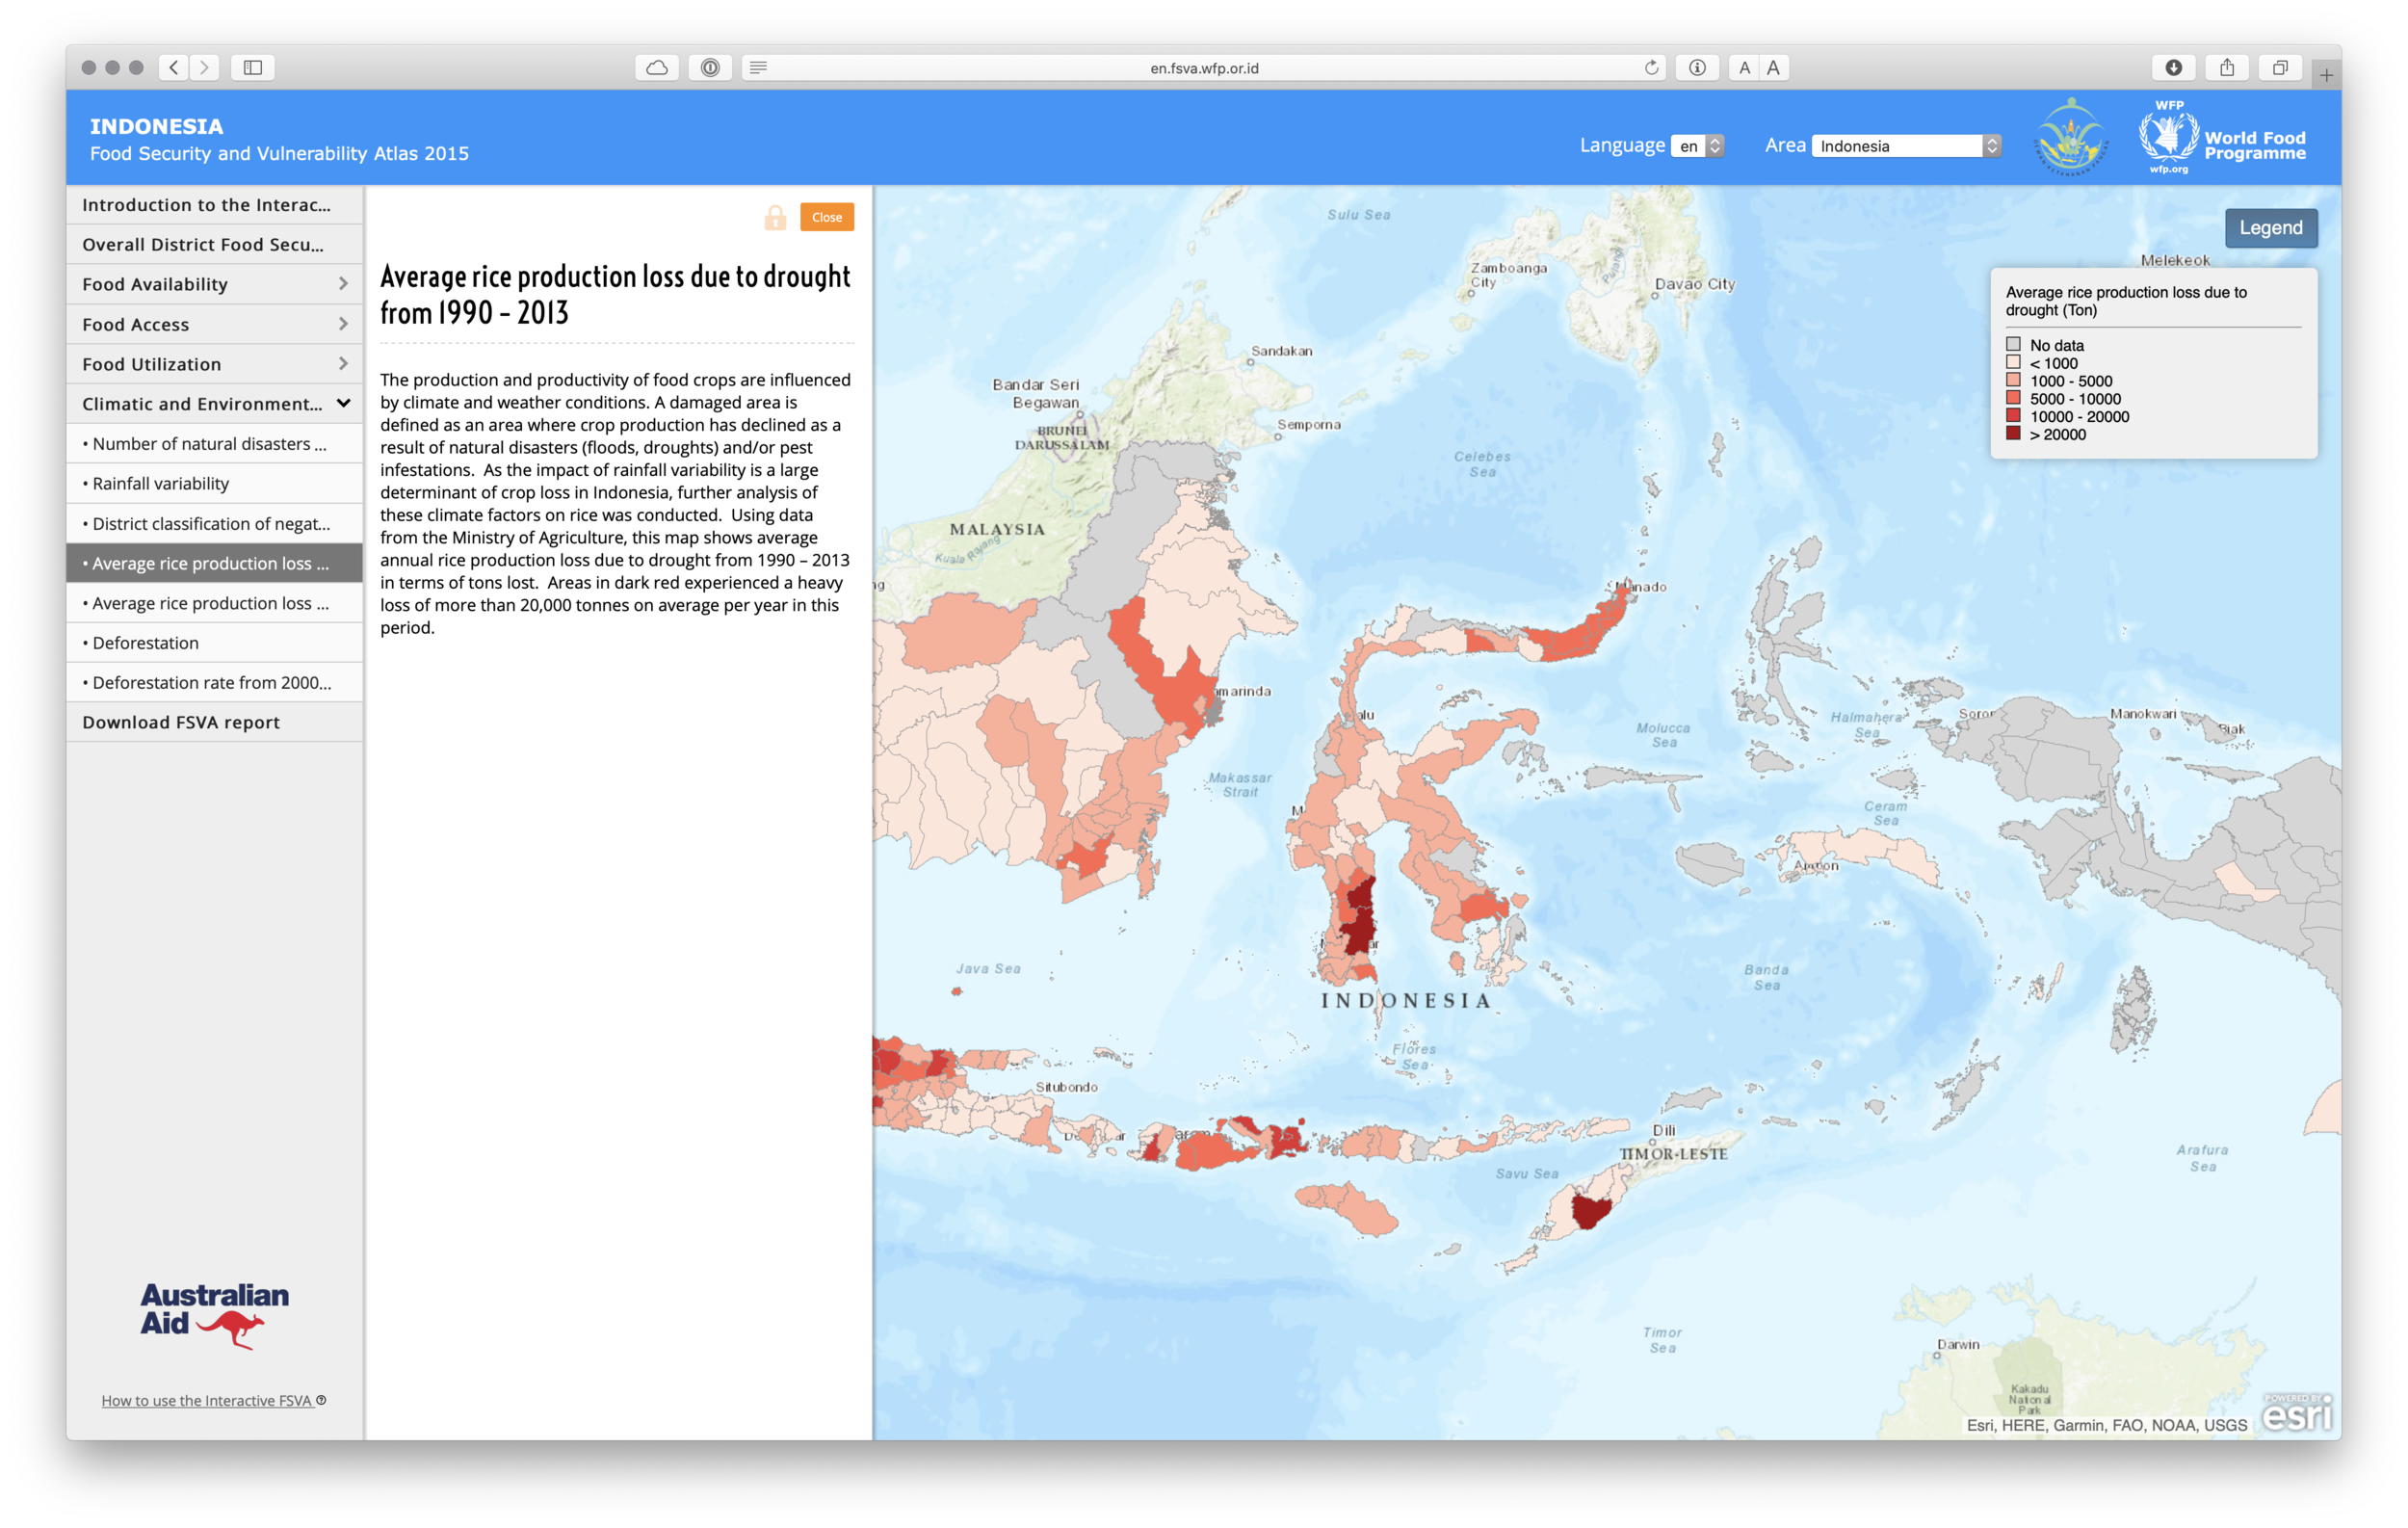
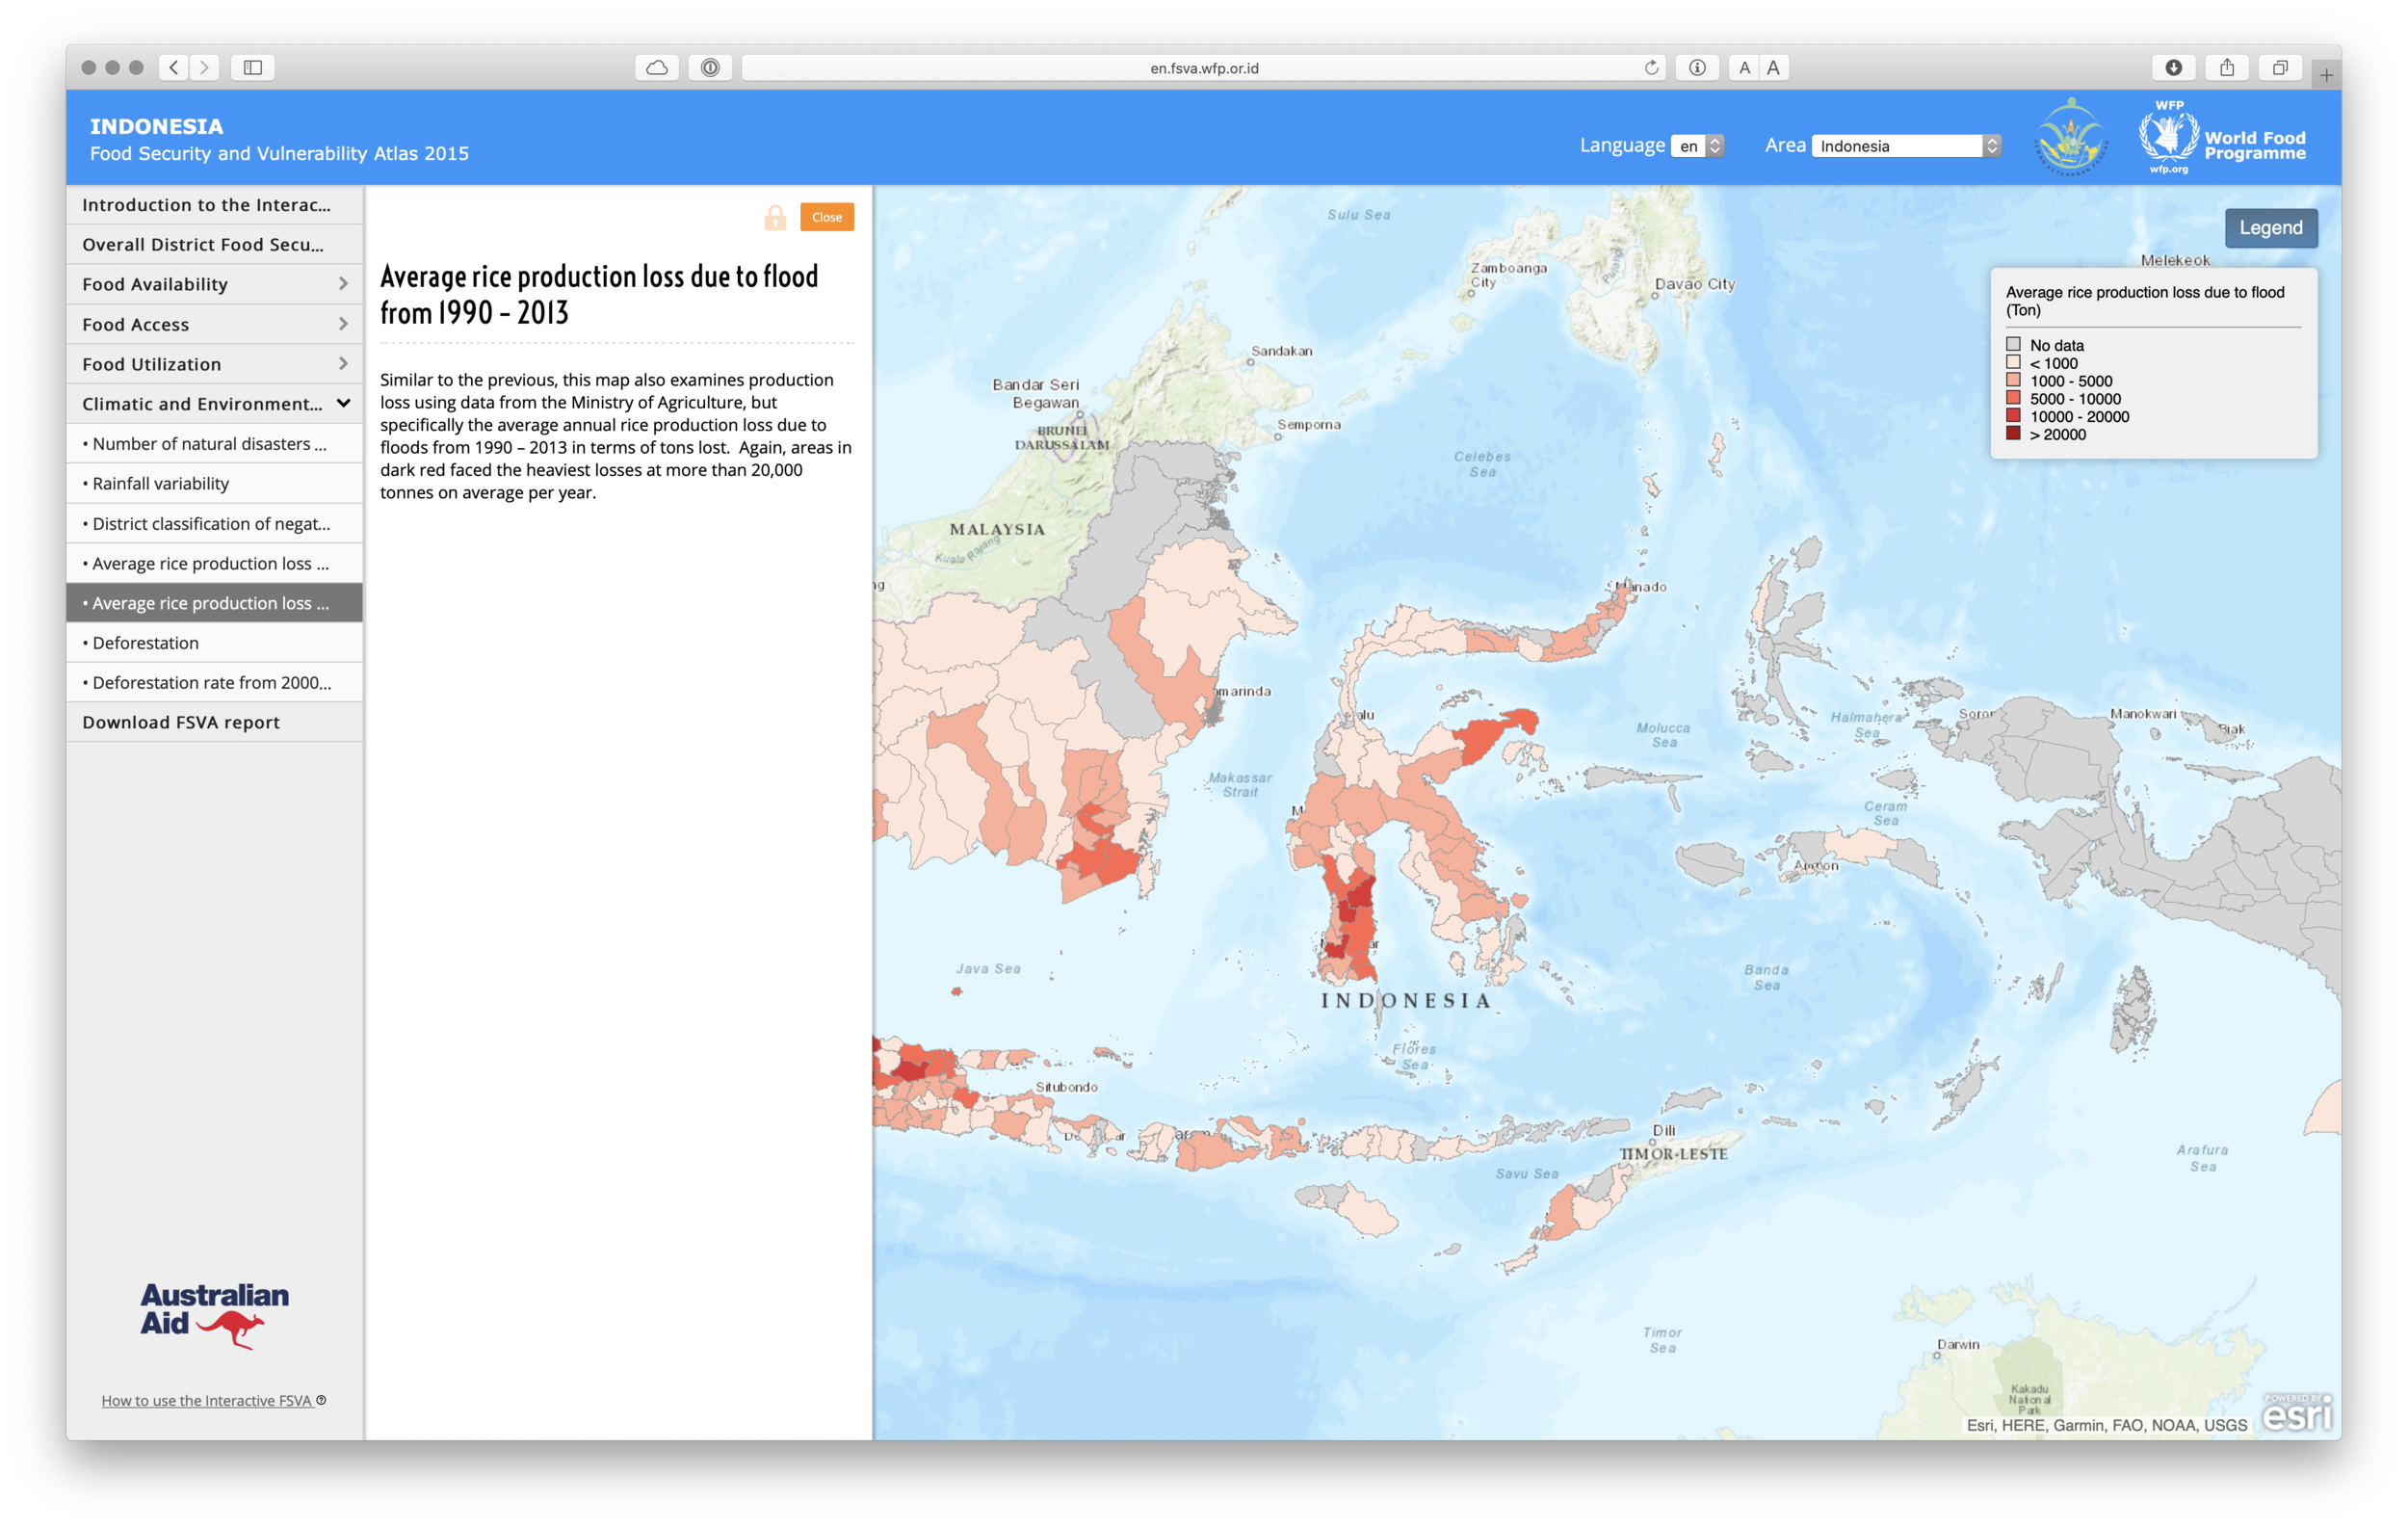
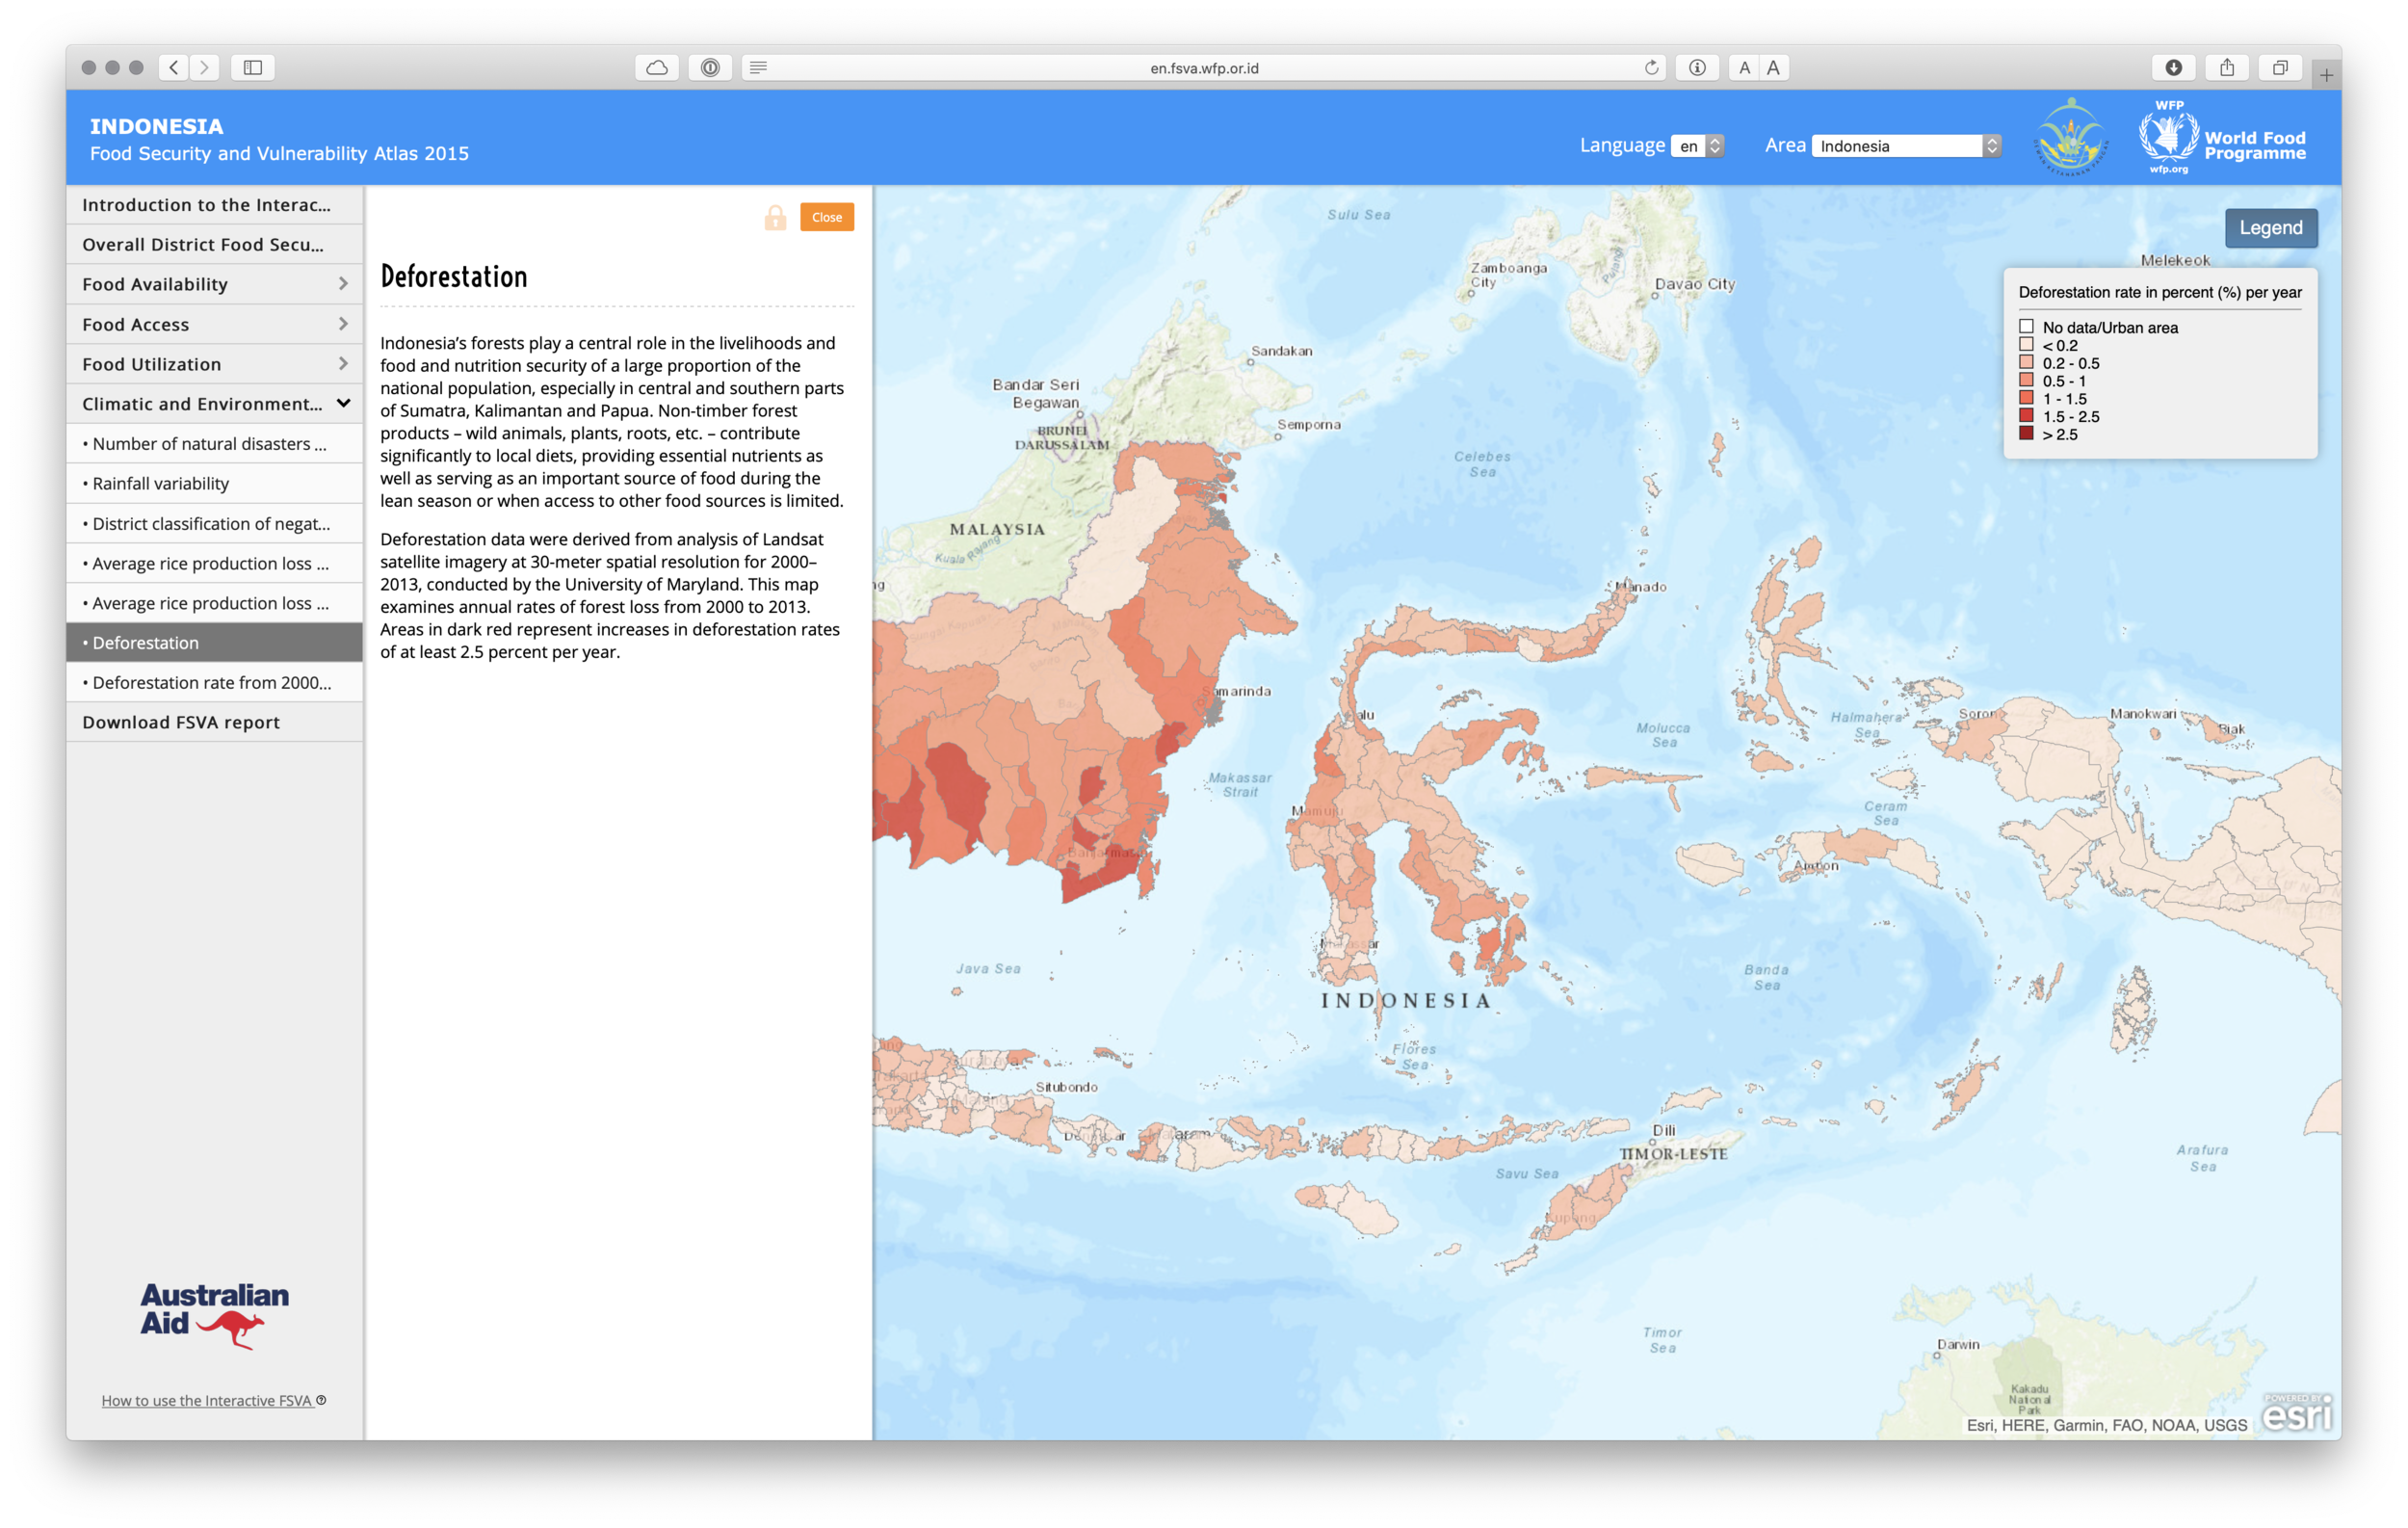
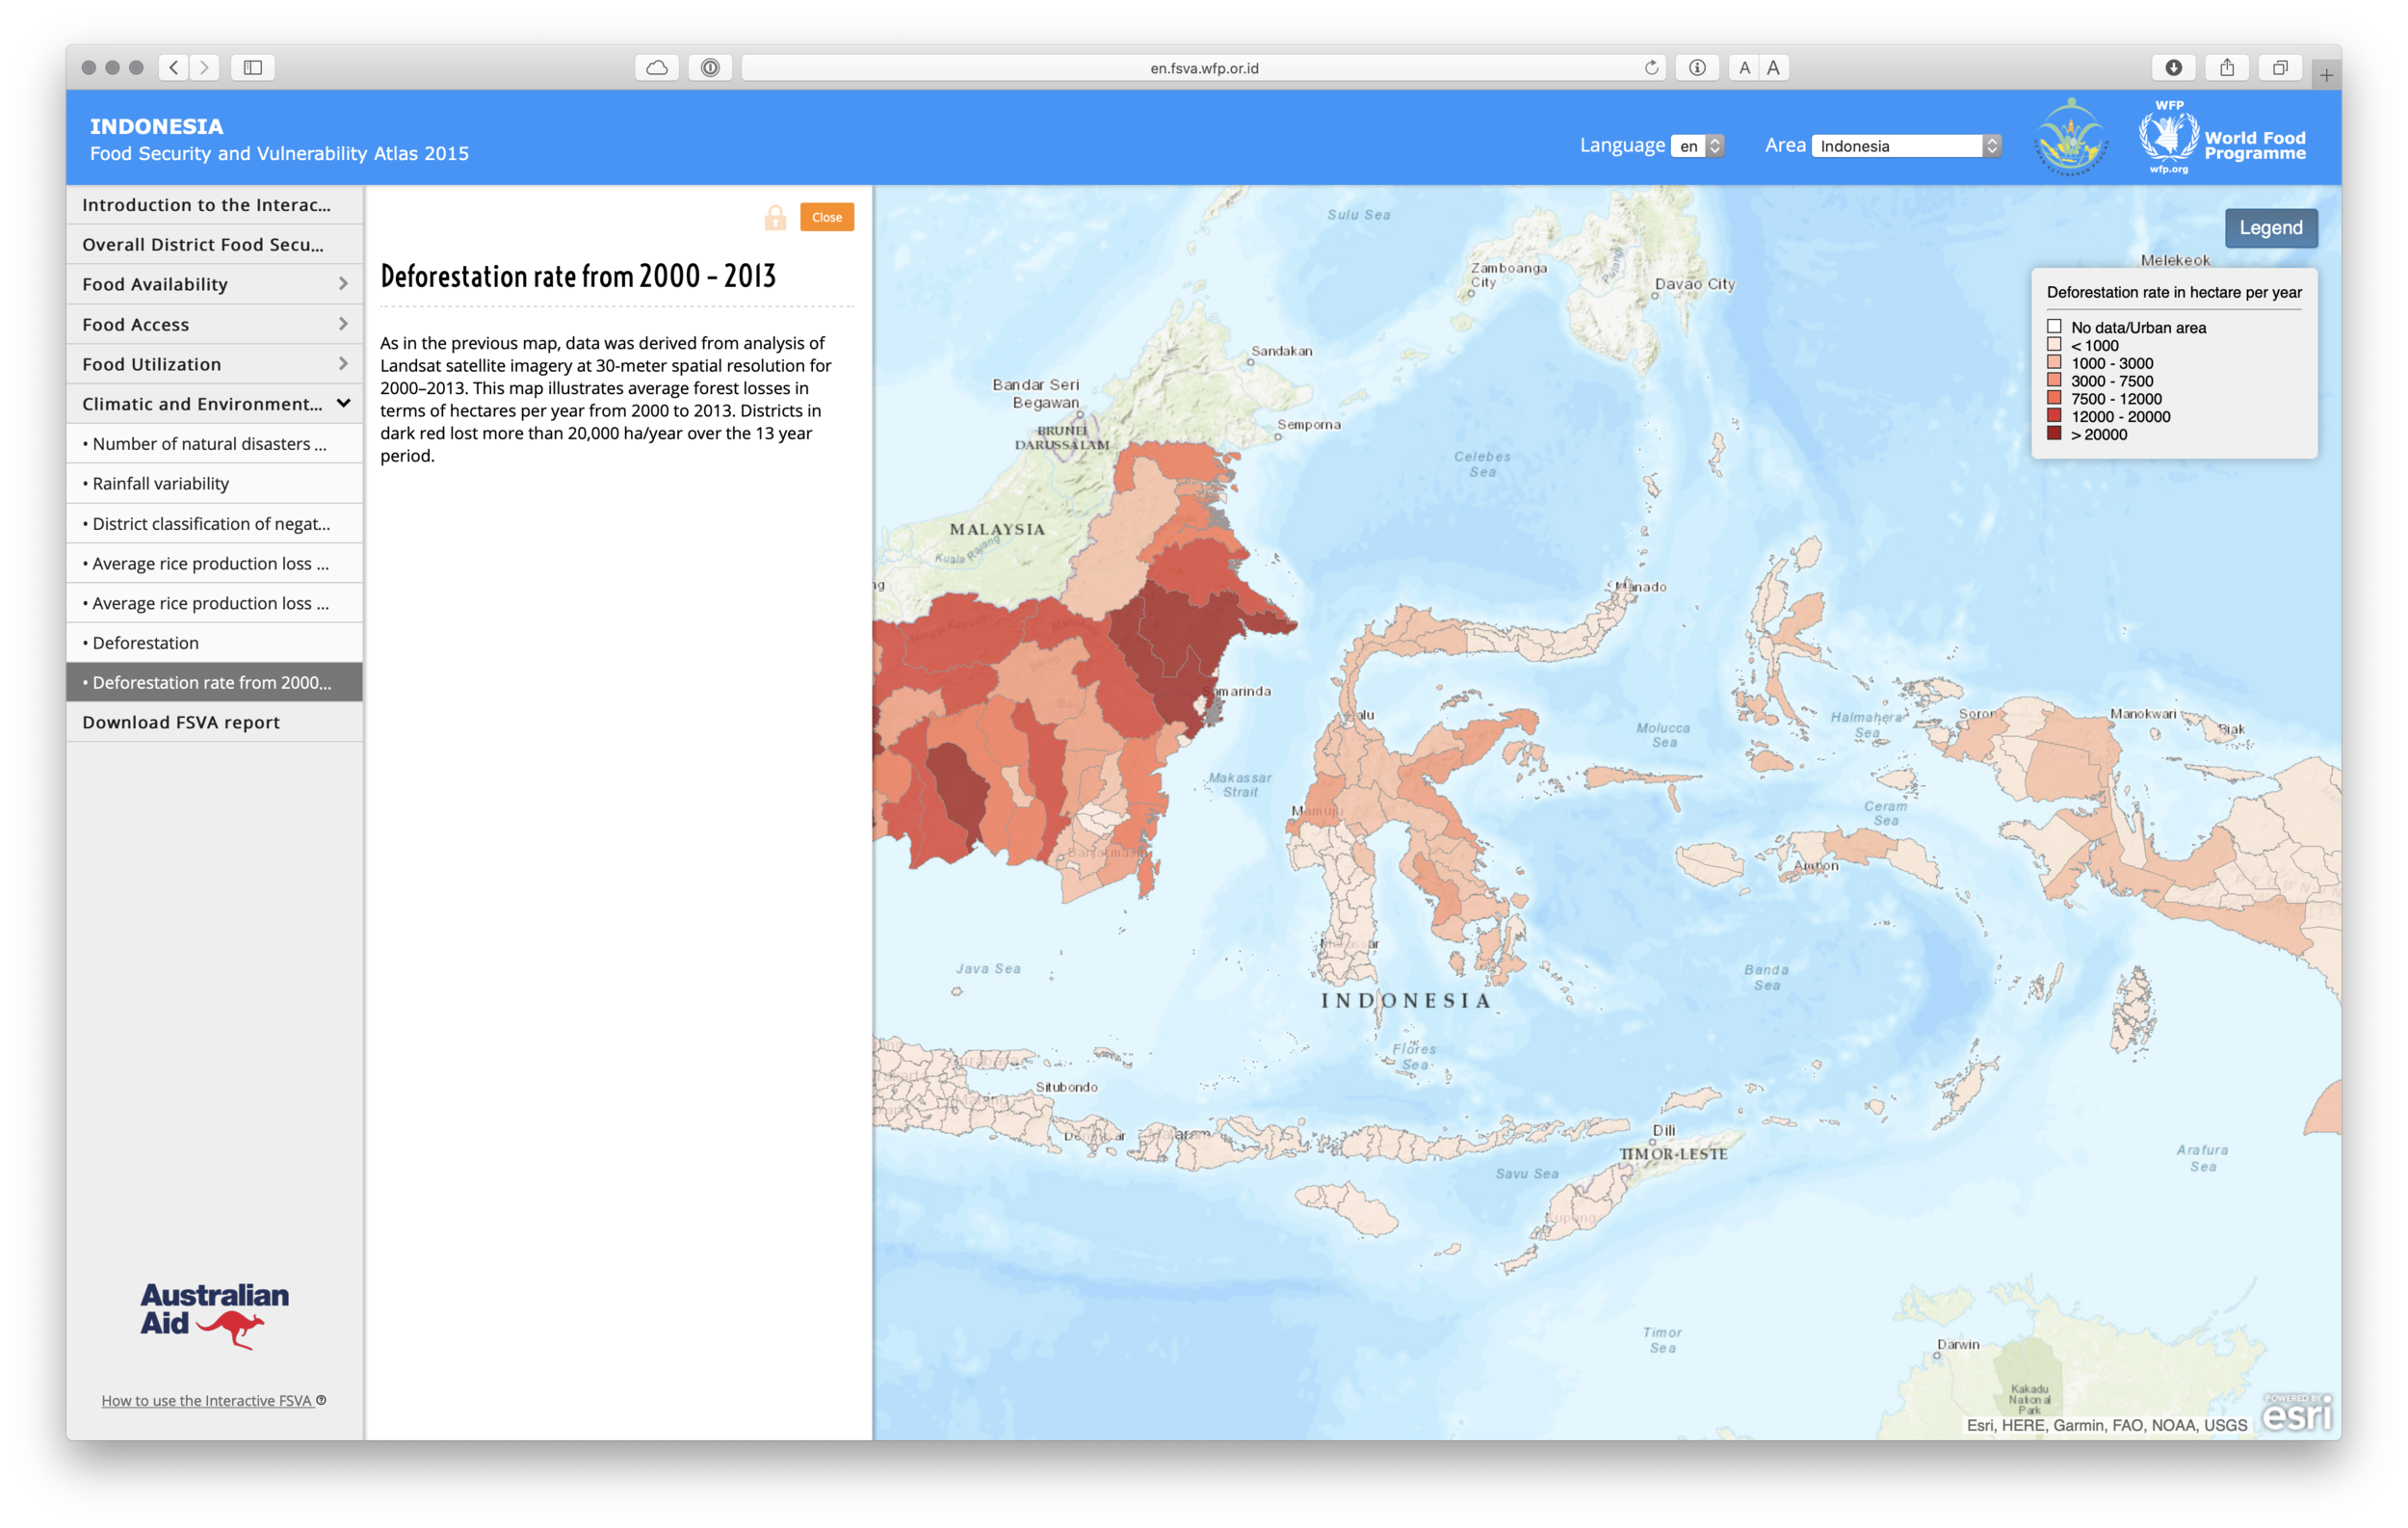
Each indicator has its own screen, grouped under food availability, food access, food utilization, and climatic and environmental factors.
Download the report
The full FSVA report and a shorter advocacy version are available from the atlas itself, in Bahasa Indonesia and English.