Benny Istanto Logo Benny Istanto Logo
  • Home
  • About
  • CSR
  • Blog
    • All Posts
    • Archive by Year
  • Works
    • Overview
    • Experiences
    • Projects
    • Consulting
    • Maps & Infographics
  • CV

precip-index

SPI and SPEI for climate extremes monitoring

precip-index is a lightweight set of Python scripts for calculating precipitation-based climate indices, SPI and SPEI, and for analysing dry and wet extremes using run theory. It is built for gridded xarray workflows.

Year

2025

Organization

GOST / DEC Data Group, The World Bank

Tools

Python, xarray, NetCDF

Built on

climate-indices by James Adams

License

BSD-3-Clause

Links

Documentation · GitHub

What it does

  • SPI and SPEI at 1, 3, 6, 12 and 24-month scales, with CF-compliant NetCDF output.
  • Dry and wet in one framework. The same API and methodology handles drought and flood-prone conditions, rather than treating wet extremes as an afterthought.
  • Multi-distribution fitting: Gamma, Pearson Type III and Log-Logistic, so the distribution can be chosen per workflow.
  • Run theory events: duration, magnitude, intensity, peak and inter-arrival time, plus gridded summaries.
  • Operational mode: fit once, save the parameters, then apply them to new observations without refitting.
  • Built for large grids: chunked tiling, memory estimation and streaming I/O, so CHIRPS, ERA5-Land and TerraClimate are practical.
  • Visualization: event-highlighted time series, the 11-category WMO classification, and spatial maps.

Global output
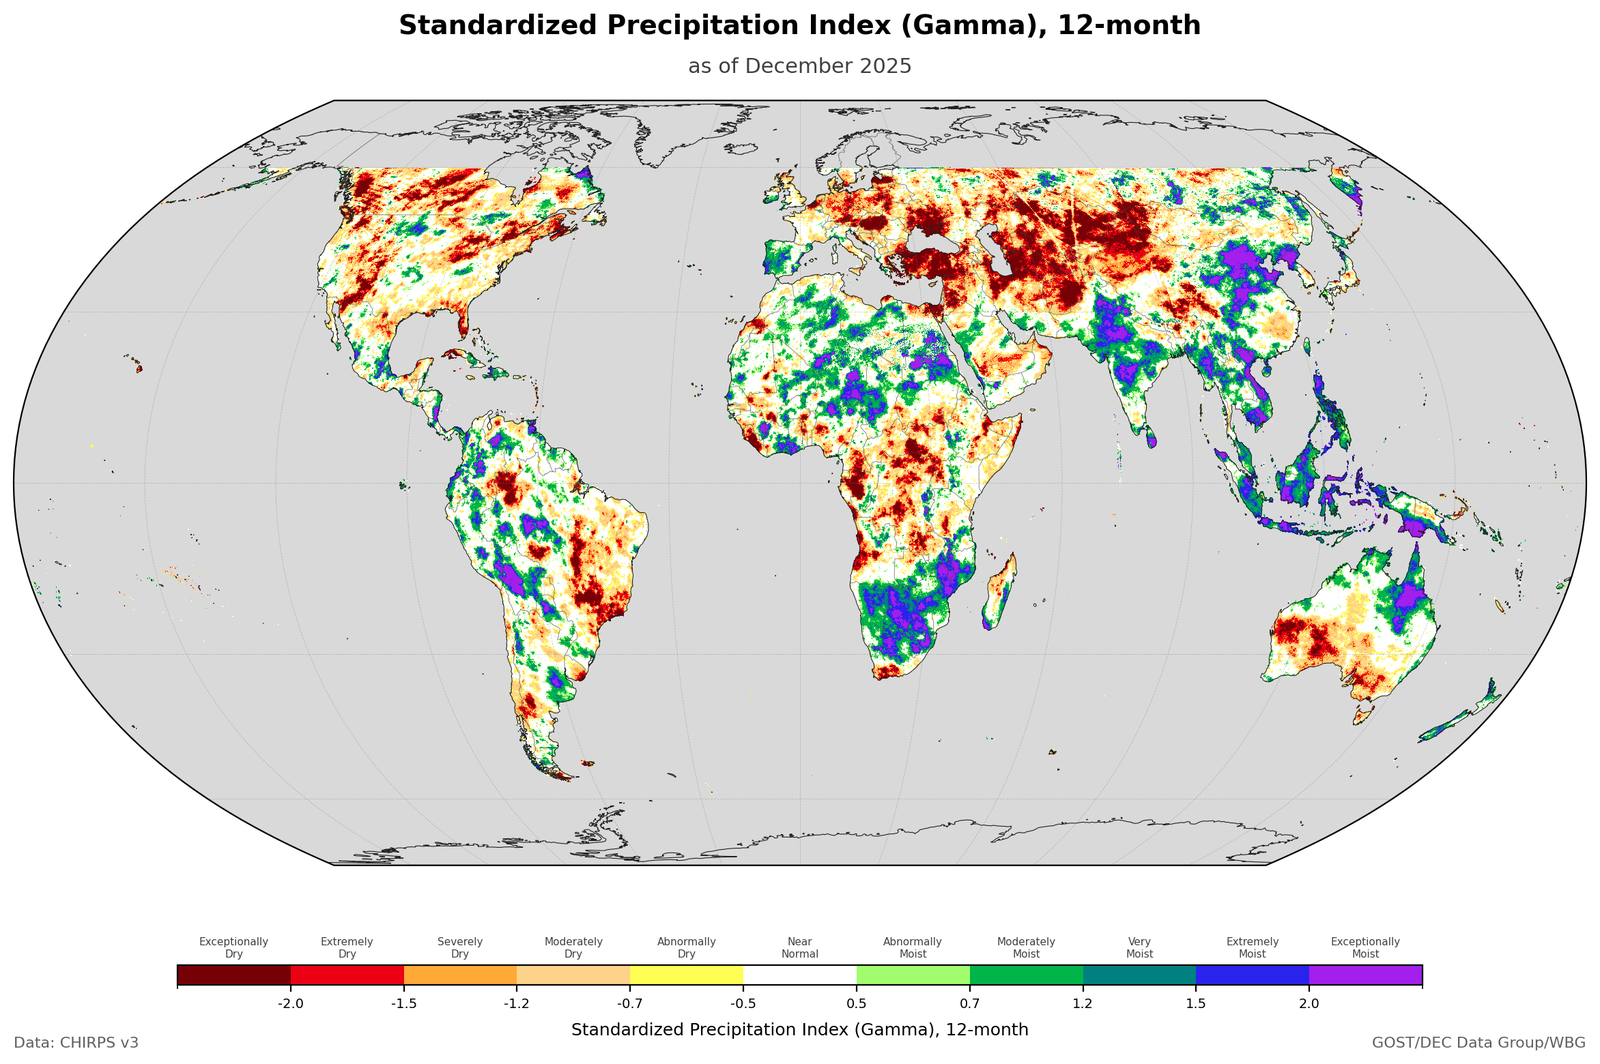
SPI-12 (Gamma) from CHIRPS v3 at 0.05 degree resolution, December 2025

SPI-12 (Gamma) from CHIRPS v3 at 0.05 degree resolution, December 2025

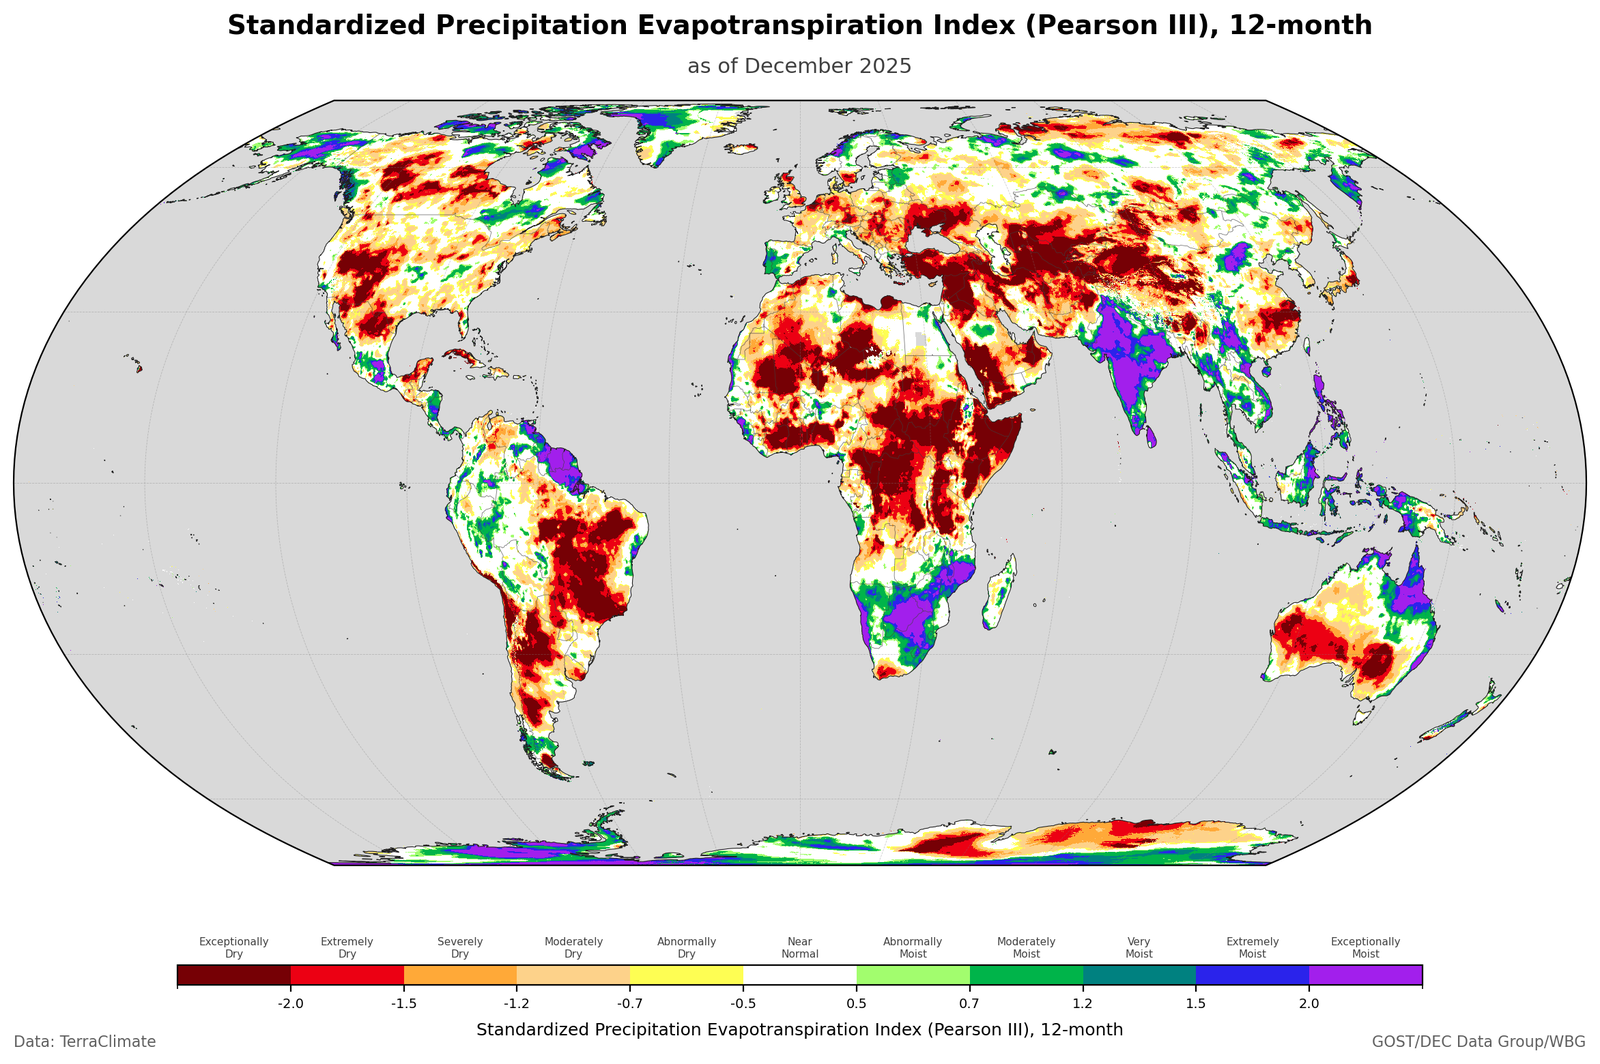
SPEI-12 (Pearson III) from TerraClimate at 0.0417 degree, about 4 km, December 2025

SPEI-12 (Pearson III) from TerraClimate at 0.0417 degree, about 4 km, December 2025

Run theory events

Rather than counting threshold exceedances, each spell is treated as an event with its own properties.
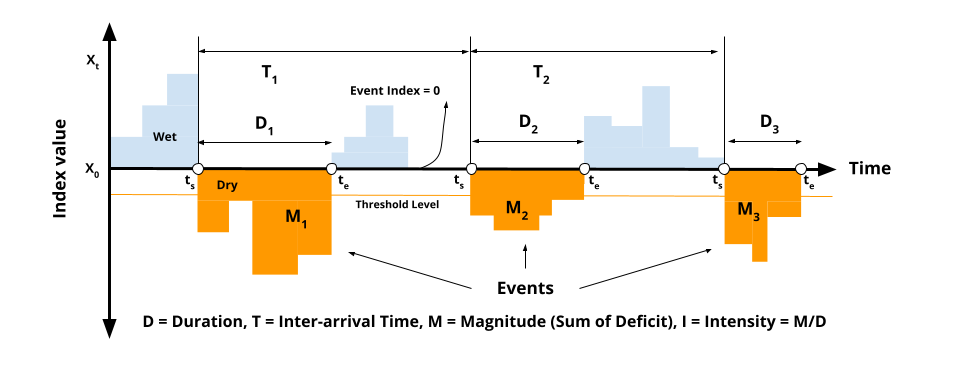
Duration, inter-arrival time, magnitude and intensity, defined against a threshold and applied to both dry and wet spells

Duration, inter-arrival time, magnitude and intensity, defined against a threshold and applied to both dry and wet spells

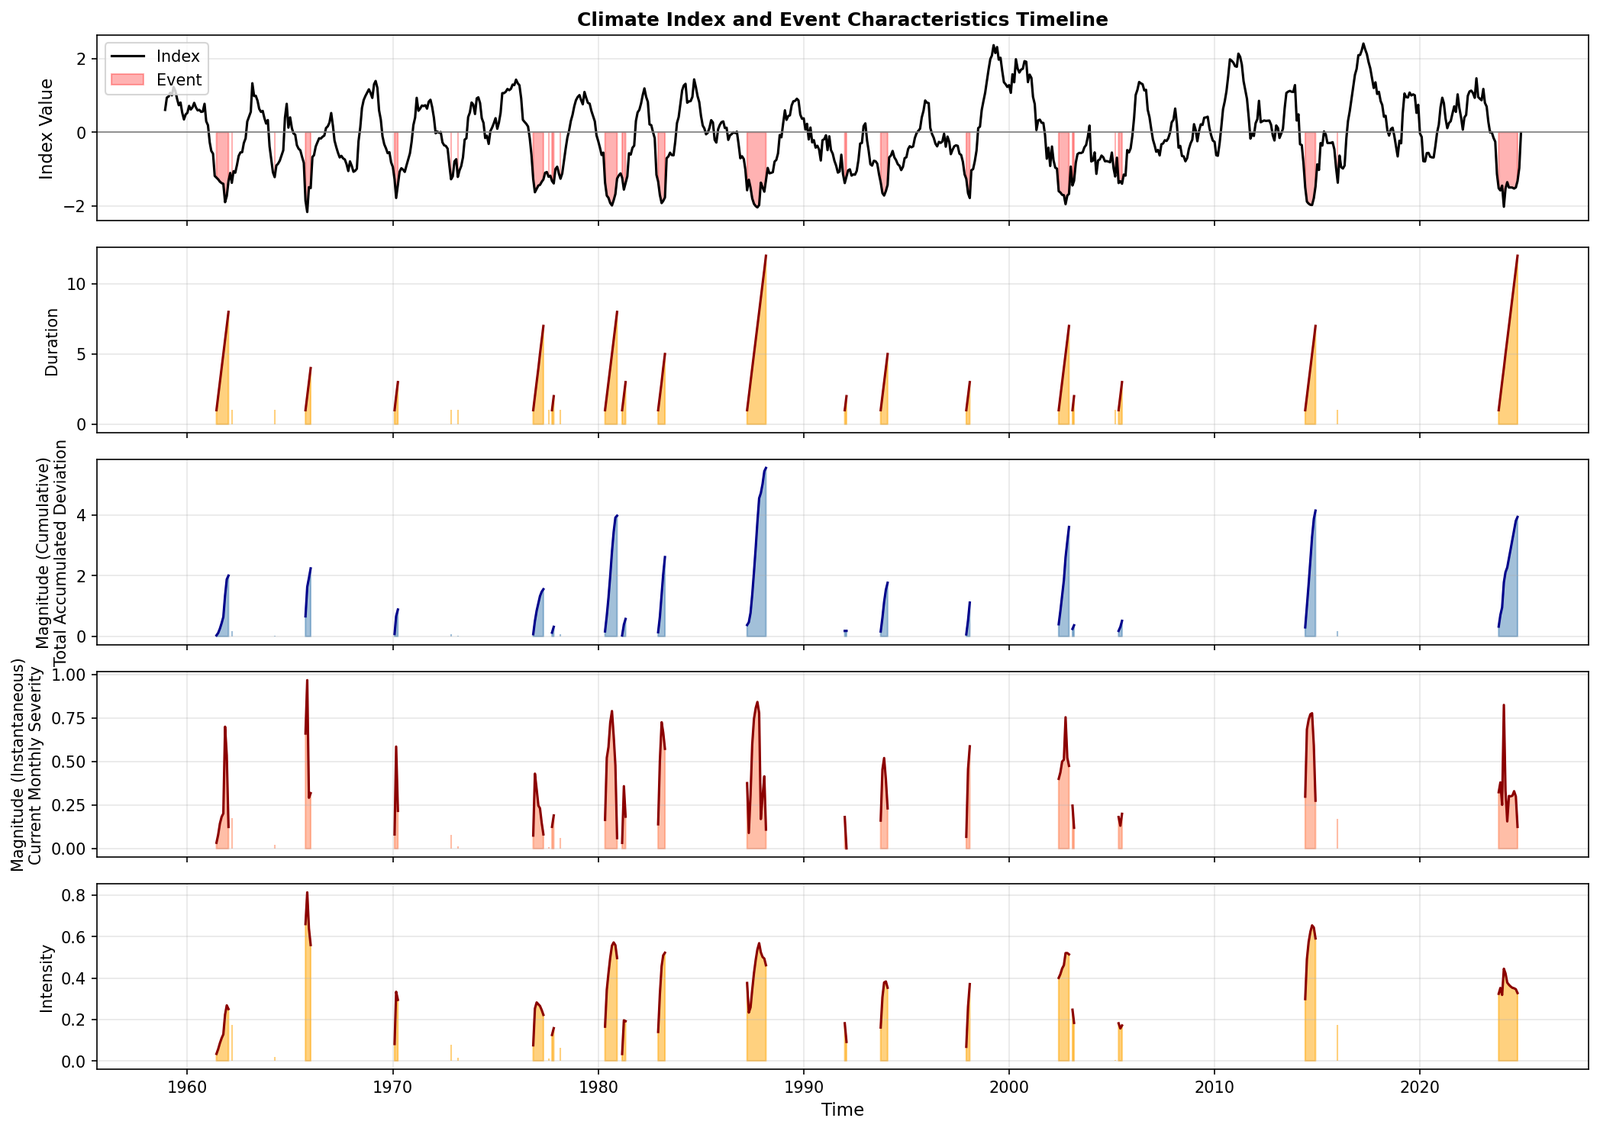
Run theory metrics through time: the index with events shaded, then duration, cumulative magnitude, instantaneous severity and intensity for each event

Run theory metrics through time: the index with events shaded, then duration, cumulative magnitude, instantaneous severity and intensity for each event

Dry and wet, the same way

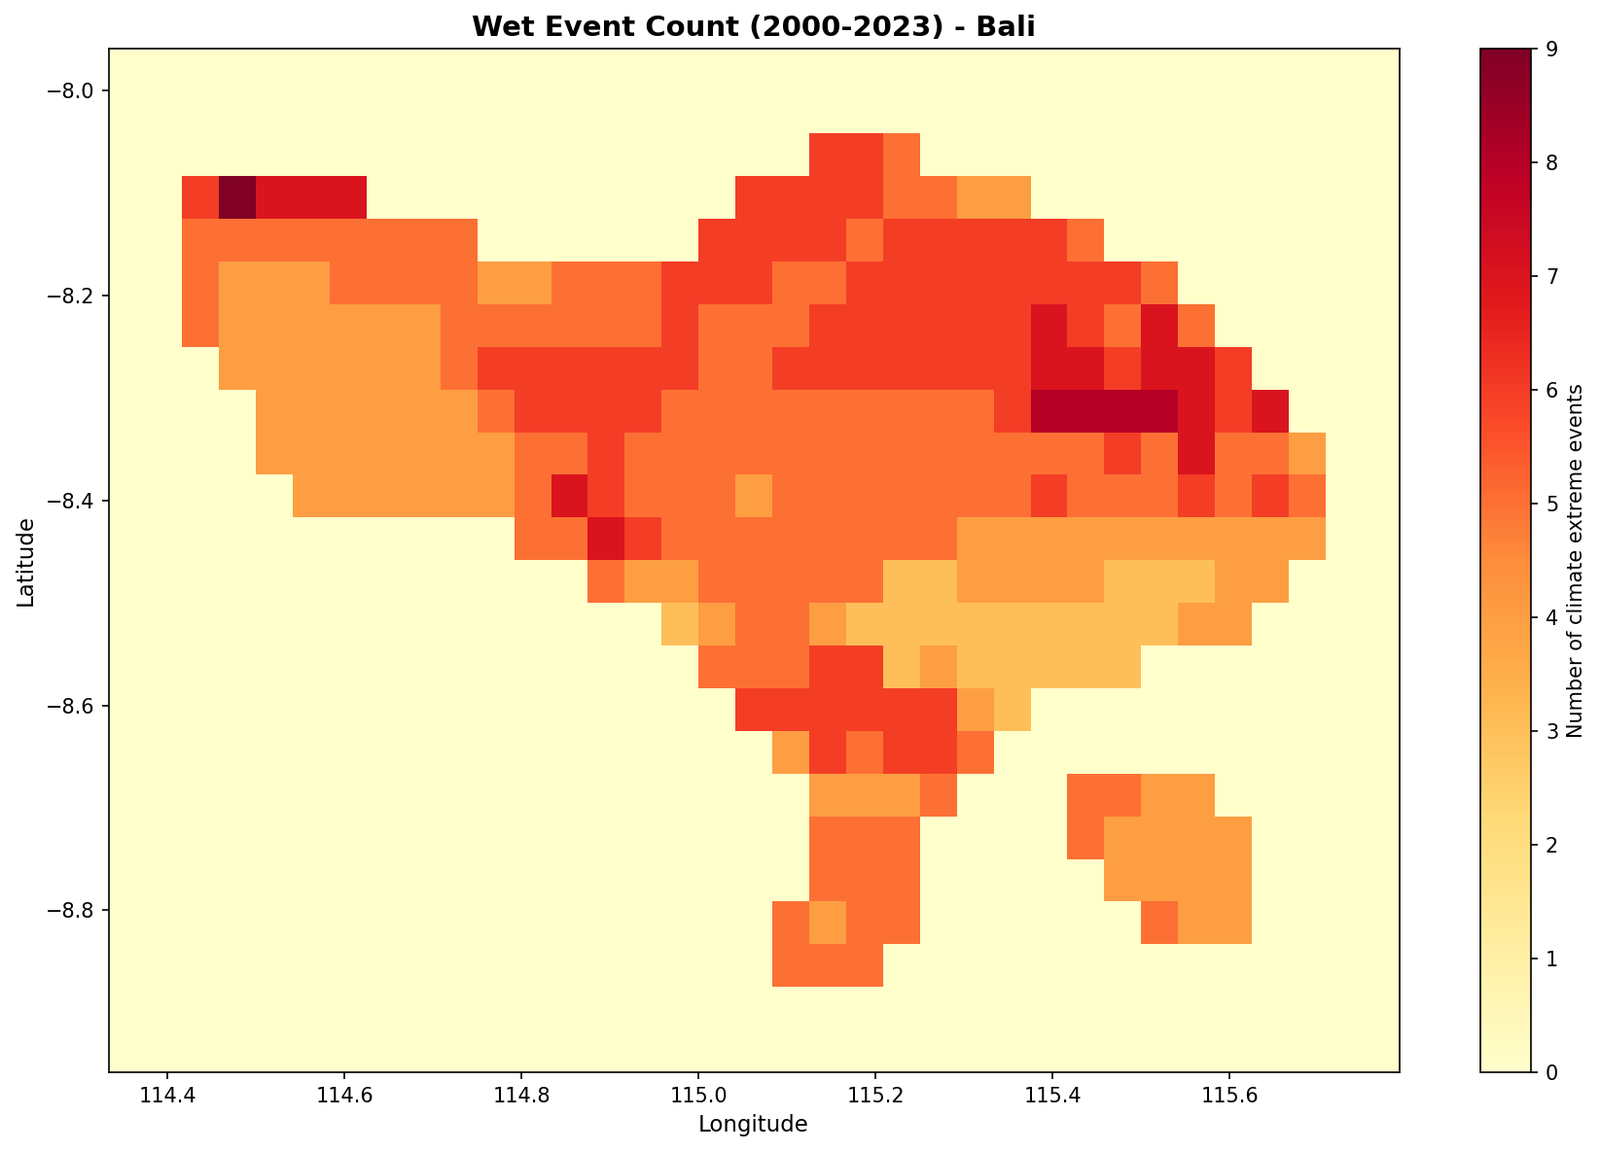
The threshold works in both directions, so a wet spell is described with the same metrics as a dry one and the two maps come from one code path.
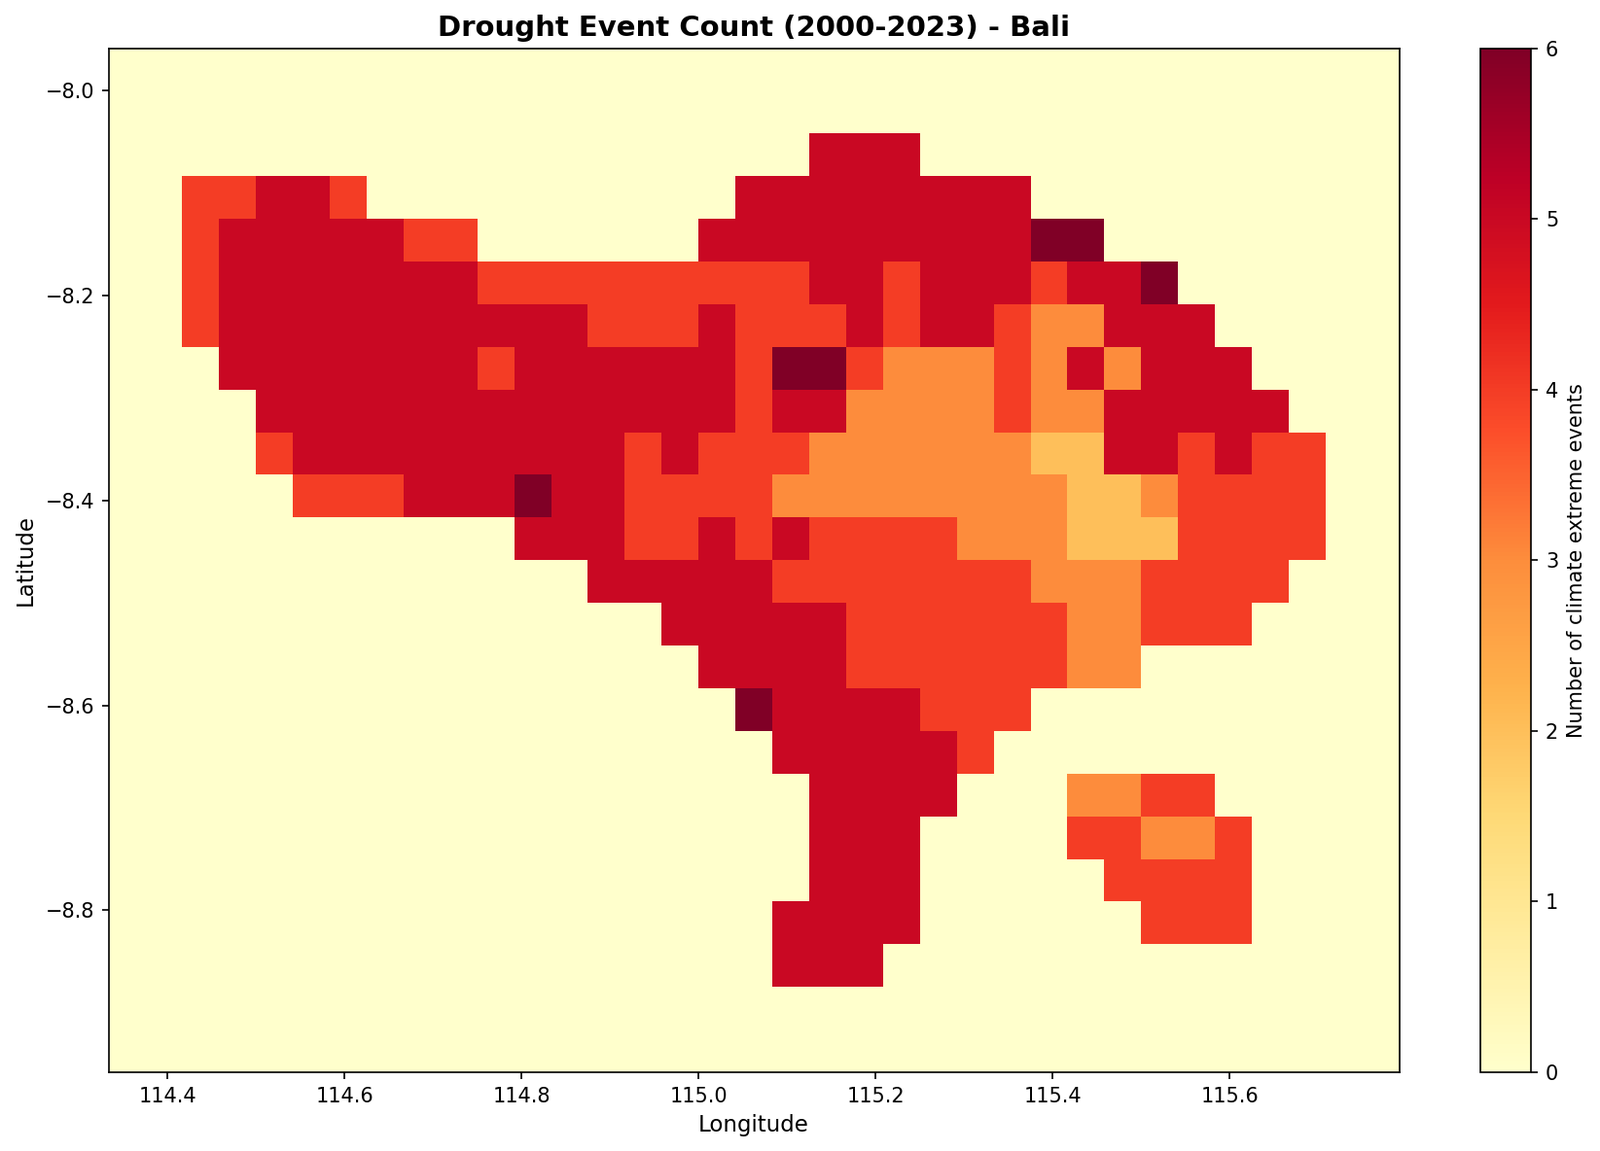
Drought event count per grid cell, Bali, 2000 to 2023

Drought event count per grid cell, Bali, 2000 to 2023

Wet event count over the same period, produced by the same code path with the threshold reversed

Wet event count over the same period, produced by the same code path with the threshold reversed

SPI, SPEI and the PET method

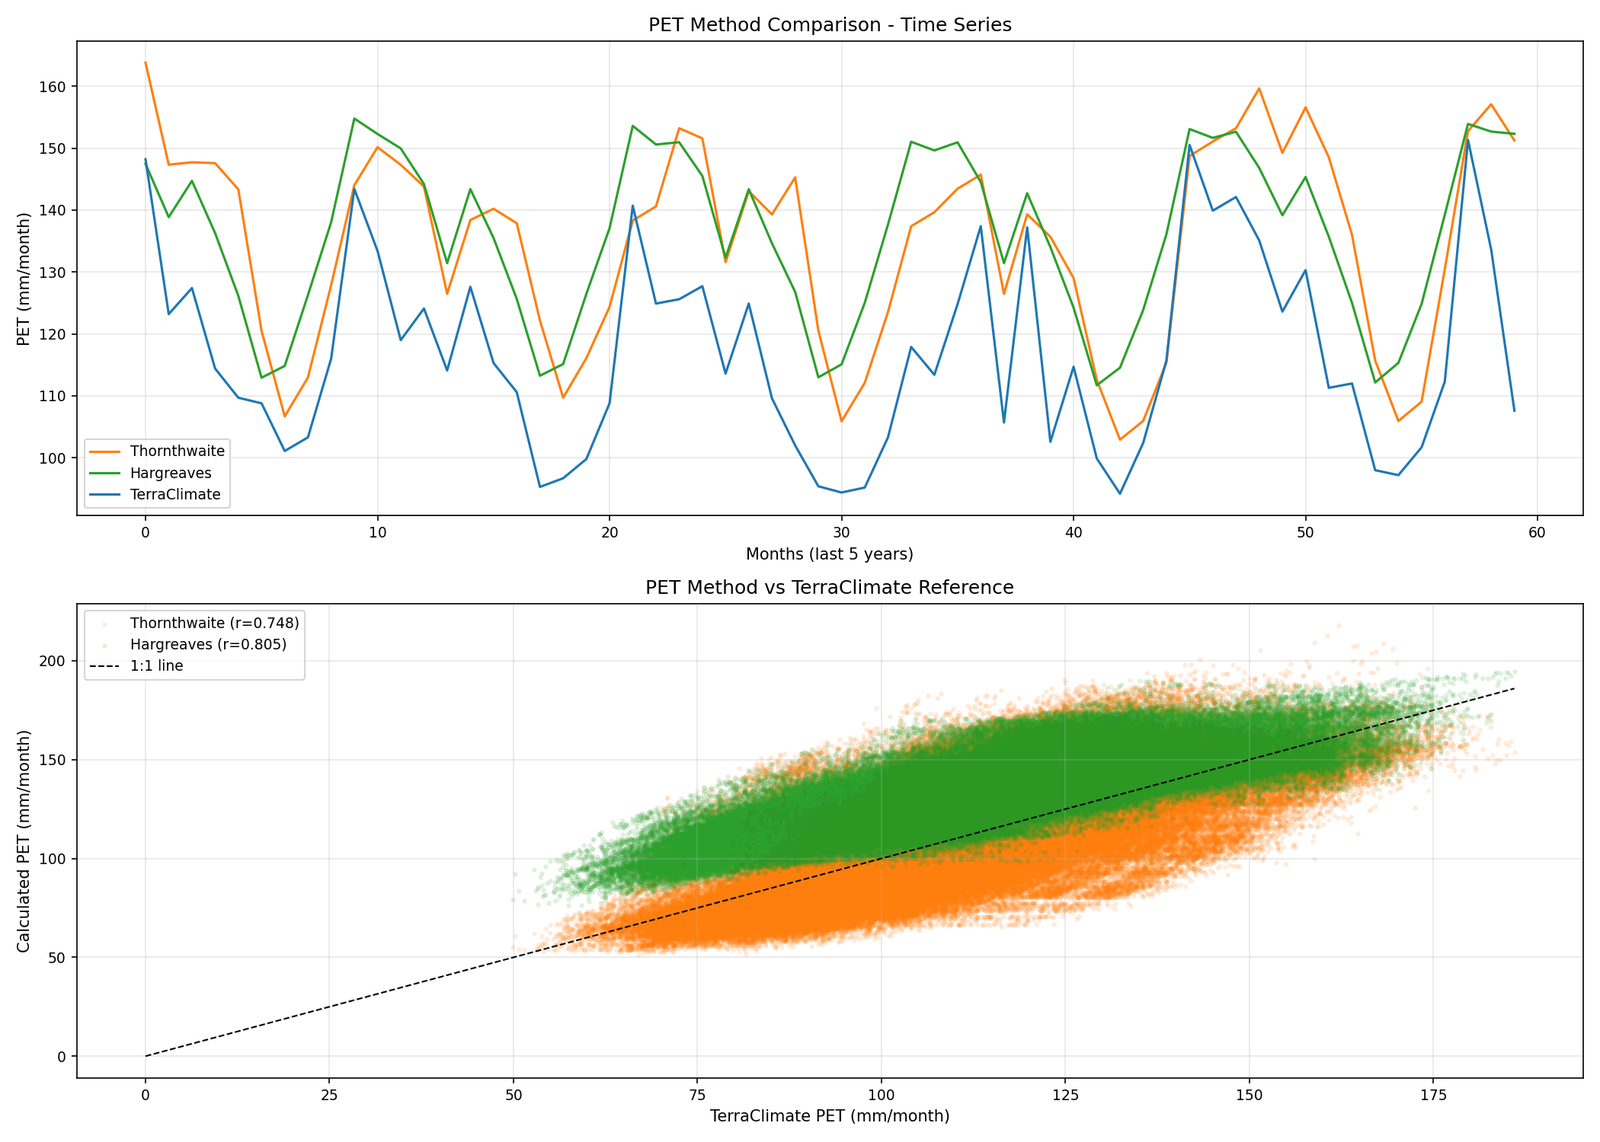
SPEI subtracts potential evapotranspiration from precipitation, so the choice of PET method matters and the two indices drift apart as temperature rises.
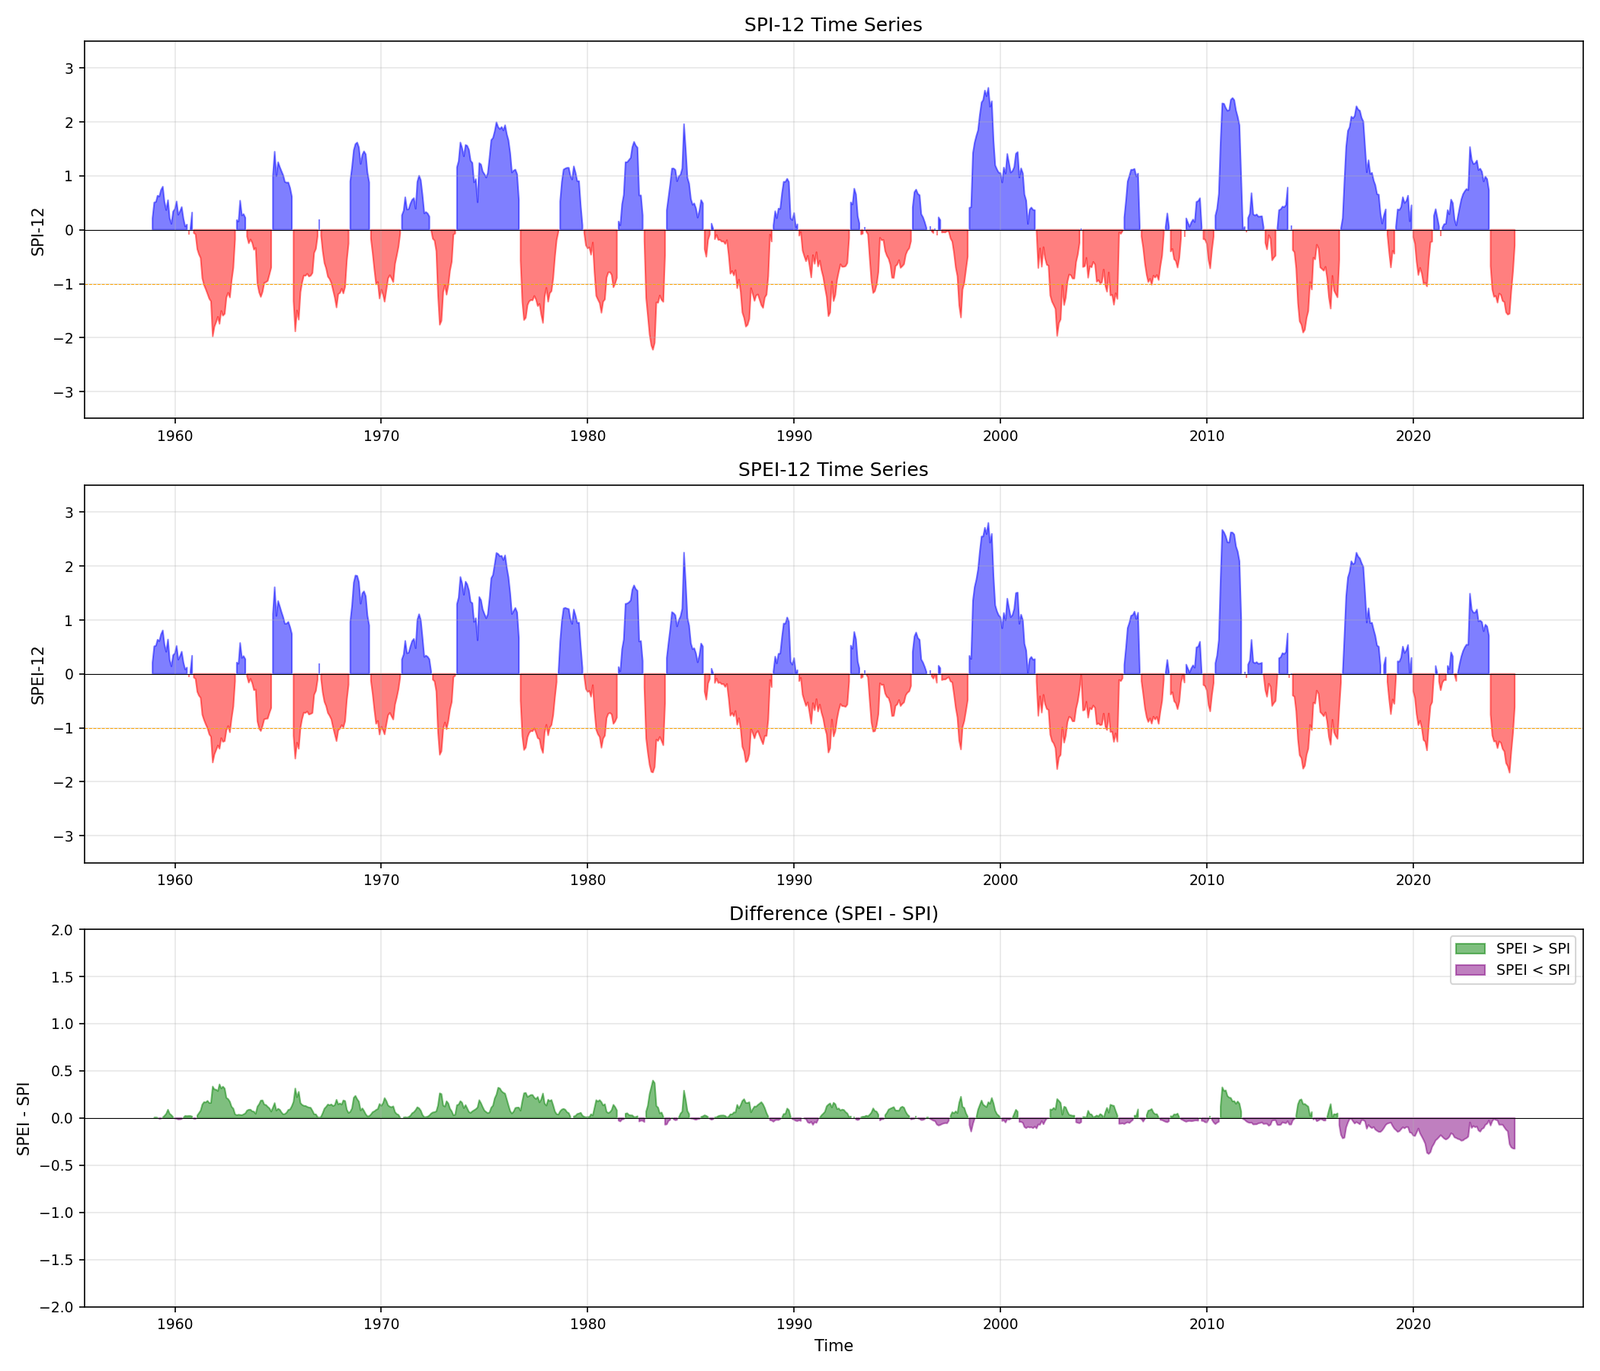
SPI-12, SPEI-12 and the difference between them. SPEI runs wetter than SPI early in the record and drier after about 2015, which is the evaporative demand signal

SPI-12, SPEI-12 and the difference between them. SPEI runs wetter than SPI early in the record and drier after about 2015, which is the evaporative demand signal

Potential evapotranspiration from Thornthwaite and Hargreaves against the TerraClimate reference, r = 0.748 and r = 0.805

Potential evapotranspiration from Thornthwaite and Hargreaves against the TerraClimate reference, r = 0.748 and r = 0.805

Classification and trends

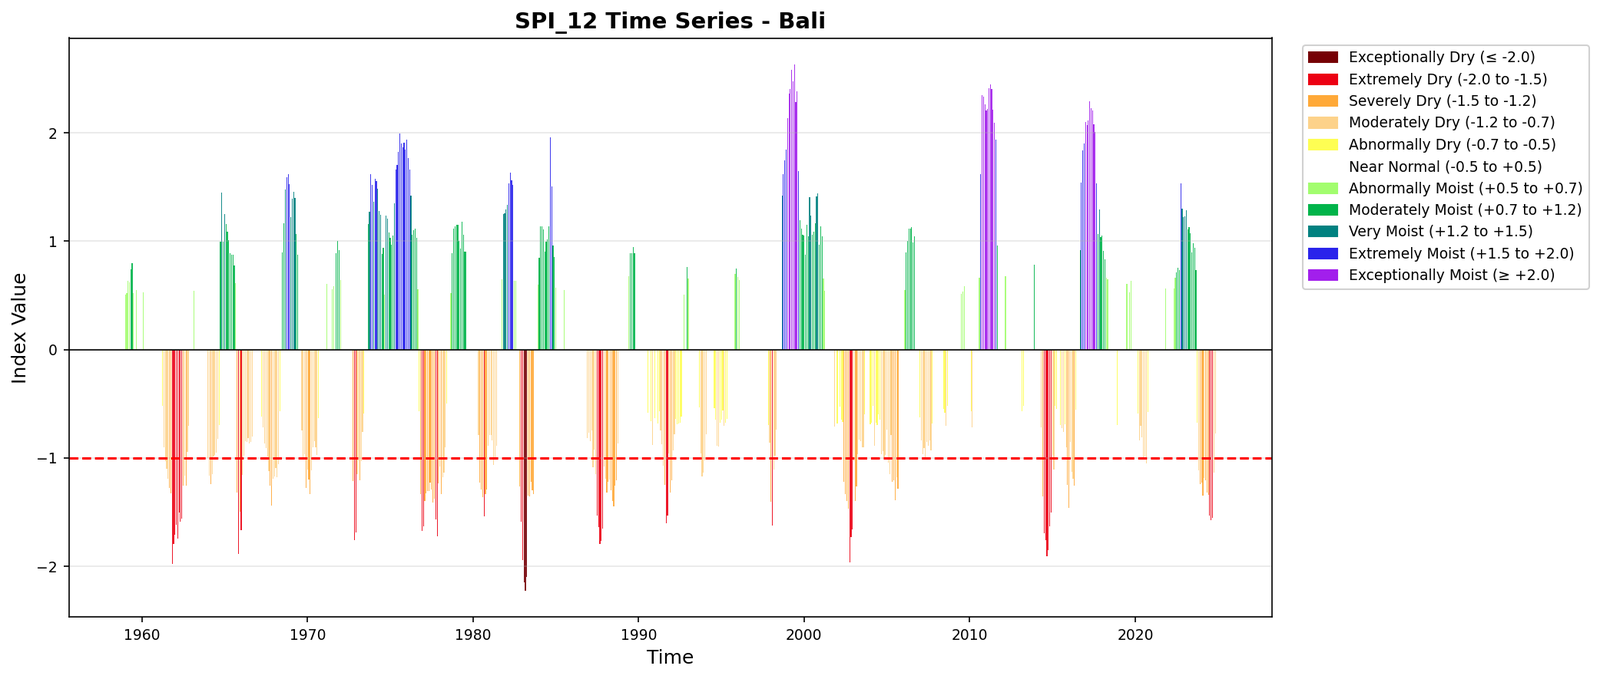
SPI-12 for Bali, coloured by the 11-category WMO classification from exceptionally dry to exceptionally moist

SPI-12 for Bali, coloured by the 11-category WMO classification from exceptionally dry to exceptionally moist

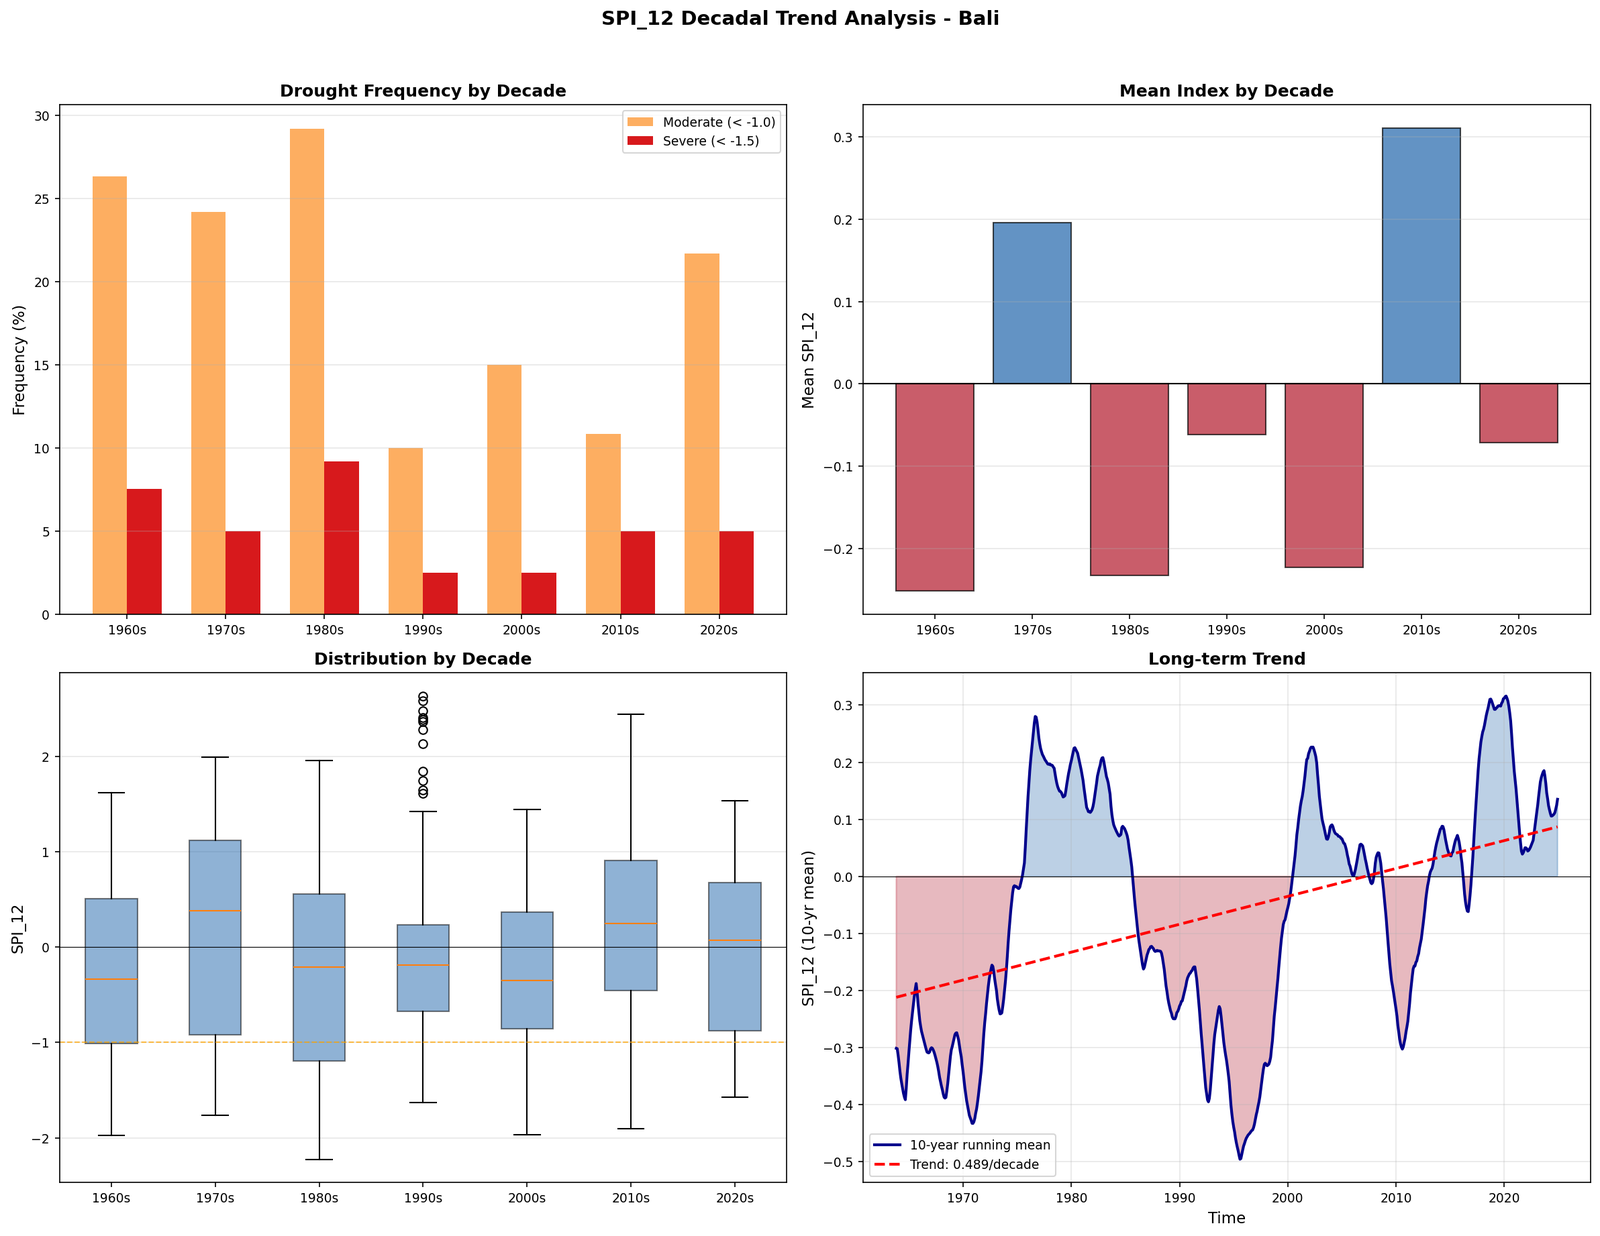
Decadal view for Bali: drought frequency, mean index, spread by decade, and a ten-year running mean

Decadal view for Bali: drought frequency, mean index, spread by decade, and a ten-year running mean

A worked example: Bali

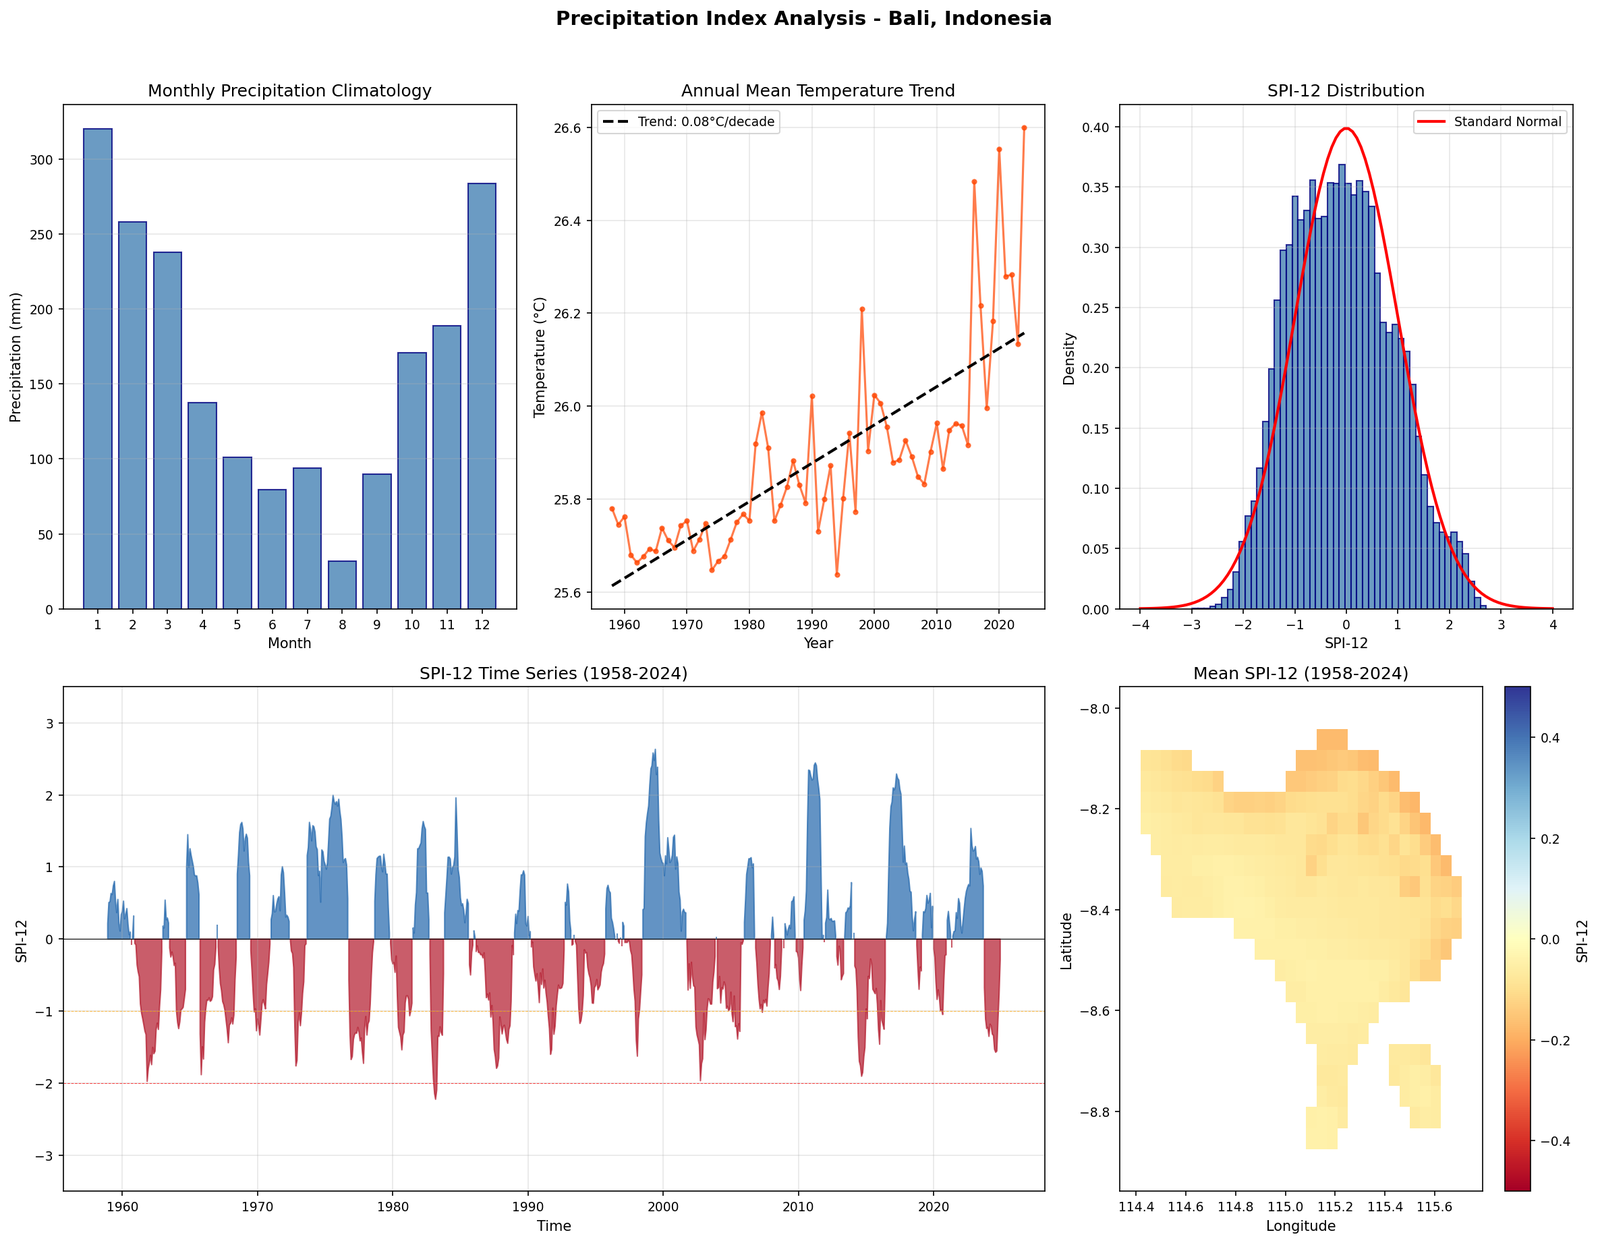
A worked example for Bali: rainfall climatology, temperature trend, the SPI-12 distribution against a standard normal, the full series, and the spatial mean

A worked example for Bali: rainfall climatology, temperature trend, the SPI-12 distribution against a standard normal, the full series, and the spatial mean

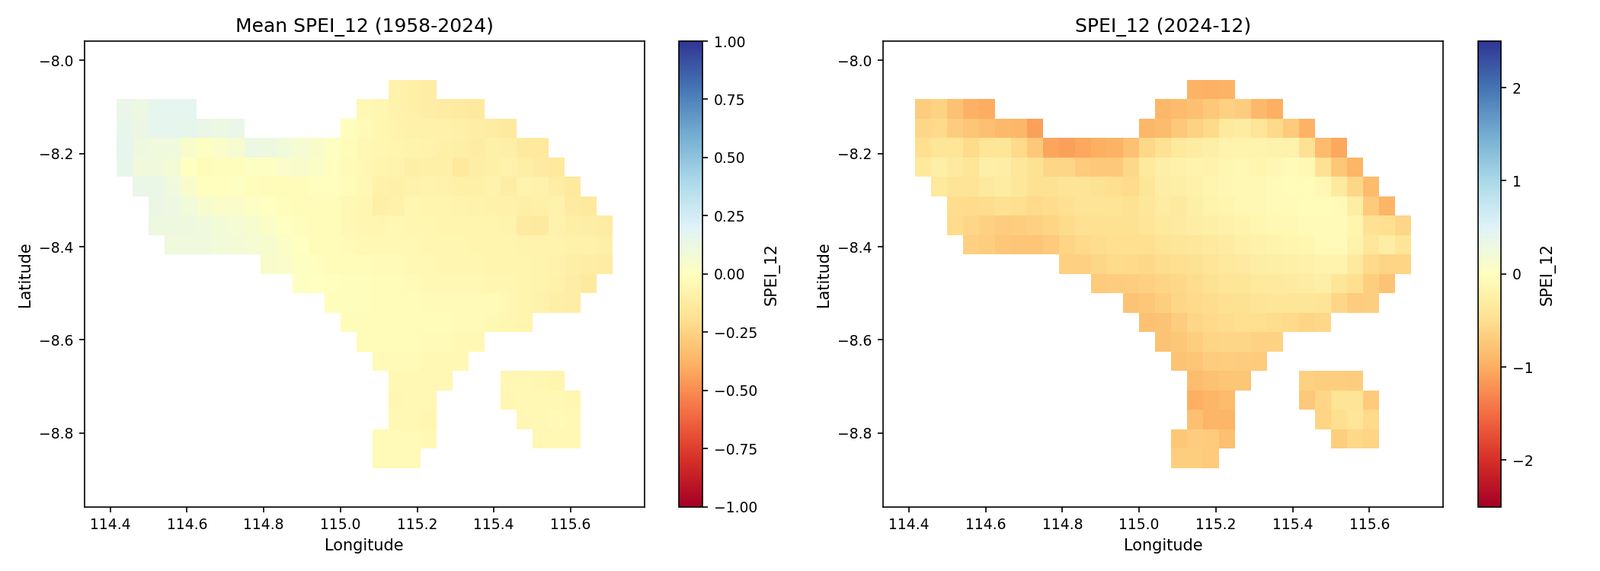
Mean SPEI-12 over 1958 to 2024 next to a single month, December 2024

Mean SPEI-12 over 1958 to 2024 next to a single month, December 2024

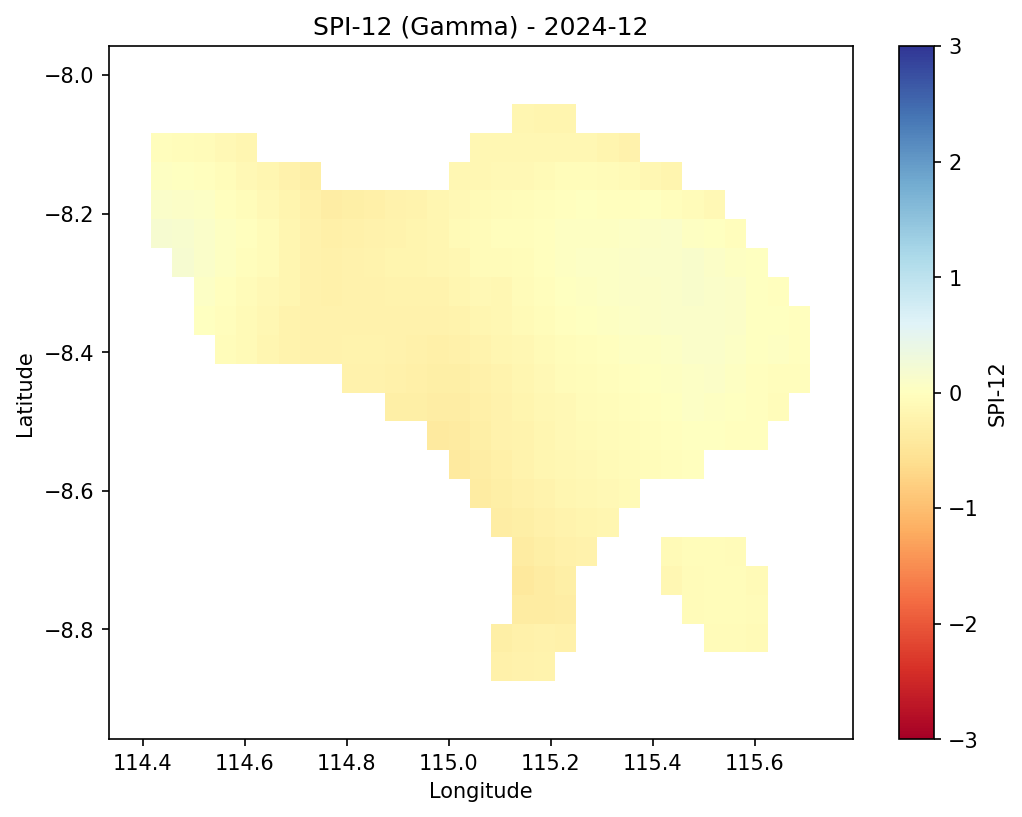
The latest month on its own, SPI-12 fitted with Gamma for December 2024

The latest month on its own, SPI-12 fitted with Gamma for December 2024

Operational mode

For monitoring, refitting the distribution every time new data arrives is both slow and wrong: the index would shift under you. Operational mode fits once over a calibration period, saves the parameters, and applies them to everything that follows.
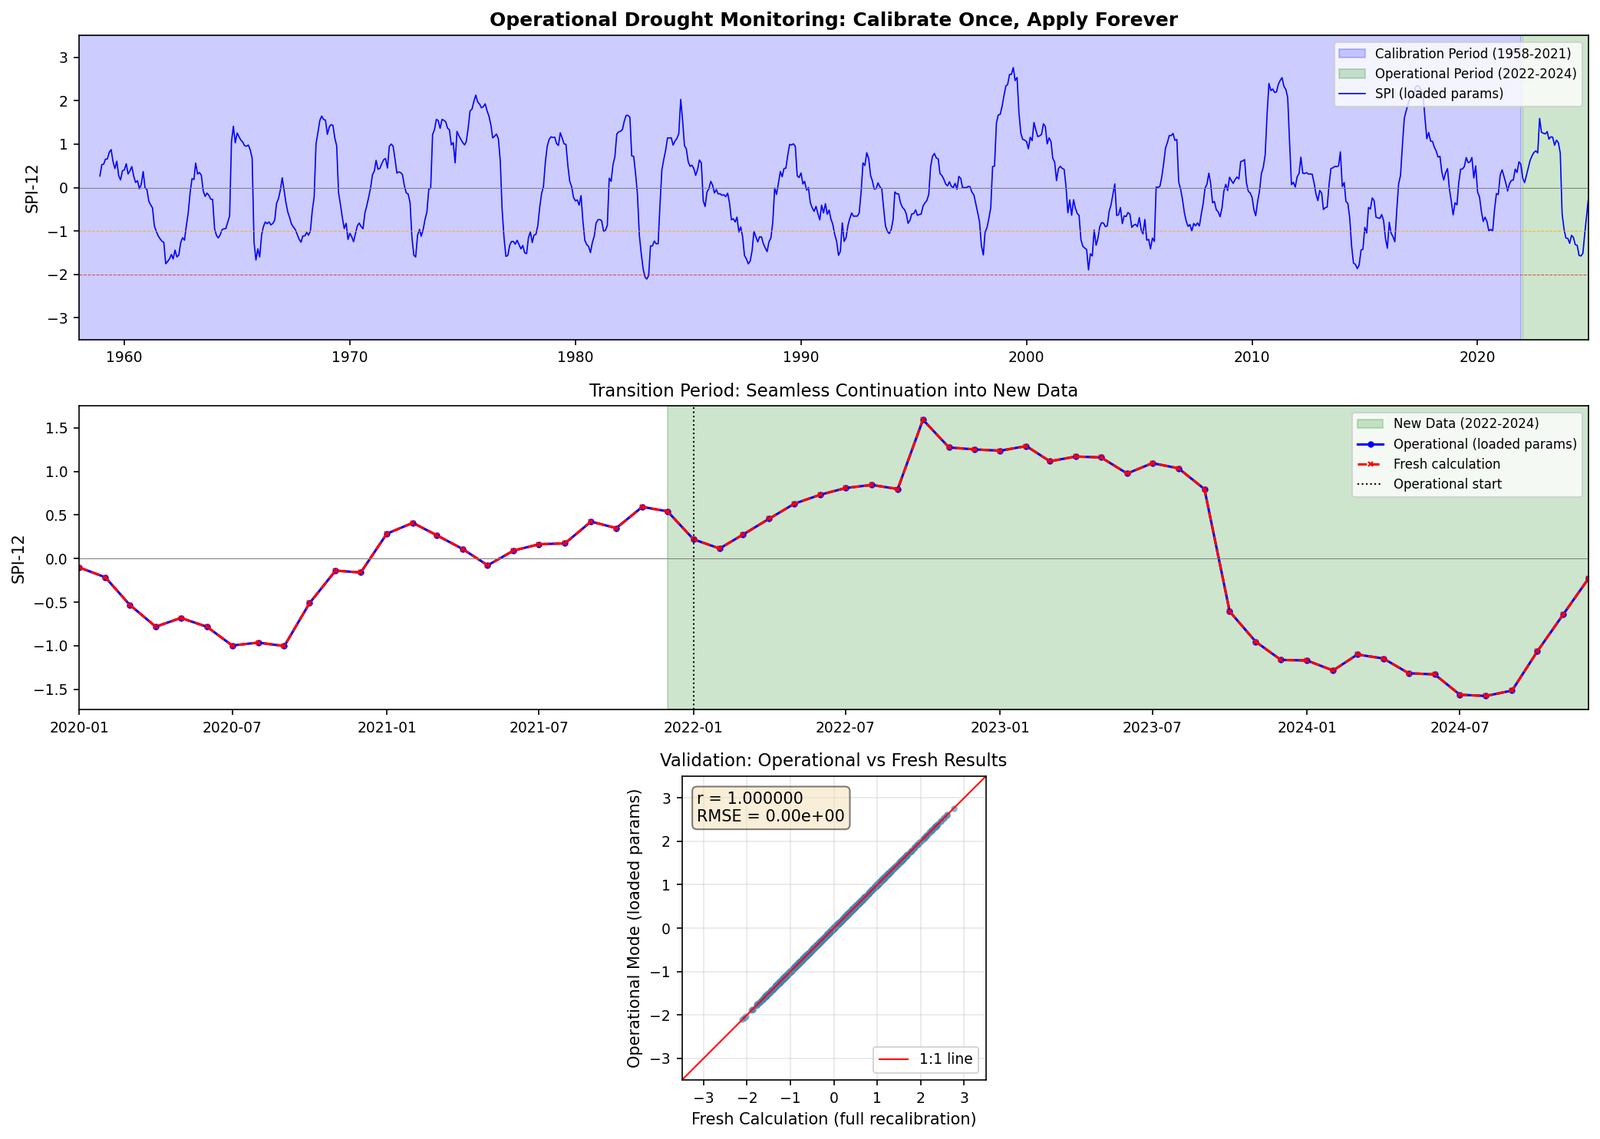
Calibrated on 1958 to 2021, then applied to 2022 to 2024. Loading saved parameters reproduces a full recalculation exactly, r = 1.0 and RMSE = 0

Calibrated on 1958 to 2021, then applied to 2022 to 2024. Loading saved parameters reproduces a full recalculation exactly, r = 1.0 and RMSE = 0

Credits

Built on climate-indices by James Adams, with additions for multi-distribution support, bidirectional event analysis, operational mode and scalable processing.

← Back to Projects

Back to top

© 2026, Benny Istanto.

Exploring Climate with GIS and Data Science, solving old problems in new ways. Turning earth observation data into actionable, life-saving insights.

Built with Quarto

  • View source
  • Report an issue

Buy Me a Coffee