30-minutes rainfall and landslide research
Jemblung Landslide - Banjarnegara 2014
Landslide occured on 12 Dec 2014 in Jemblung of Sampang village, Karangkobar sub-district, Banjarnegara district, Central Java (109.719792, -7.279643) at about 5:30 pm. The event affected settlement area with more than 300 population (53 households). Victims recorded including 15 injured, 108 death (95 bodies found and 13 lost).
Two days prior to the landslide (10–11 Dec), rainfall intensity in the area had been very high, but as the area isnt located near ground weather station, records aren’t available.
Recent development in opendata allows more access to high resolution climate/weather data and to computing platform that allows users to run geospatial analysis in the cloud. This leads to further exploration like never before.
Open access to 30 mins temporal rainfall data at Google Earth Engine platform provided detail information on rainfall intensity during 10–11 Dec 2014 prior to the landslide in Banjarnegara. Such information help advancing research on rainfall model or identification of threshold for extreme rainfall that could trigger a landslide.
The steps below describe how to extract 30-minute rainfall from NASA GPM-IMERG, based on point location and convert it into CSV file using Google Earth Engine code editor.
Step 1: Define a point of interest as a landslide location.
Step 2: Choose date when landslide was occurred
Step 3: Import NASA GPM IMERG 30 minute data and calculate accumulation for 10days.
Step 4: Extract the rainfall value as time-series data
[caption id=“” align=“alignnone” width=“2500”]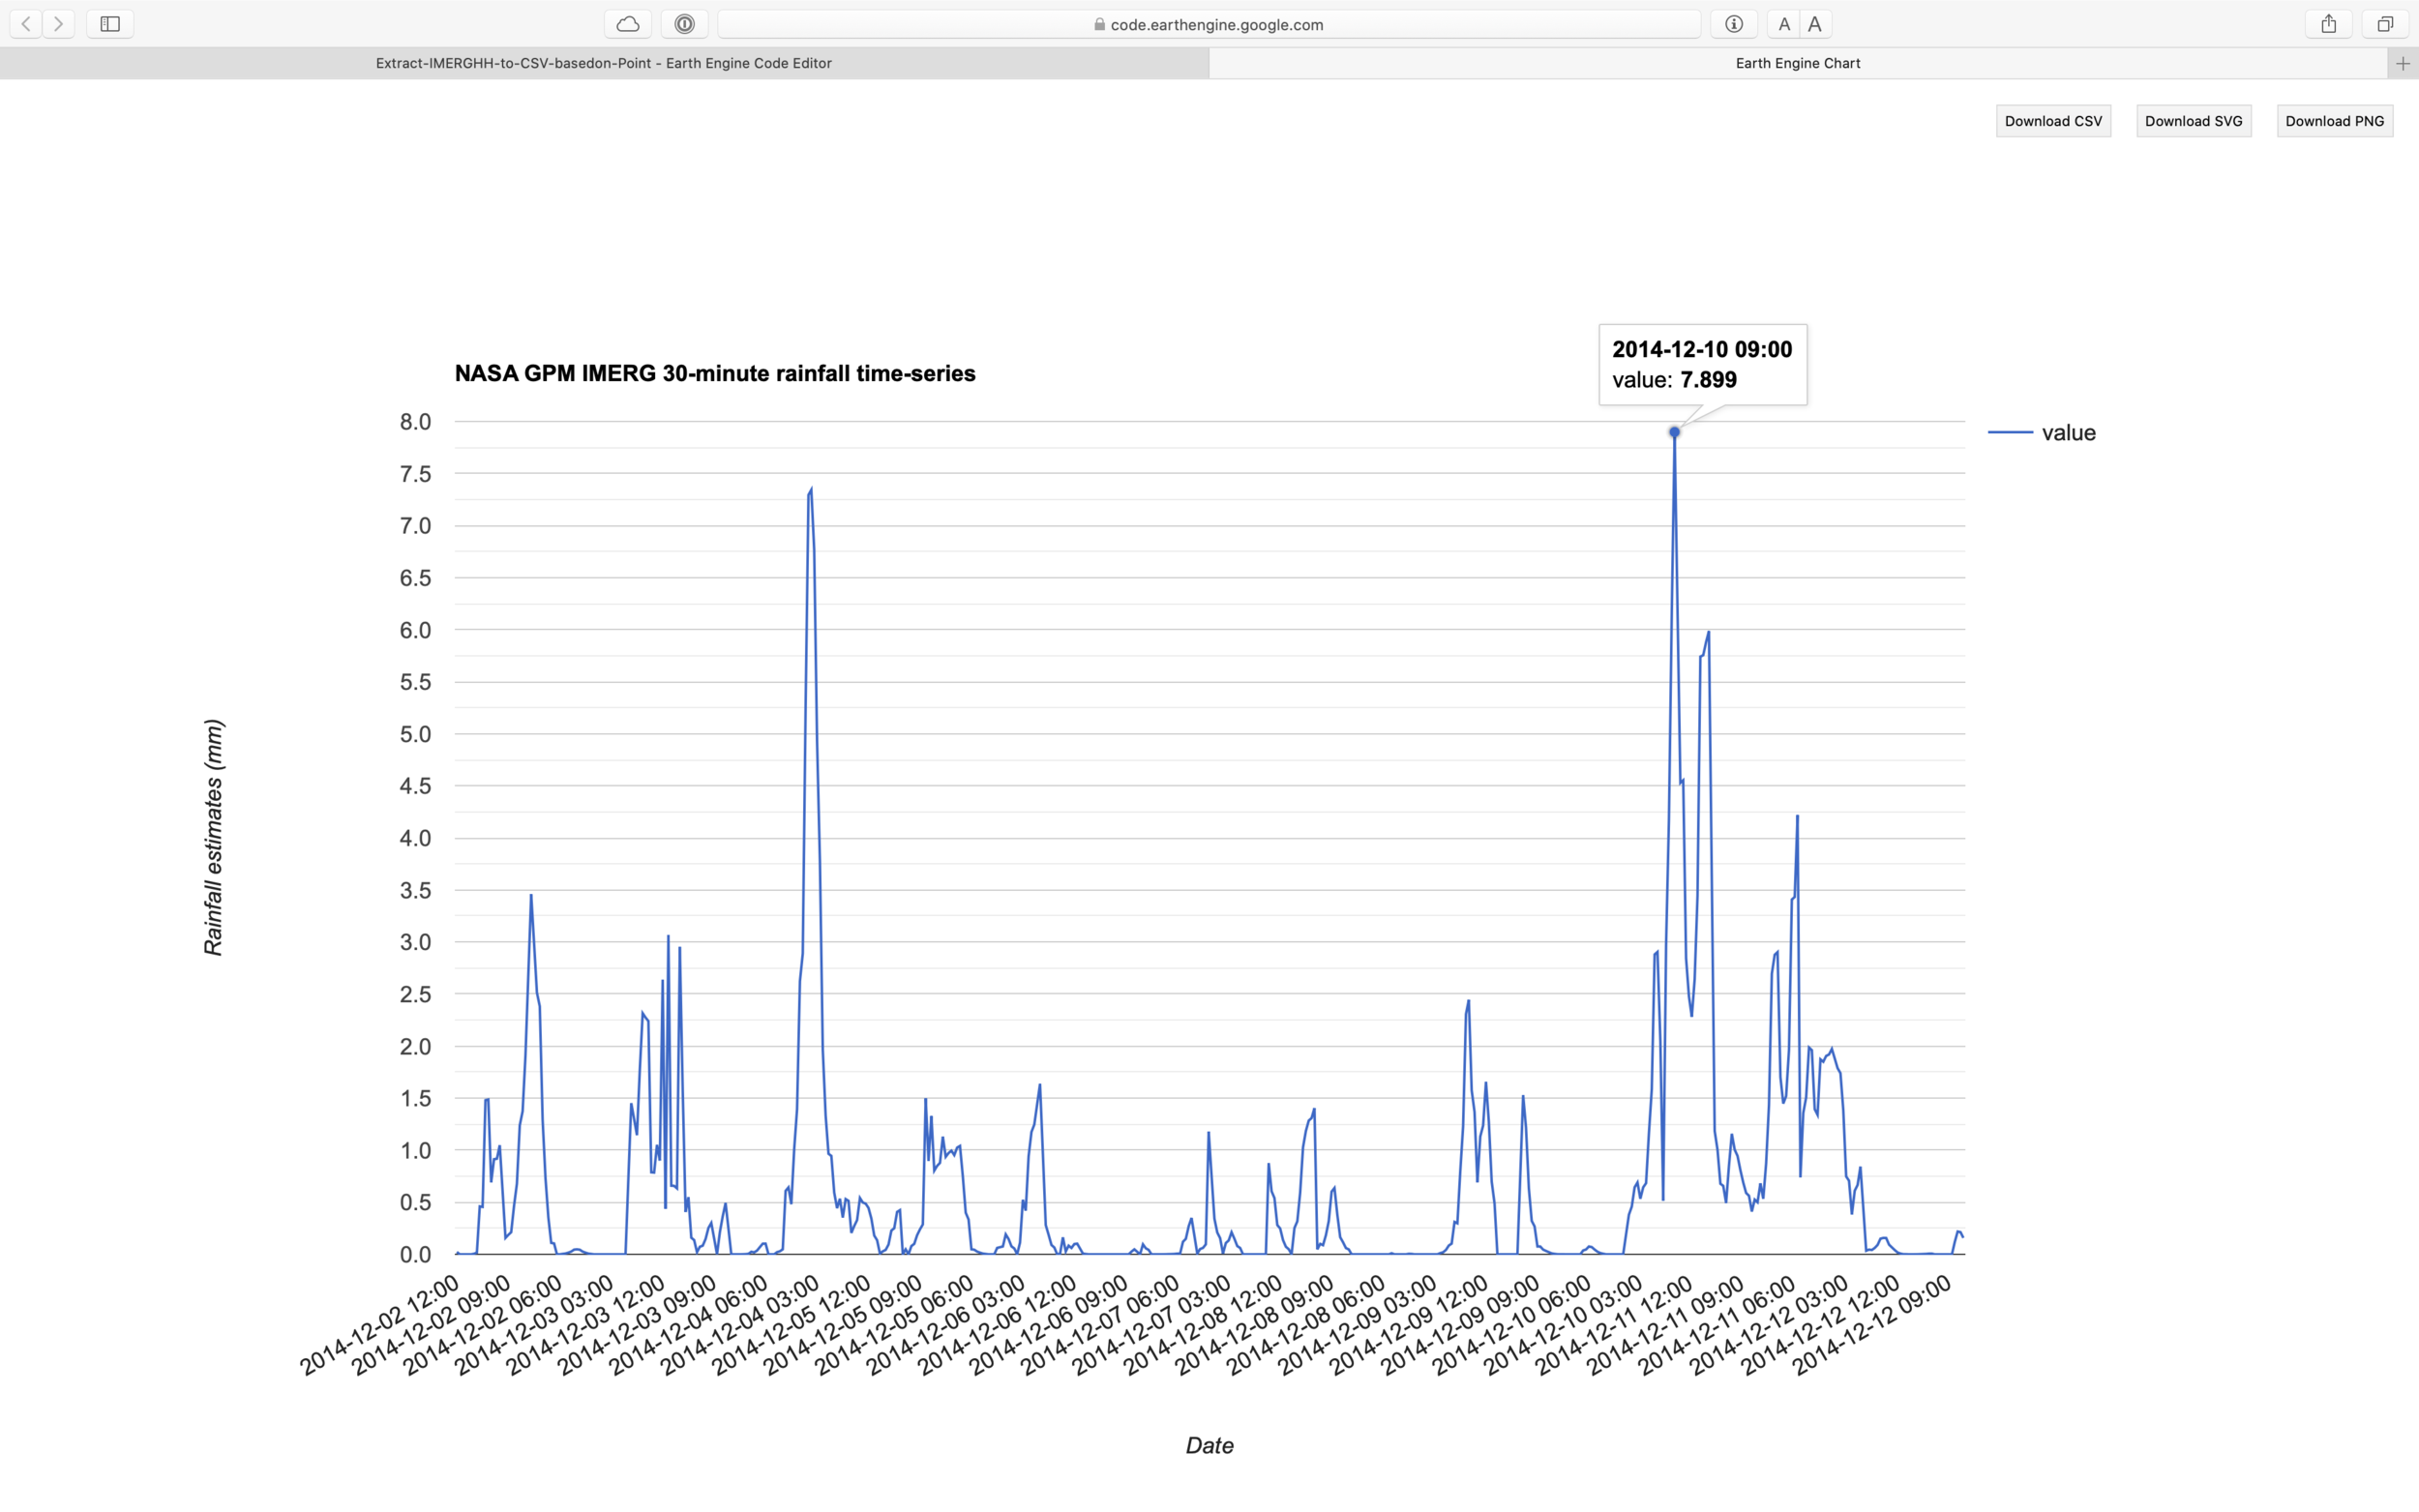 Figure 1. Chart of time series data generated using above script. [/caption]
Step 5: Extract the rainfall value as accumulation data
[caption id=“” align=“alignnone” width=“2500”]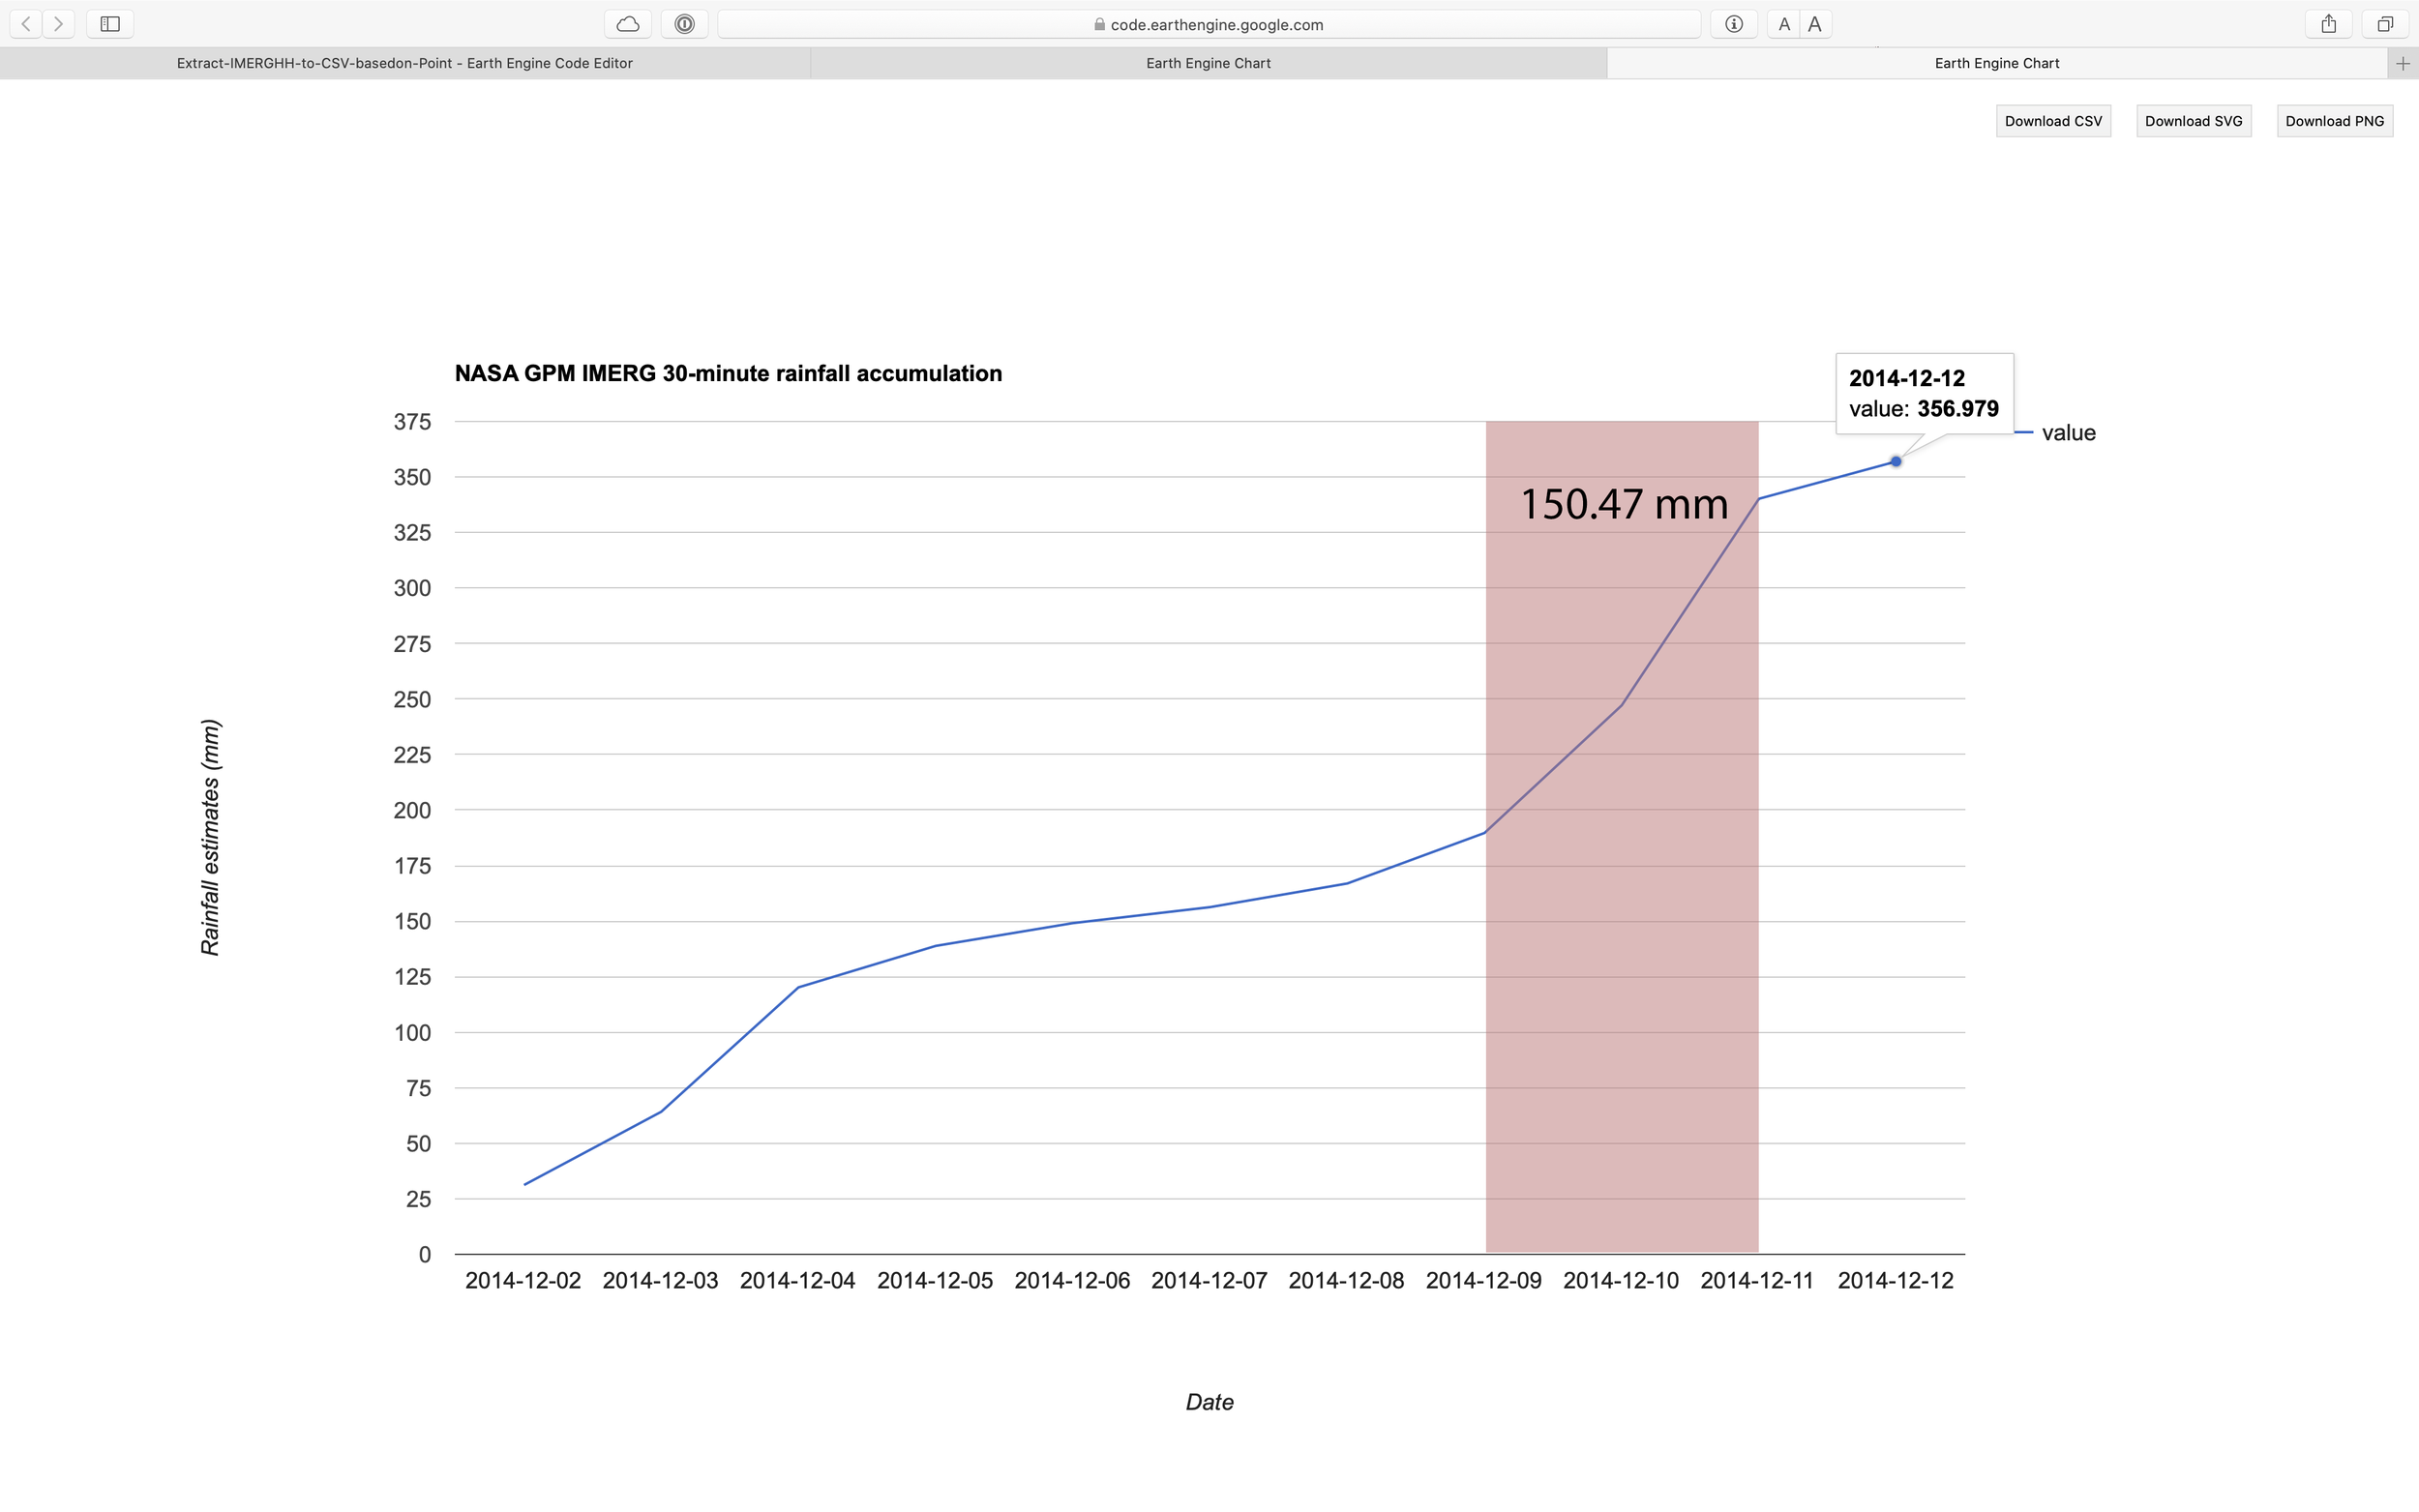 Figure 2. Chart of accumulation data generated using above script. 2 days before the event, the area receiving rainfall around 150mm. [/caption]
Step 6: Visualise time-series data as a chart
Step 7: Visualise accumulation data as a chart
Step 8: Create visualisation paramaters for rainfall and add it into canvas
Step 9: Export the data to Google Drive as a CSV file.
[caption id=“” align=“alignnone” width=“2500”]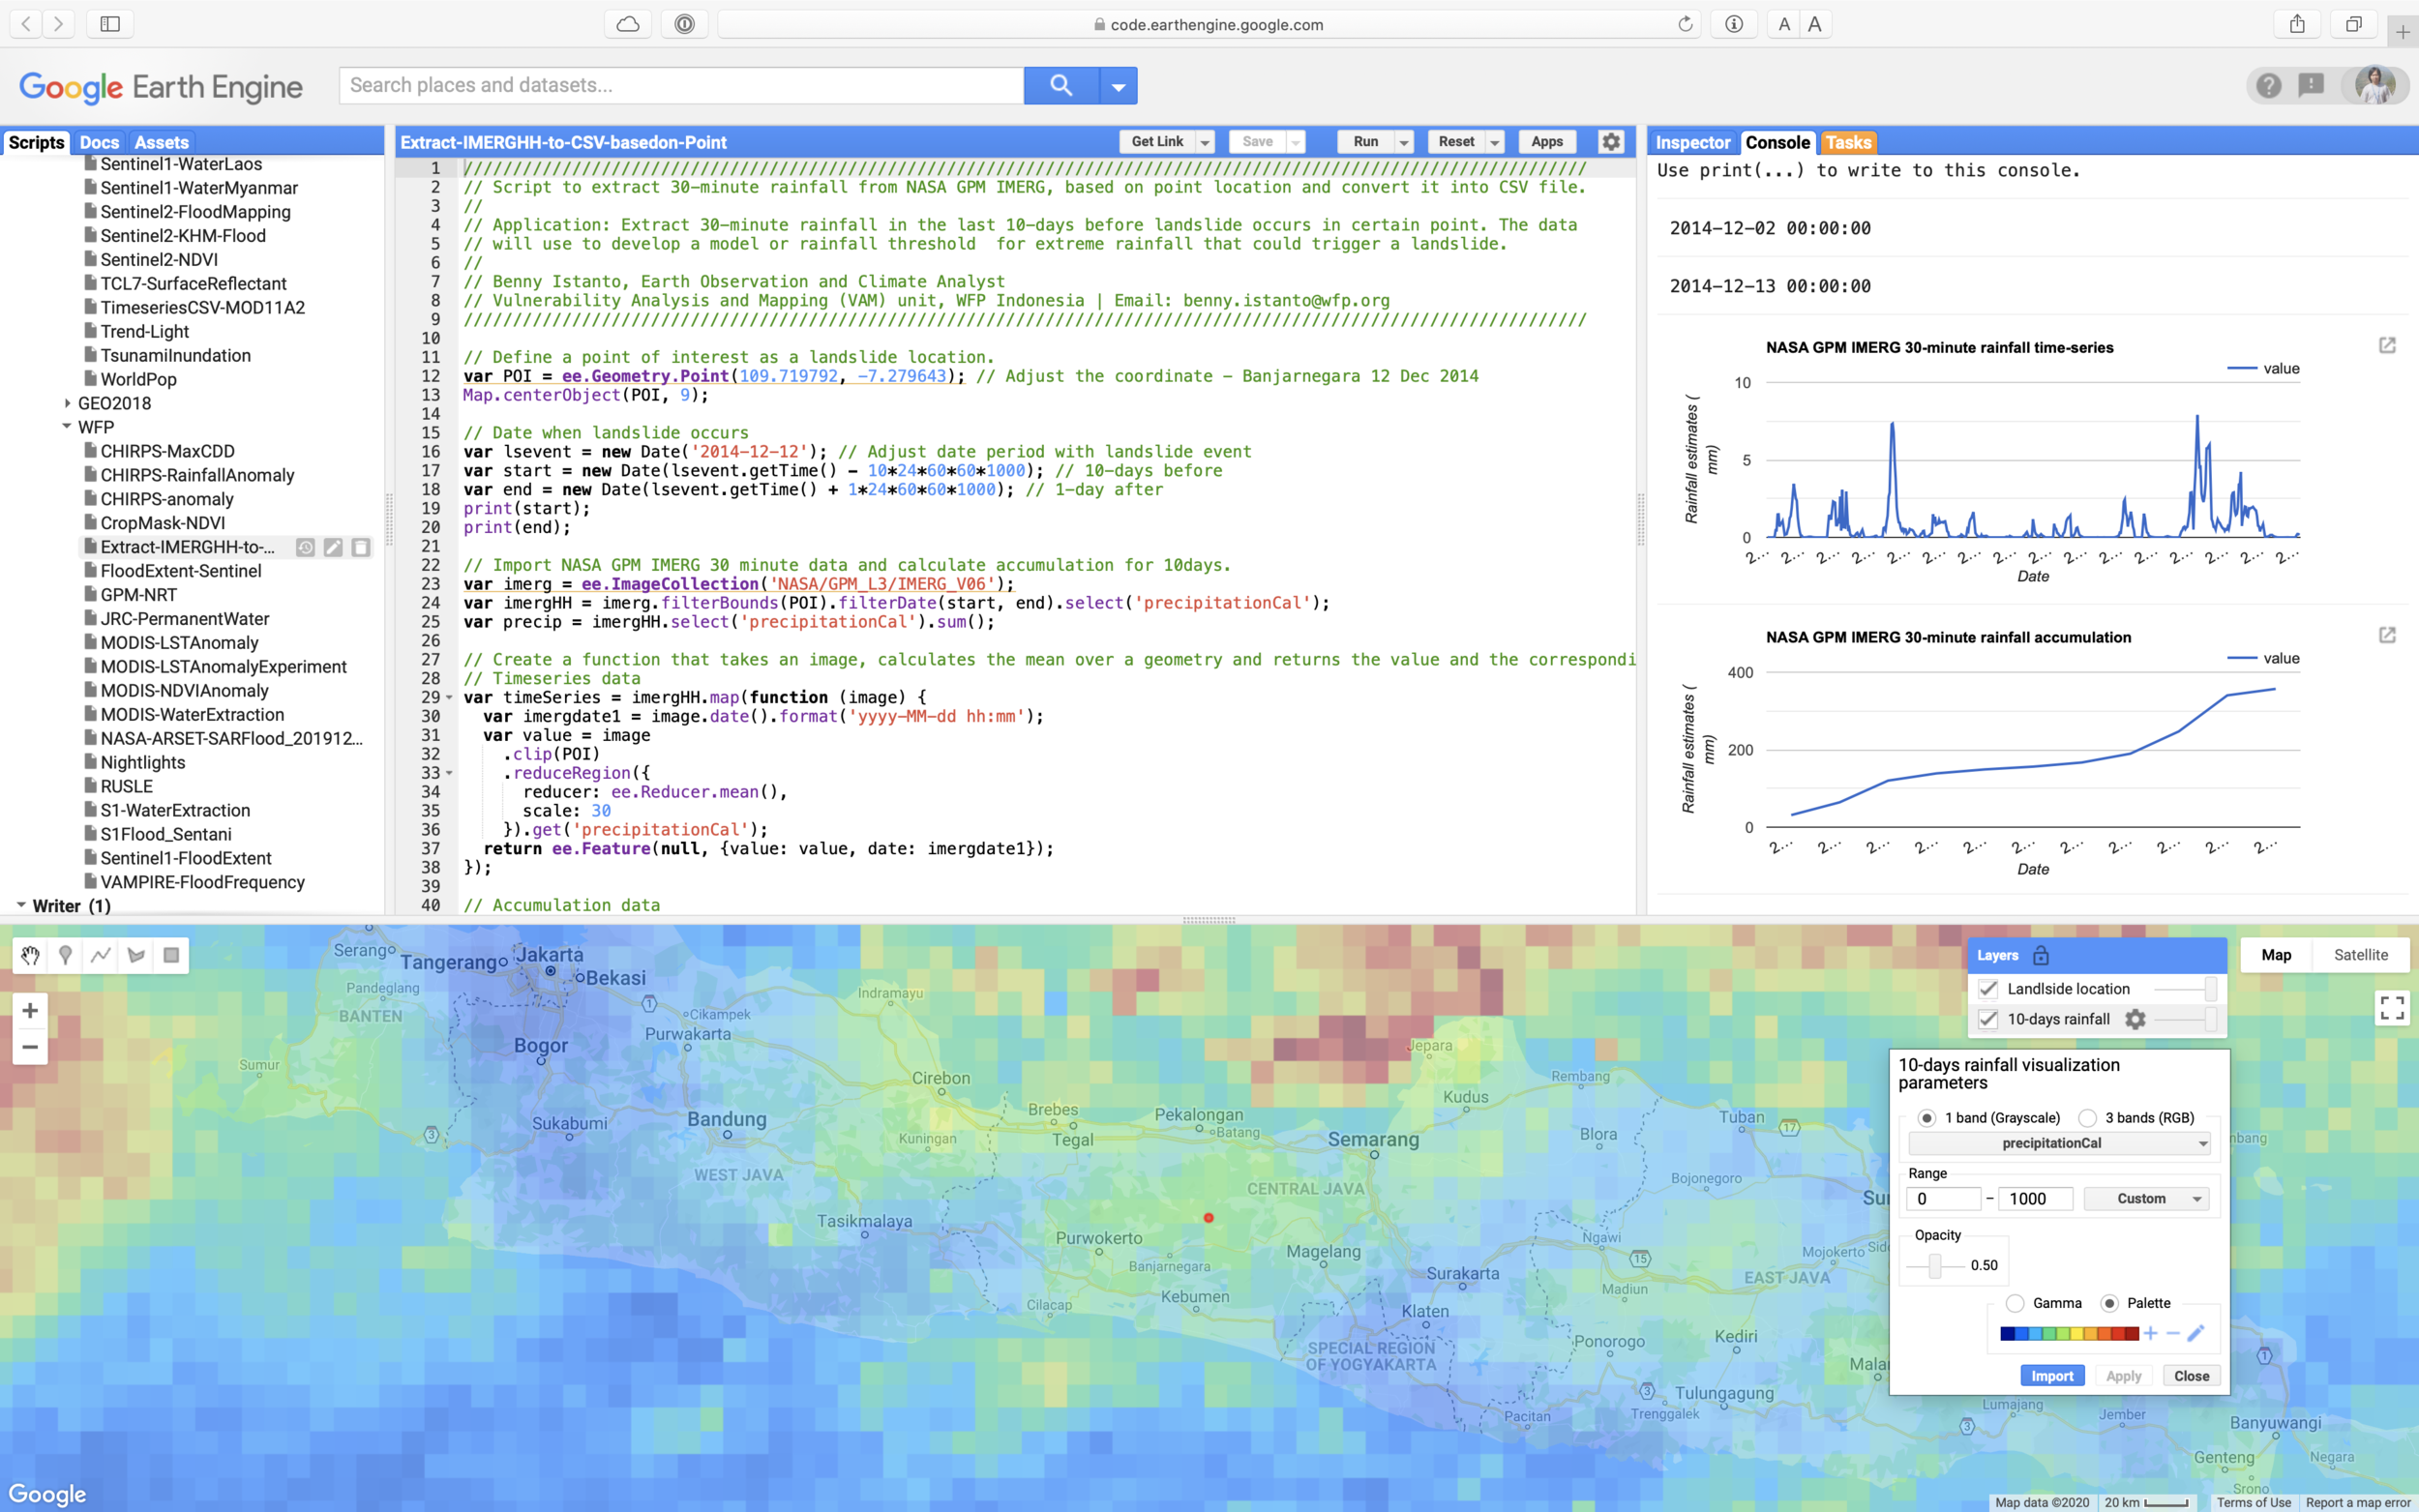 Figure 3. Google Earth Engine user interface [/caption]
Full script here
To do:
- Get NASA Global Landslide Catalog from here
- Create Landslide list (OBJECTID, Lon, Lat, Date YYYY-MM-DD)
- Enhance the script to be able read Location (Lon and Lat) and Date information from CSV GEE assets, and loop Export.table.toDrive with description based on OBJECTID