Vulnerable groups in COVID-19
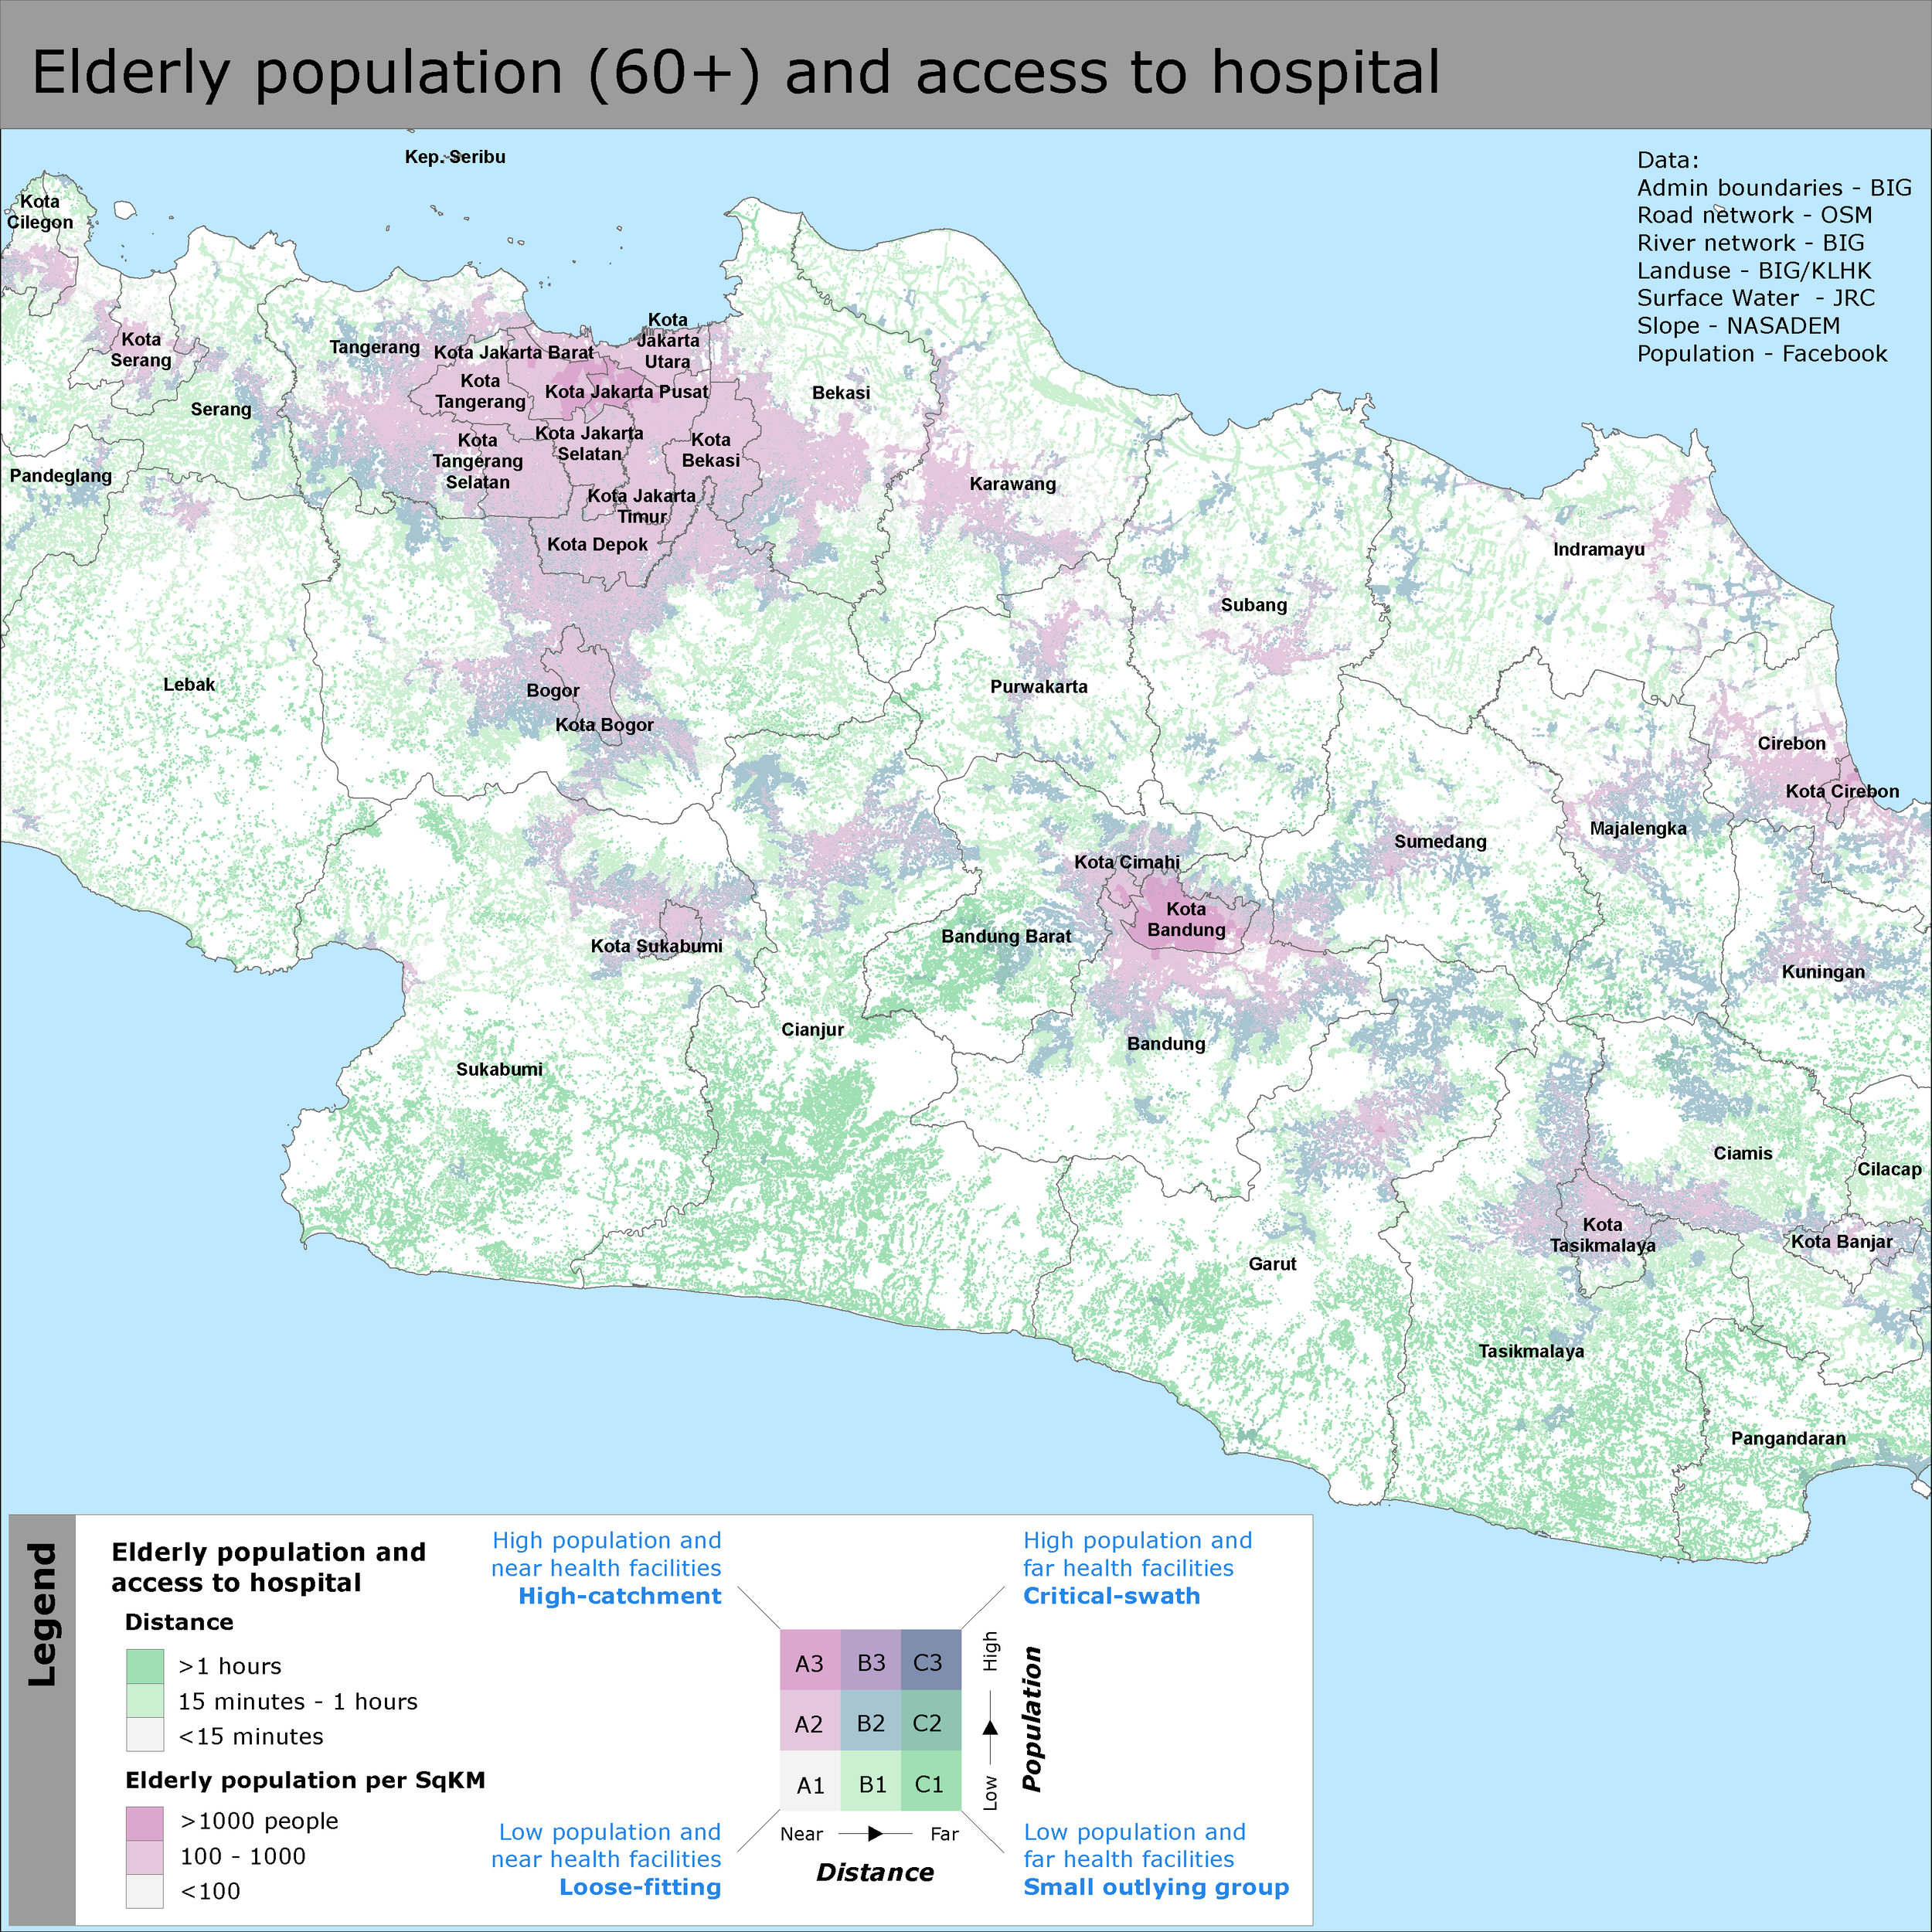
Figure 1. Elderly population (60+) and access to hospital
Good access (to markets, health centers, education) means:
Contributes to the diversification of household economies
Strengthen households’ resilience against shocks and coping capacity
Improves health status and increases standards of living
Access to health facilities.
Accessibility calculations are based on a quantification of time of travel. The approach is to obtain a gridded layer of time of travel – in short, each point in a regular grid has the value of the time it takes to travel to the nearest (pre-defined) health facilities. Once we have this time of travel output, we can derive catchment areas or quantify population living more than a given travel time away from the target locations.
Rather than deriving time of travel from a plain geographic (or Euclidean) distance and assuming a fixed travel speed, the method described here allows us to account for the different speeds of travel that various surfaces allow (mountain forest versus flat open ground, a highway versus single track) as well as any barriers that might encounter (national borders, rivers, mountains) and derive the time it would take to travel along the most economical path. Economical here in the sense of the one that takes the shortest time to complete.
The modelling of travel time starts by deriving a general travel speed, over both roads and terrain. The calculation of this travel speed accounts for factors such as the road quality, the type of land cover; the topographical slope acts as a speed-reducing factor while obstructions (rivers, borders, road closures) that prevent or delay travel can also be introduced.
This is converted to a cost or friction surface (cost in terms of the time it takes to move from one grid cell to the next) which is input to a cost-distance function that derives travel time to the target locations from the accumulation of these travel costs.
The underlying assumption here is that we are dealing with mixed modes of transportation. Given any arbitrary location away from a road, travel proceeds at walking speed (modulated by land cover and slope) until a road is reached, at which time travel proceeds at vehicle speed set as a function of road quality. In any case the model is trivially adapted to walking travel only by adopting suitable travel speeds.
Reference: http://technicalconsortium.org/wp-content/uploads/2014/05/Accessibility-Mapping_RuralPoverty.pdf
Above analysis is based on raster data with a pixel size of 30m, an area with no color means no population. The map symbology inspired from Bivariate Choropleth Map from NASA's cartographer Joshua Stevens.
If we define high vulnerability as an area with a high number of elderly people but difficult access to health facilities (in this case Category B3, C2, and C3), then around 250,000 elderly or equal to 7% of the total elderly in West Java are belong to this group.
Elderly population and demographic estimates data used in this analysis came from Facebook Population Density Maps and available free for public at Humanitarian Data Exchange platform.
If you are curious about how to analyze it, please read my old post on accessibility models.

