Kriging and IDW interpolation in GEE
Remote Sensing
GIS
Climate
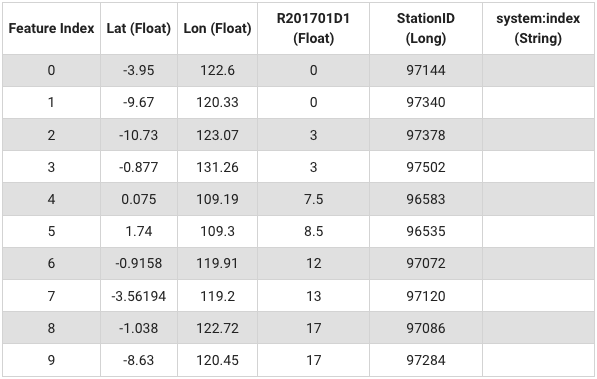
I have automatic weather station coordinates from BMKG, along with example data on precipitation accumulation for 1 - 10 Jan 2017 in csv format with column structure: Lon, Lat, Rainfall
I have automatic weather station coordinates from BMKG, along with example data on precipitation accumulation for 1 - 10 Jan 2017 in csv format with column structure: Lon, Lat, Rainfall.
I uploaded this data into GEE assets, available as Feature Collection and accessible from this address: “users/bennyistanto/datasets/shp/rainfall_201701d1”
Is it possible to do Kriging and Inverse Distance Weighting (IDW) interpolation using Google Earth Engine?
Yes, it is. Follow below script.
NoteJavascript - GEE Interpolation
// Define geographic domain.
Map.setCenter(117.7, -2.5, 5.7);
// Get the country boundary mask
var chirpsMask = ee.FeatureCollection("users/bennyistanto/datasets/mask/idn_bnd_chirps_dissolve");
//Color-codes based on Color-Brewer https://colorbrewer2.org/
//---
// Visualization palette for total precipitation using SLD style
var visRainfallSLD =
'<RasterSymbolizer>' +
'<ColorMap type="ramp" extended="false" >' +
'<ColorMapEntry color="#ffffff" opacity="0.0" quantity="1" label="No Rain" />' +
'<ColorMapEntry color="#cccccc" opacity="0.7" quantity="3" label="1-3" />' +
'<ColorMapEntry color="#f9f3d5" opacity="0.7" quantity="10" label="4-10" />' +
'<ColorMapEntry color="#dce2a8" opacity="0.7" quantity="20" label="11-20" />' +
'<ColorMapEntry color="#a8c58d" opacity="0.7" quantity="30" label="21-30" />' +
'<ColorMapEntry color="#77a87d" opacity="0.7" quantity="40" label="31-40" />' +
'<ColorMapEntry color="#ace8f8" opacity="0.7" quantity="60" label="41-60" />' +
'<ColorMapEntry color="#4cafd9" opacity="0.7" quantity="80" label="61-80" />' +
'<ColorMapEntry color="#1d5ede" opacity="0.7" quantity="100" label="81-100" />' +
'<ColorMapEntry color="#001bc0" opacity="0.7" quantity="120" label="101-120" />' +
'<ColorMapEntry color="#9131f1" opacity="0.7" quantity="150" label="121-150" />' +
'<ColorMapEntry color="#e983f3" opacity="0.7" quantity="200" label="151-200" />' +
'<ColorMapEntry color="#f6c7ec" opacity="0.7" quantity="1000" label="> 200" />' +
'</ColorMap>' +
'</RasterSymbolizer>';
// Add weather station data from BMKG, dekad 1 - Jan 2017
var weatherStation = ee.FeatureCollection("users/bennyistanto/datasets/shp/rainfall_201701d1");
// Functions
// Estimate global mean from the points.
var meanStats = weatherStation.reduceColumns({
reducer: 'mean',
selectors: ['R201701D1']
});
// Estimate standard deviation (SD) from the points.
var StdStats = weatherStation.reduceColumns({
reducer: 'stdDev',
selectors: ['R201701D1']
});
// Do the interpolation
// IDW
var draftIDW = weatherStation.inverseDistance({
range: 1e6,
propertyName: 'R201701D1',
mean: meanStats.get('mean'),
stdDev: StdStats.get('stdDev'),
});
// Kriging
var draftKriging = weatherStation.kriging({
propertyName: 'R201701D1',
shape: 'exponential',
range: 1e6,
sill: 1.0,
nugget: 0.1,
maxDistance: 1e6,
reducer: 'mean',
});
// Mask result
var IDW = draftIDW.clip(chirpsMask);
var Kriging = draftKriging.clip(chirpsMask);
// Add to map
Map.addLayer(Kriging.sldStyle(visRainfallSLD), {}, 'Kriging', false);
Map.addLayer(IDW.sldStyle(visRainfallSLD), {}, 'IDW', false);
Map.addLayer(weatherStation,{},'Weather Station', true);Full link
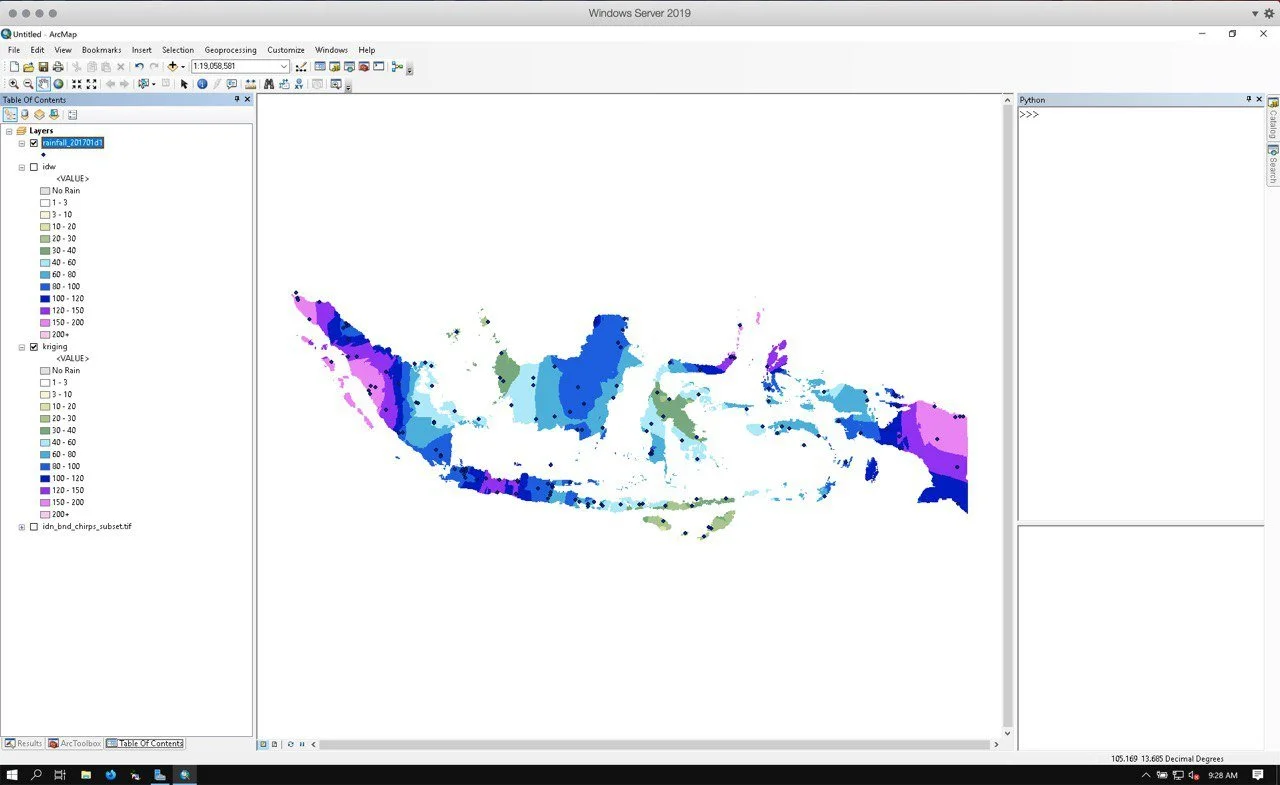
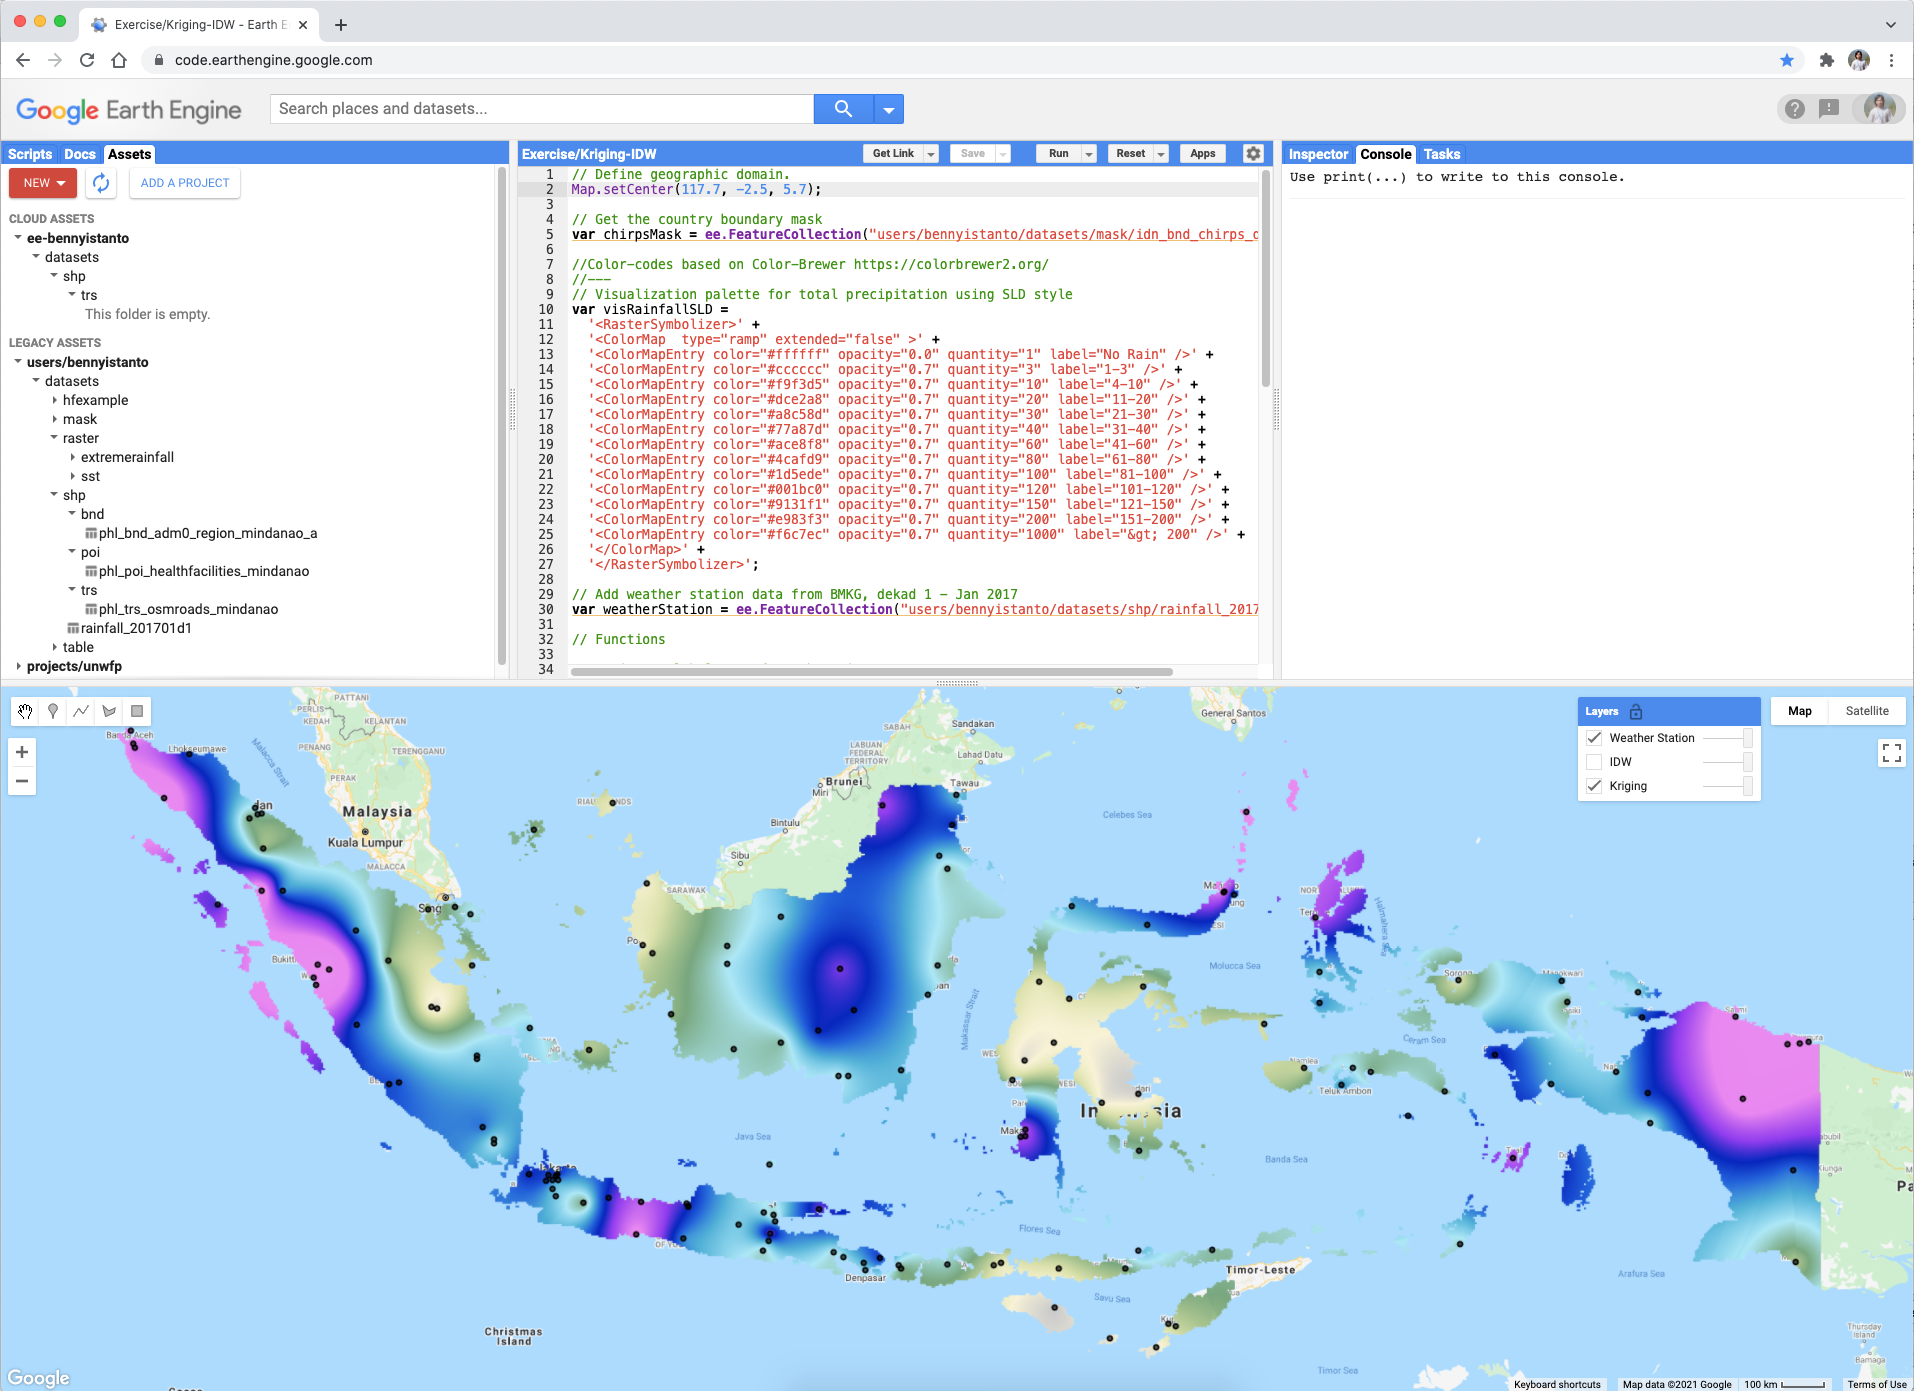
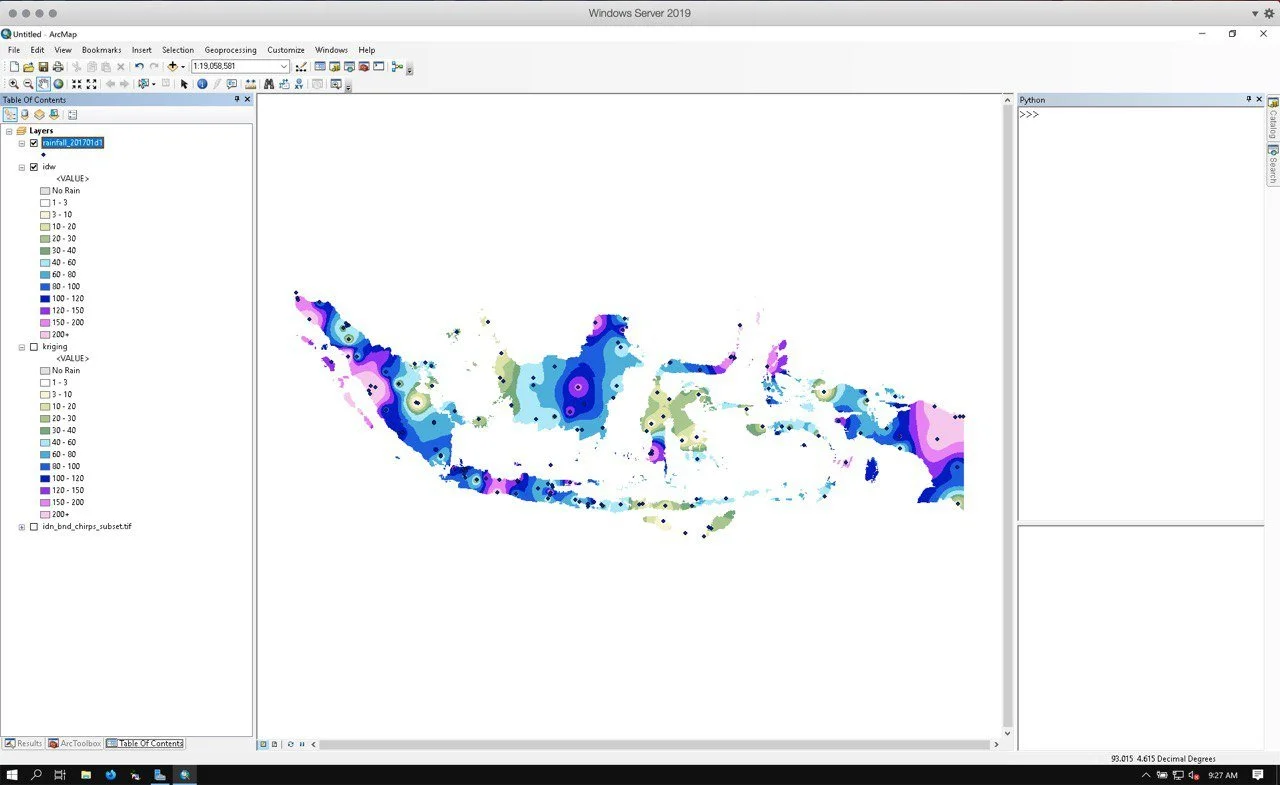
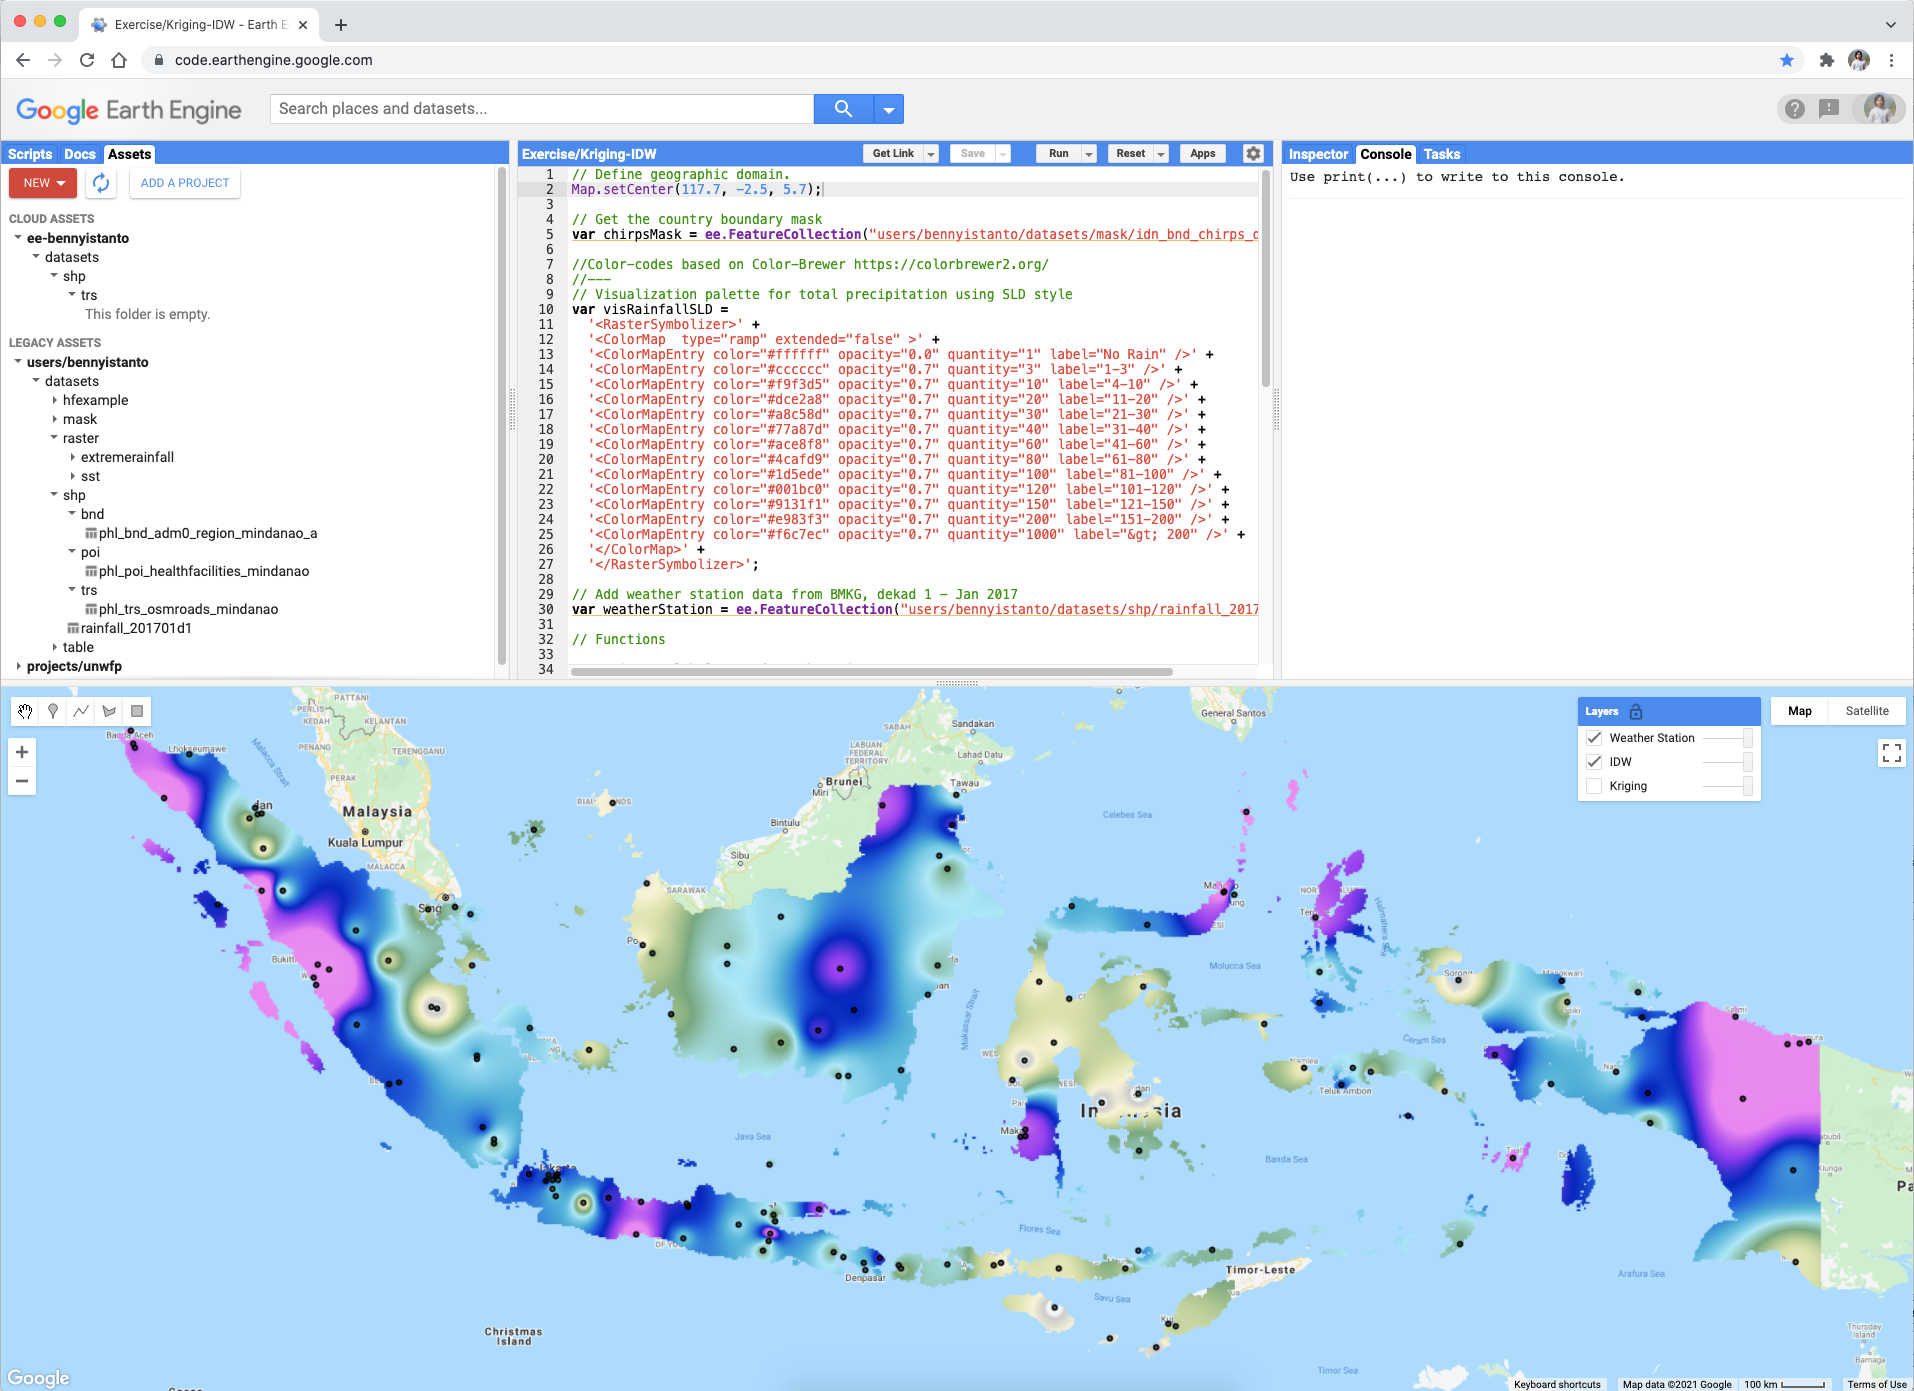
See below comparison from ArcGIS and GEE for both method. The pattern is slightly different due to GEE’s layer visualised using stretched colour while ArcGIS’s layer visualised using classified colour.