La Niña and Indonesia context
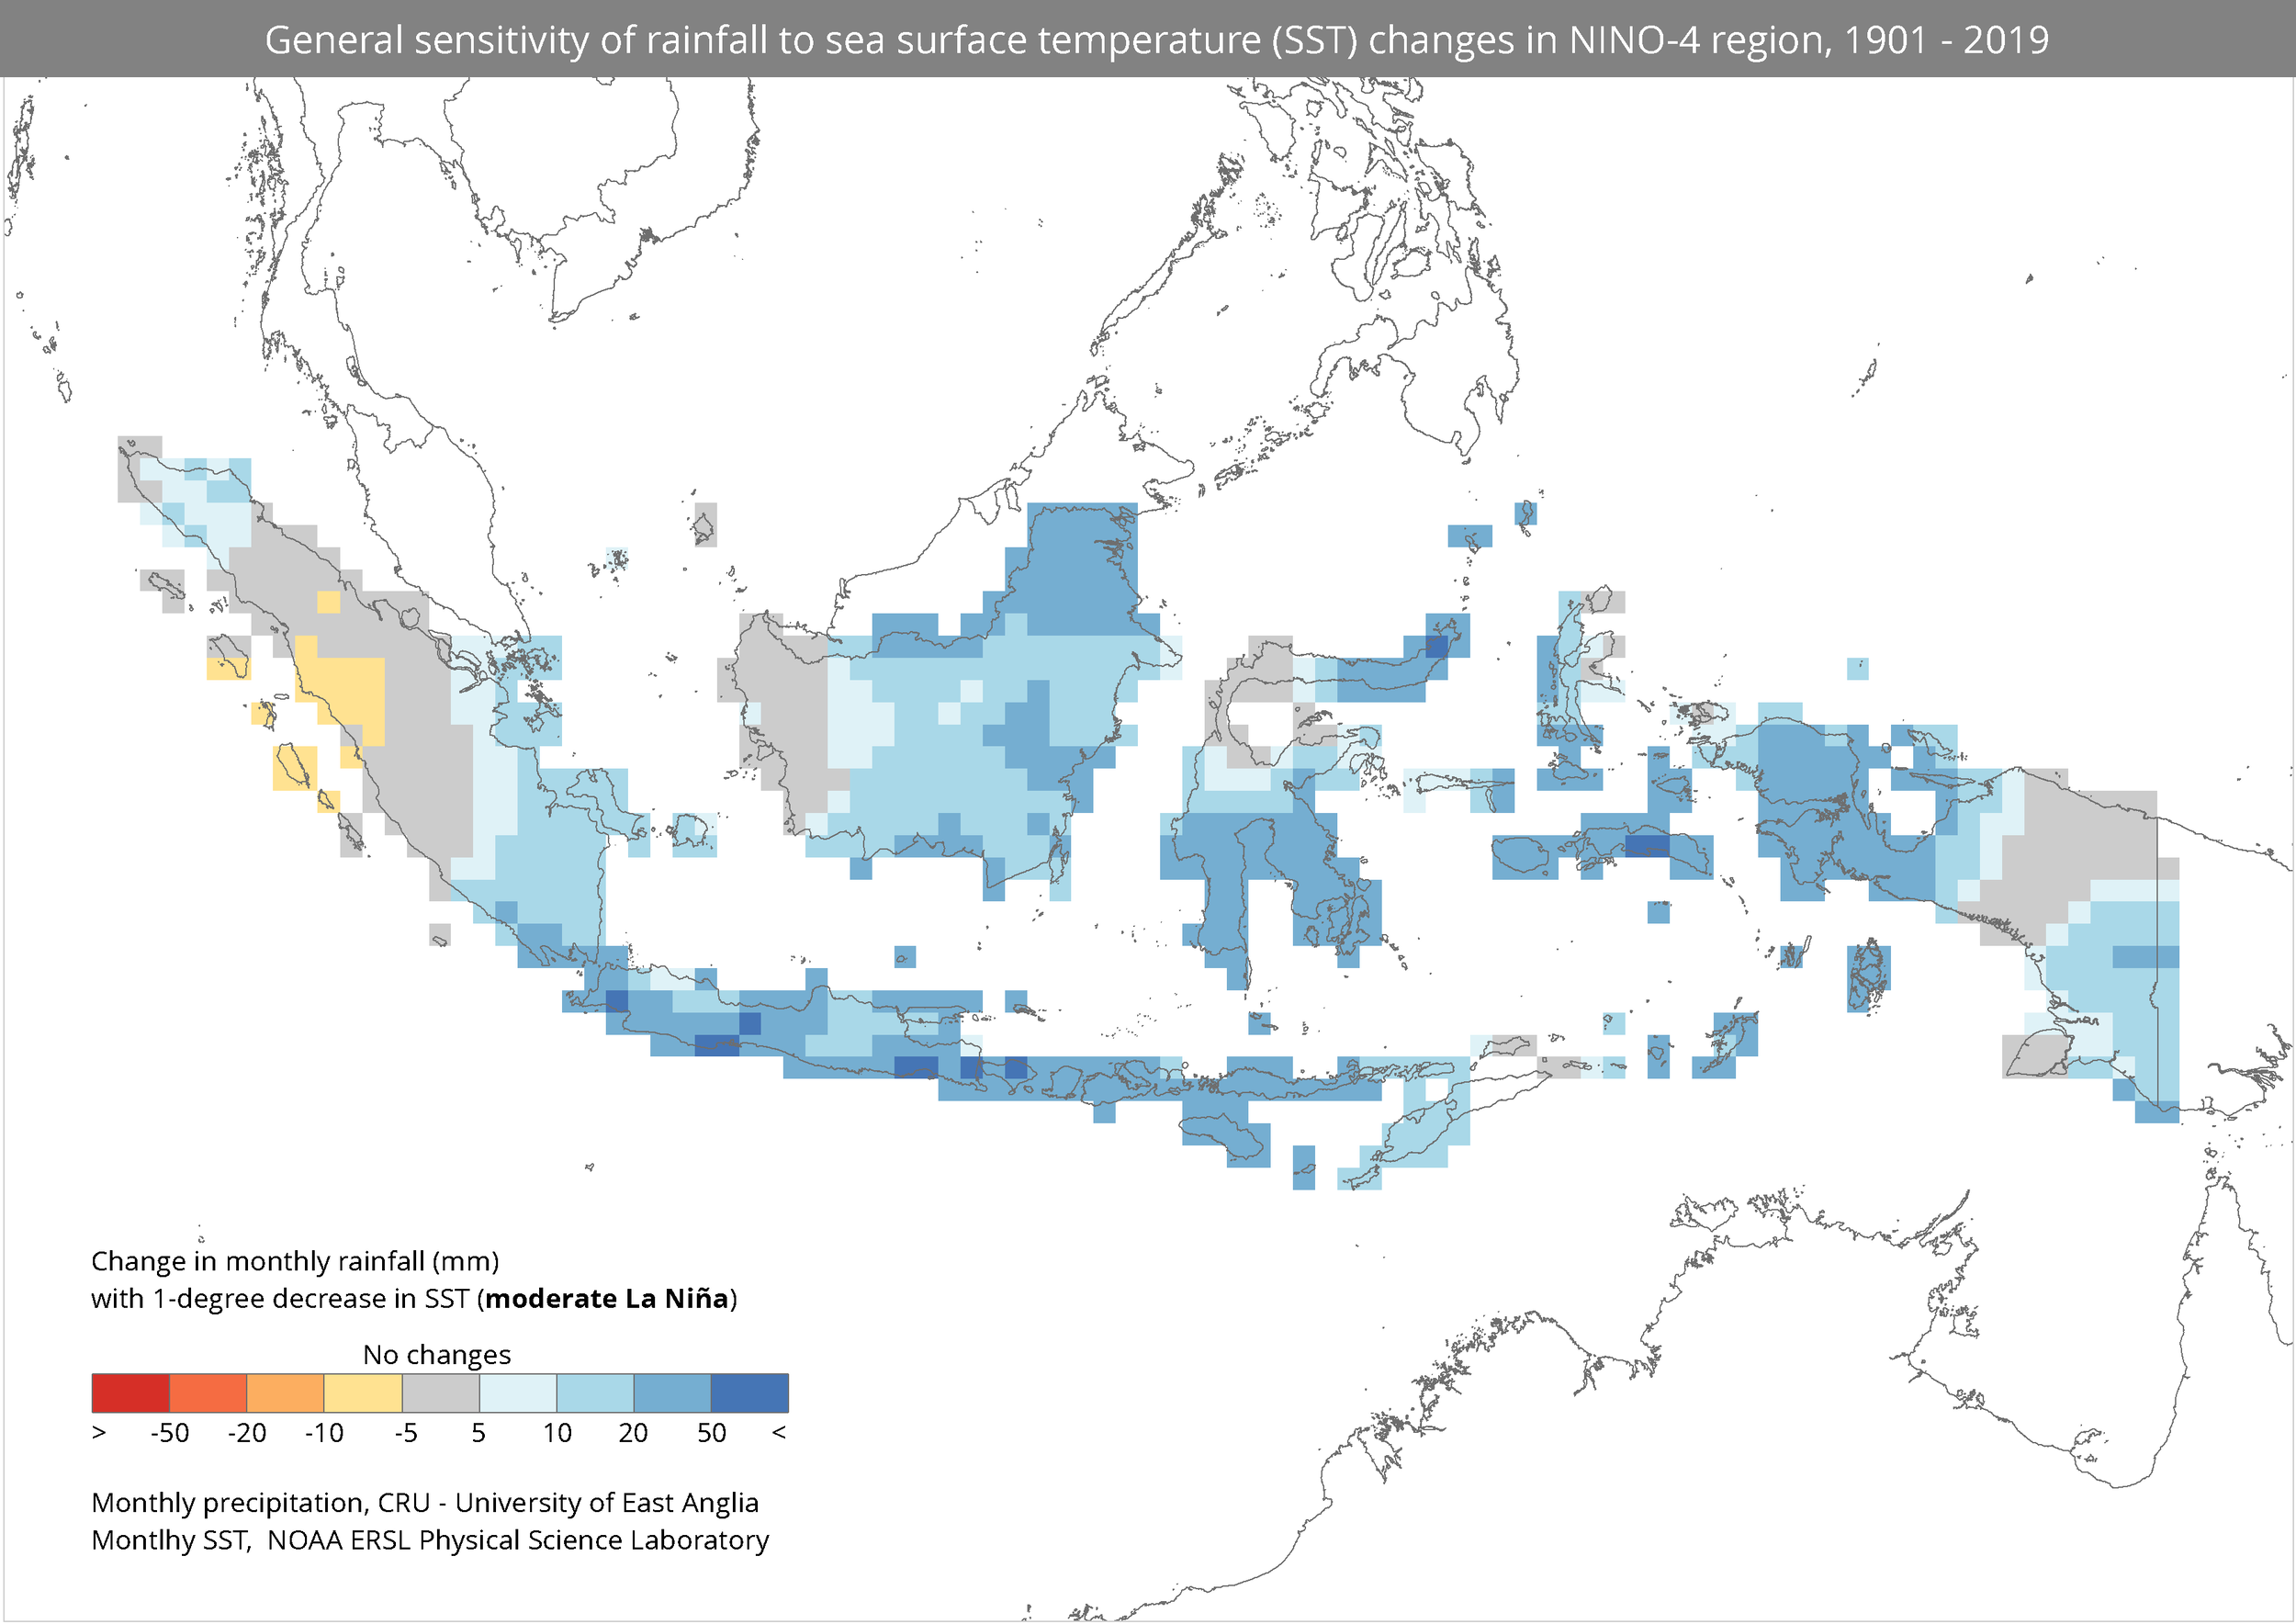
General sensitivity of rainfall in Indonesia to sea surface temperature (SST) changes in NINO-4 region.
Indonesia is affected by La Niña which is associated with a rapidly falling sea surface temperature (SST) in NINO-4 region, negatively affect rainfall in most areas of the country.
Read this post for general introduction and how to do the analysis.
According to NOAA, SST values in the Niño 3.4 region may not be the best choice for determining La Niña episodes but, for consistency, the index has been defined by negative anomalies in this area. A better choice might be the Niño 4 region, since that region normally has SSTs at or above the threshold for deep convection throughout the year.
[caption id=“” align=“alignnone” width=“580”]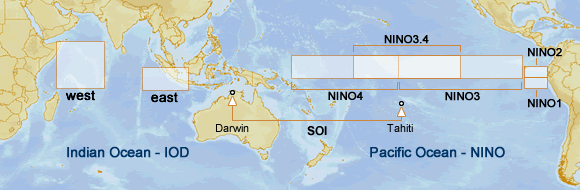 Source: http://www.bom.gov.au/climate/influences/images/map-indices.png [/caption]
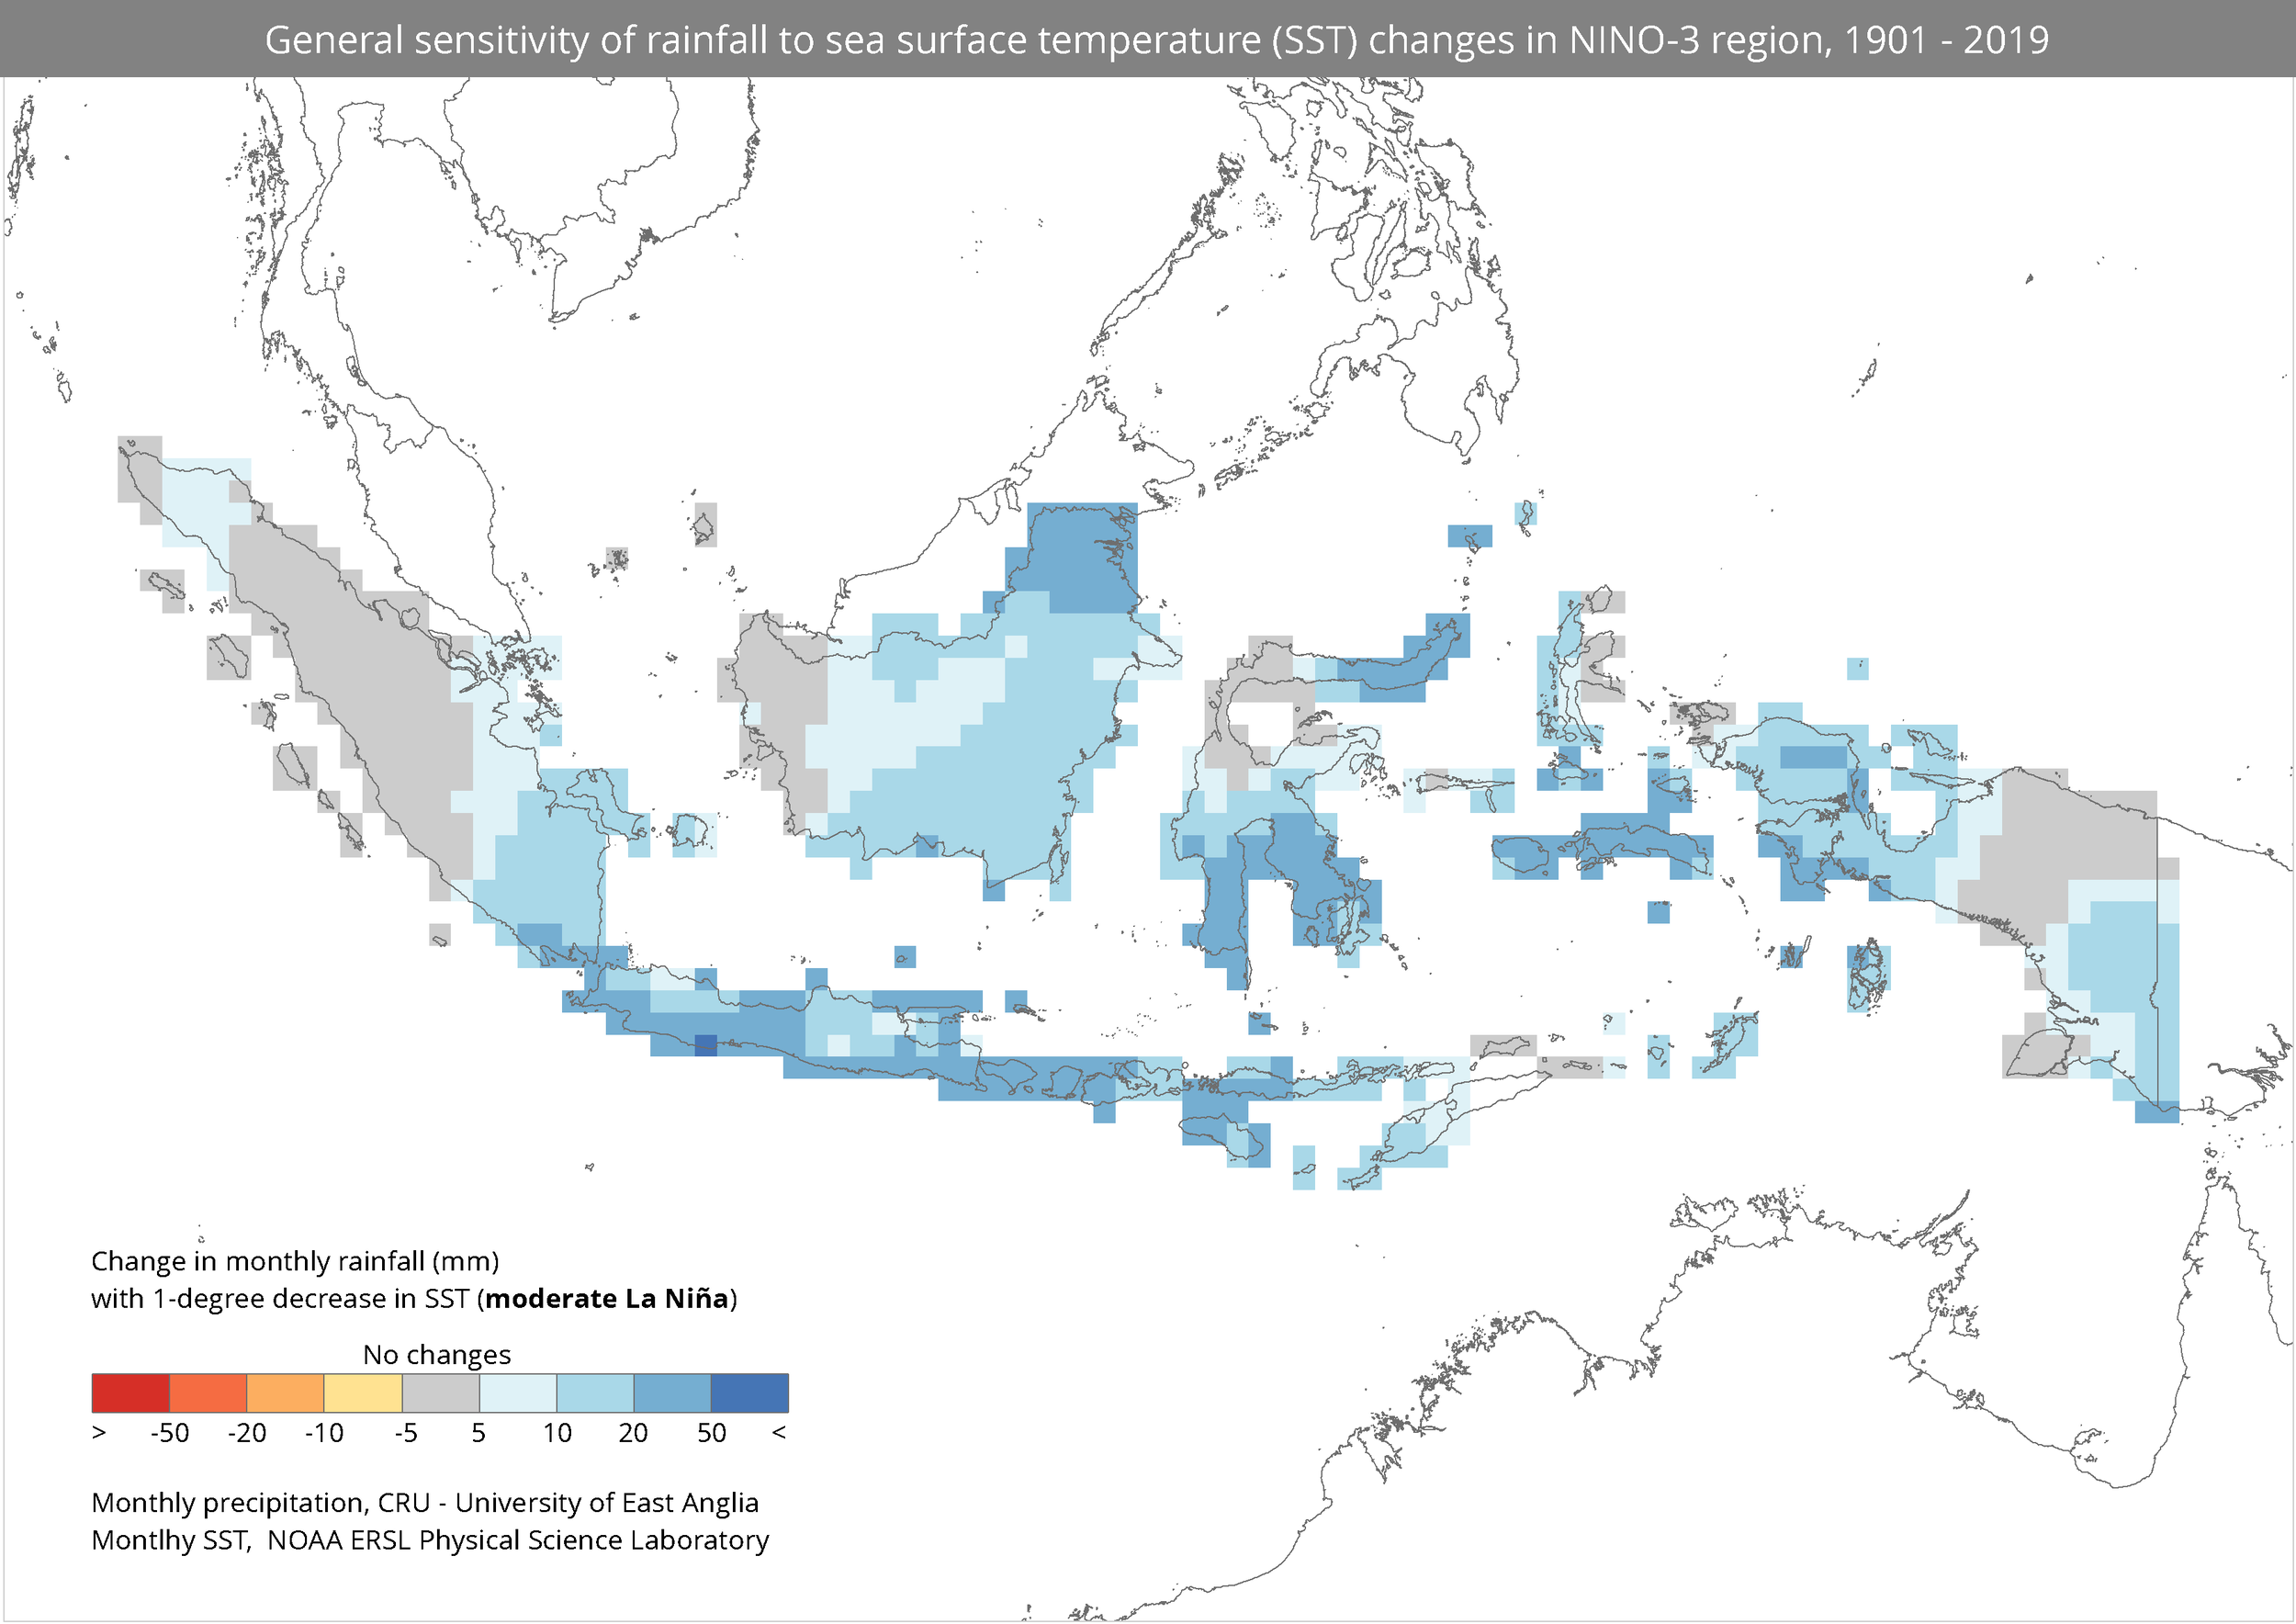
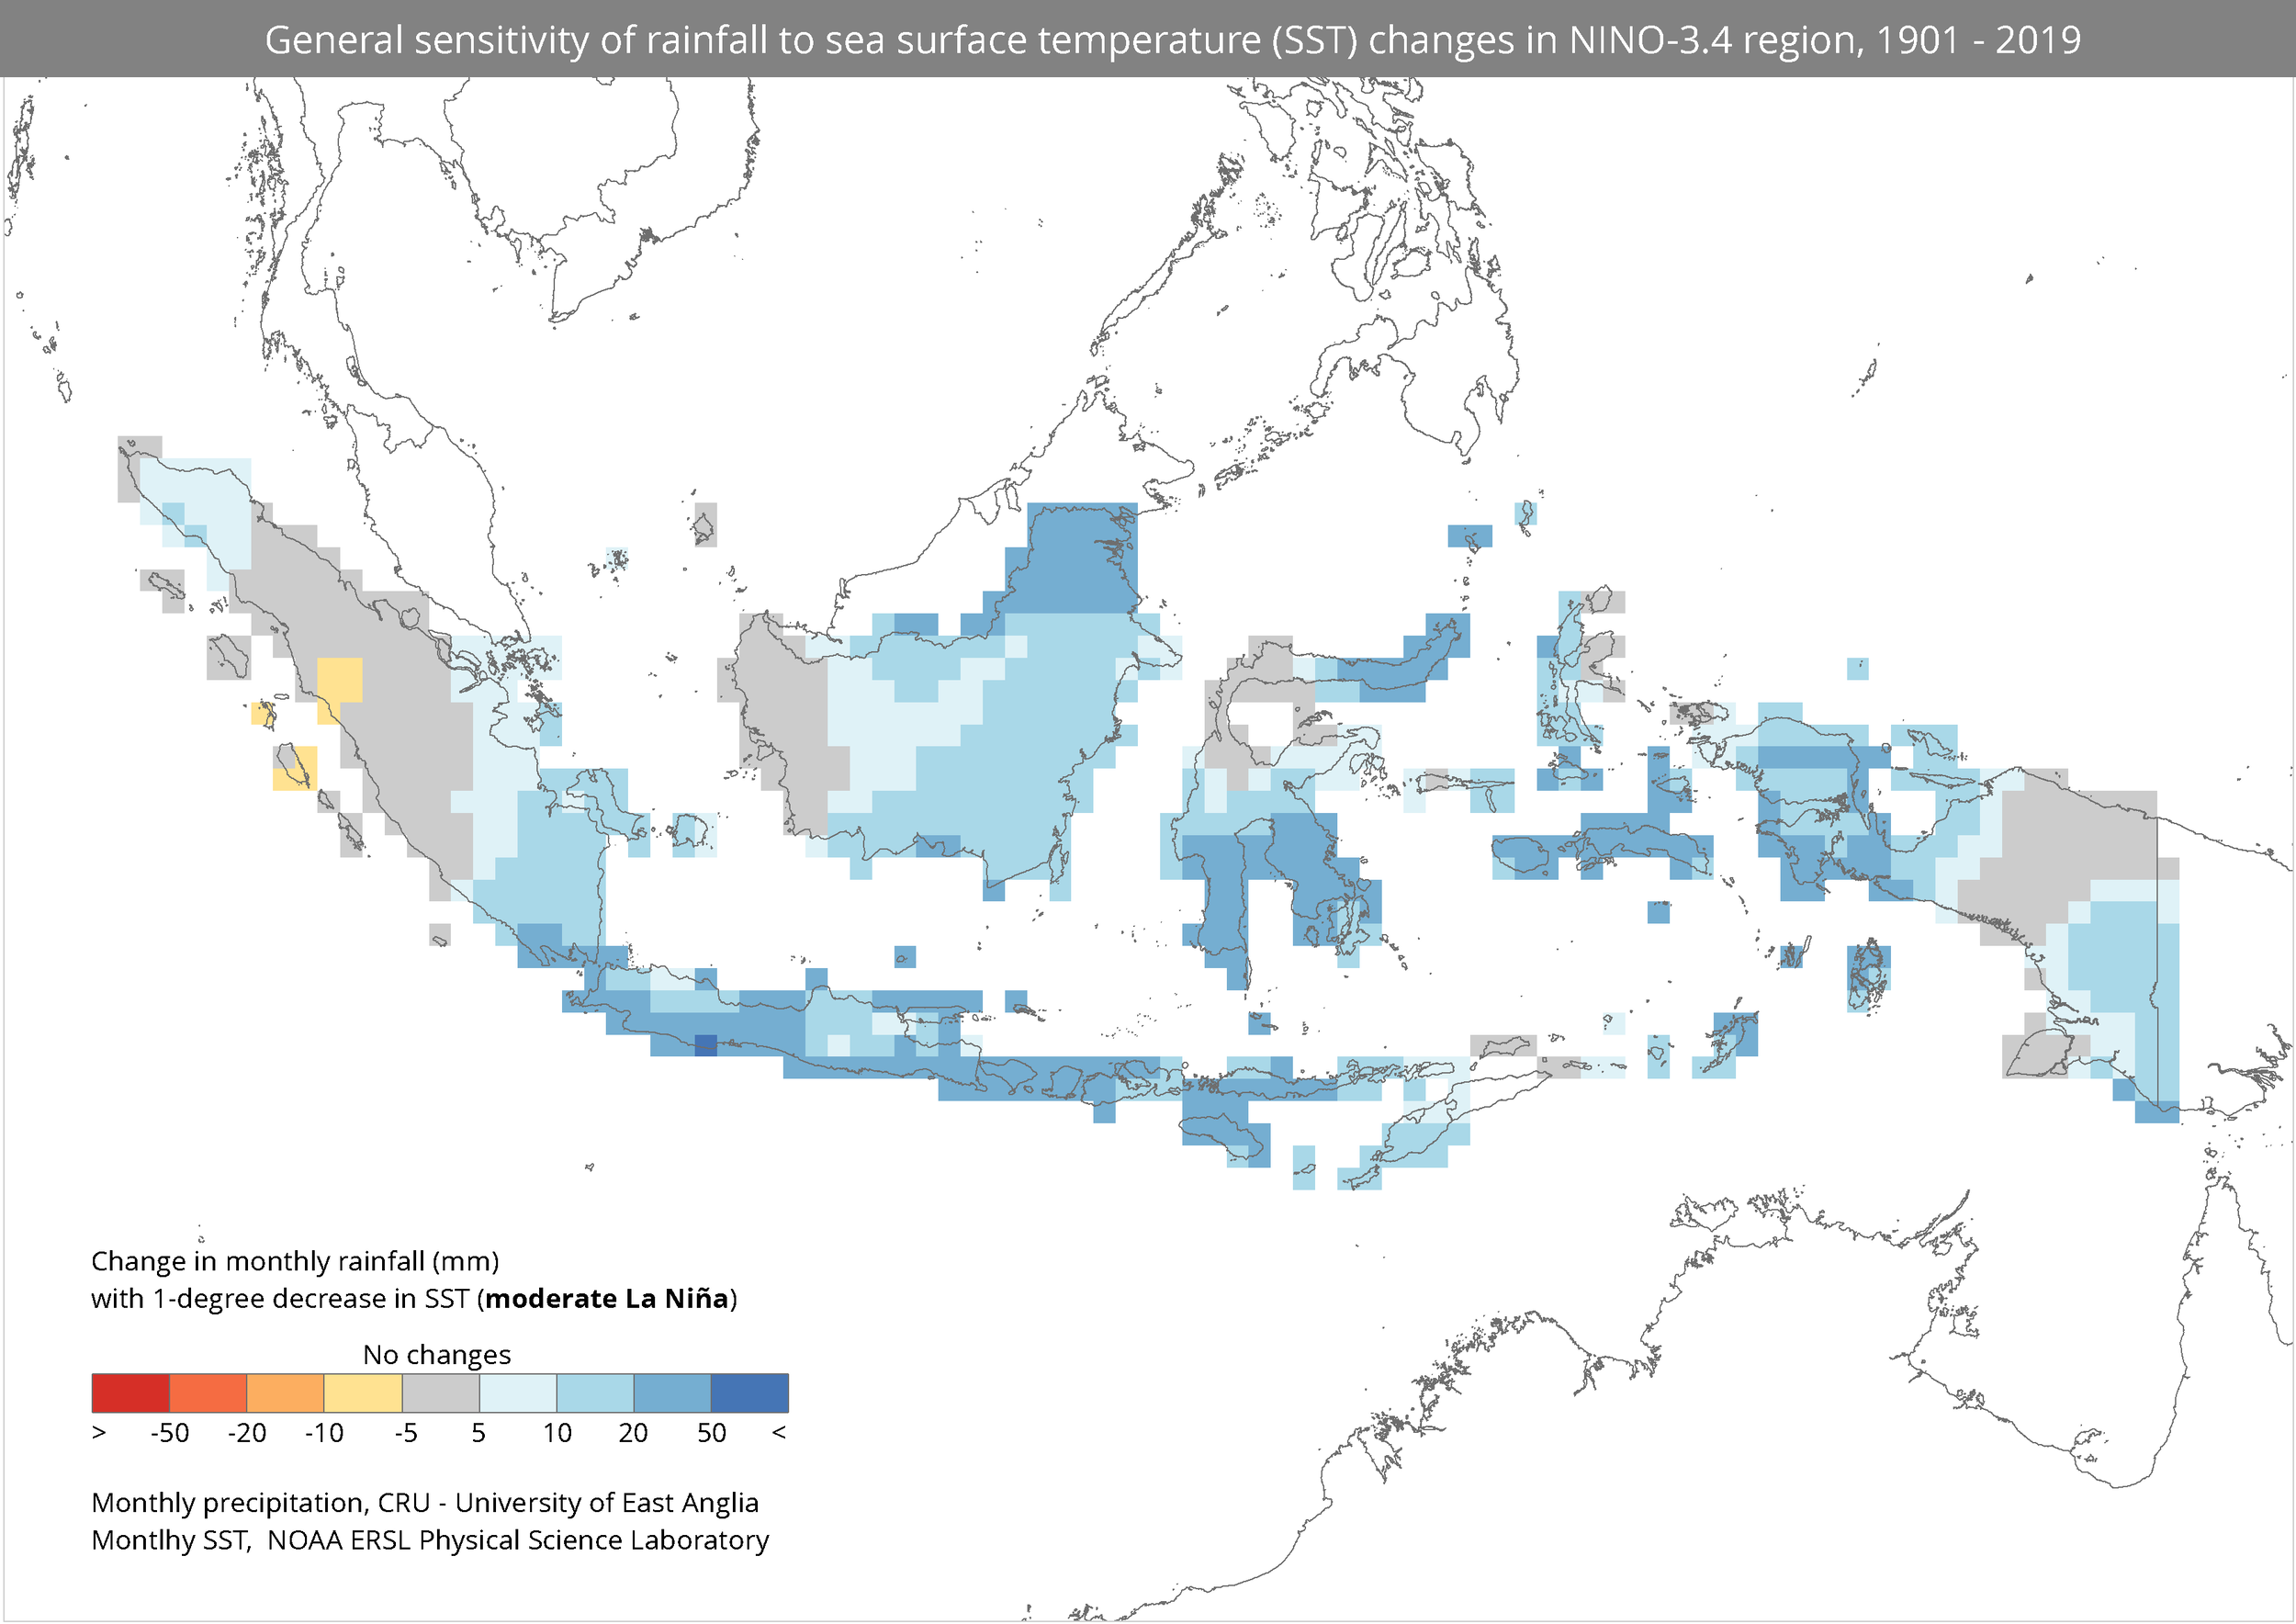
The map demonstrates the change in rainfall associated with a 1°C decrease in SST in NINO-4 region, as a signal for moderate La-Nina. Dark blue areas represent more than 50mm increase in monthly rainfall. Yet changes in monthly rainfall is not extreme, only about 10 - 50 mm for most areas in the country.
Data
- 119 years (1901-2019) monthly rainfall data used in the analysis came from Climate Research Unit - University of East Anglia, and downloaded from Center for Environmental Data Analysis, UK (https://catalogue.ceda.ac.uk/uuid/89e1e34ec3554dc98594a5732622bce9), and
- SST anomaly in NINO and Indian Ocean region region from National Oceanic and Atmospheric Administration (NOAA) ERSL Physical Sciences Laboratory (https://psl.noaa.gov/gcos_wgsp/Timeseries/).
Simple regression applied to indicate the correlation between rainfall anomaly in each area to anomaly of SST in the Pacific Ocean which represent ENSO signals.
Y = aX + b, where:
Y = Rainfall anomaly
b = Y intercept
a = Slope
X = SST anomaly
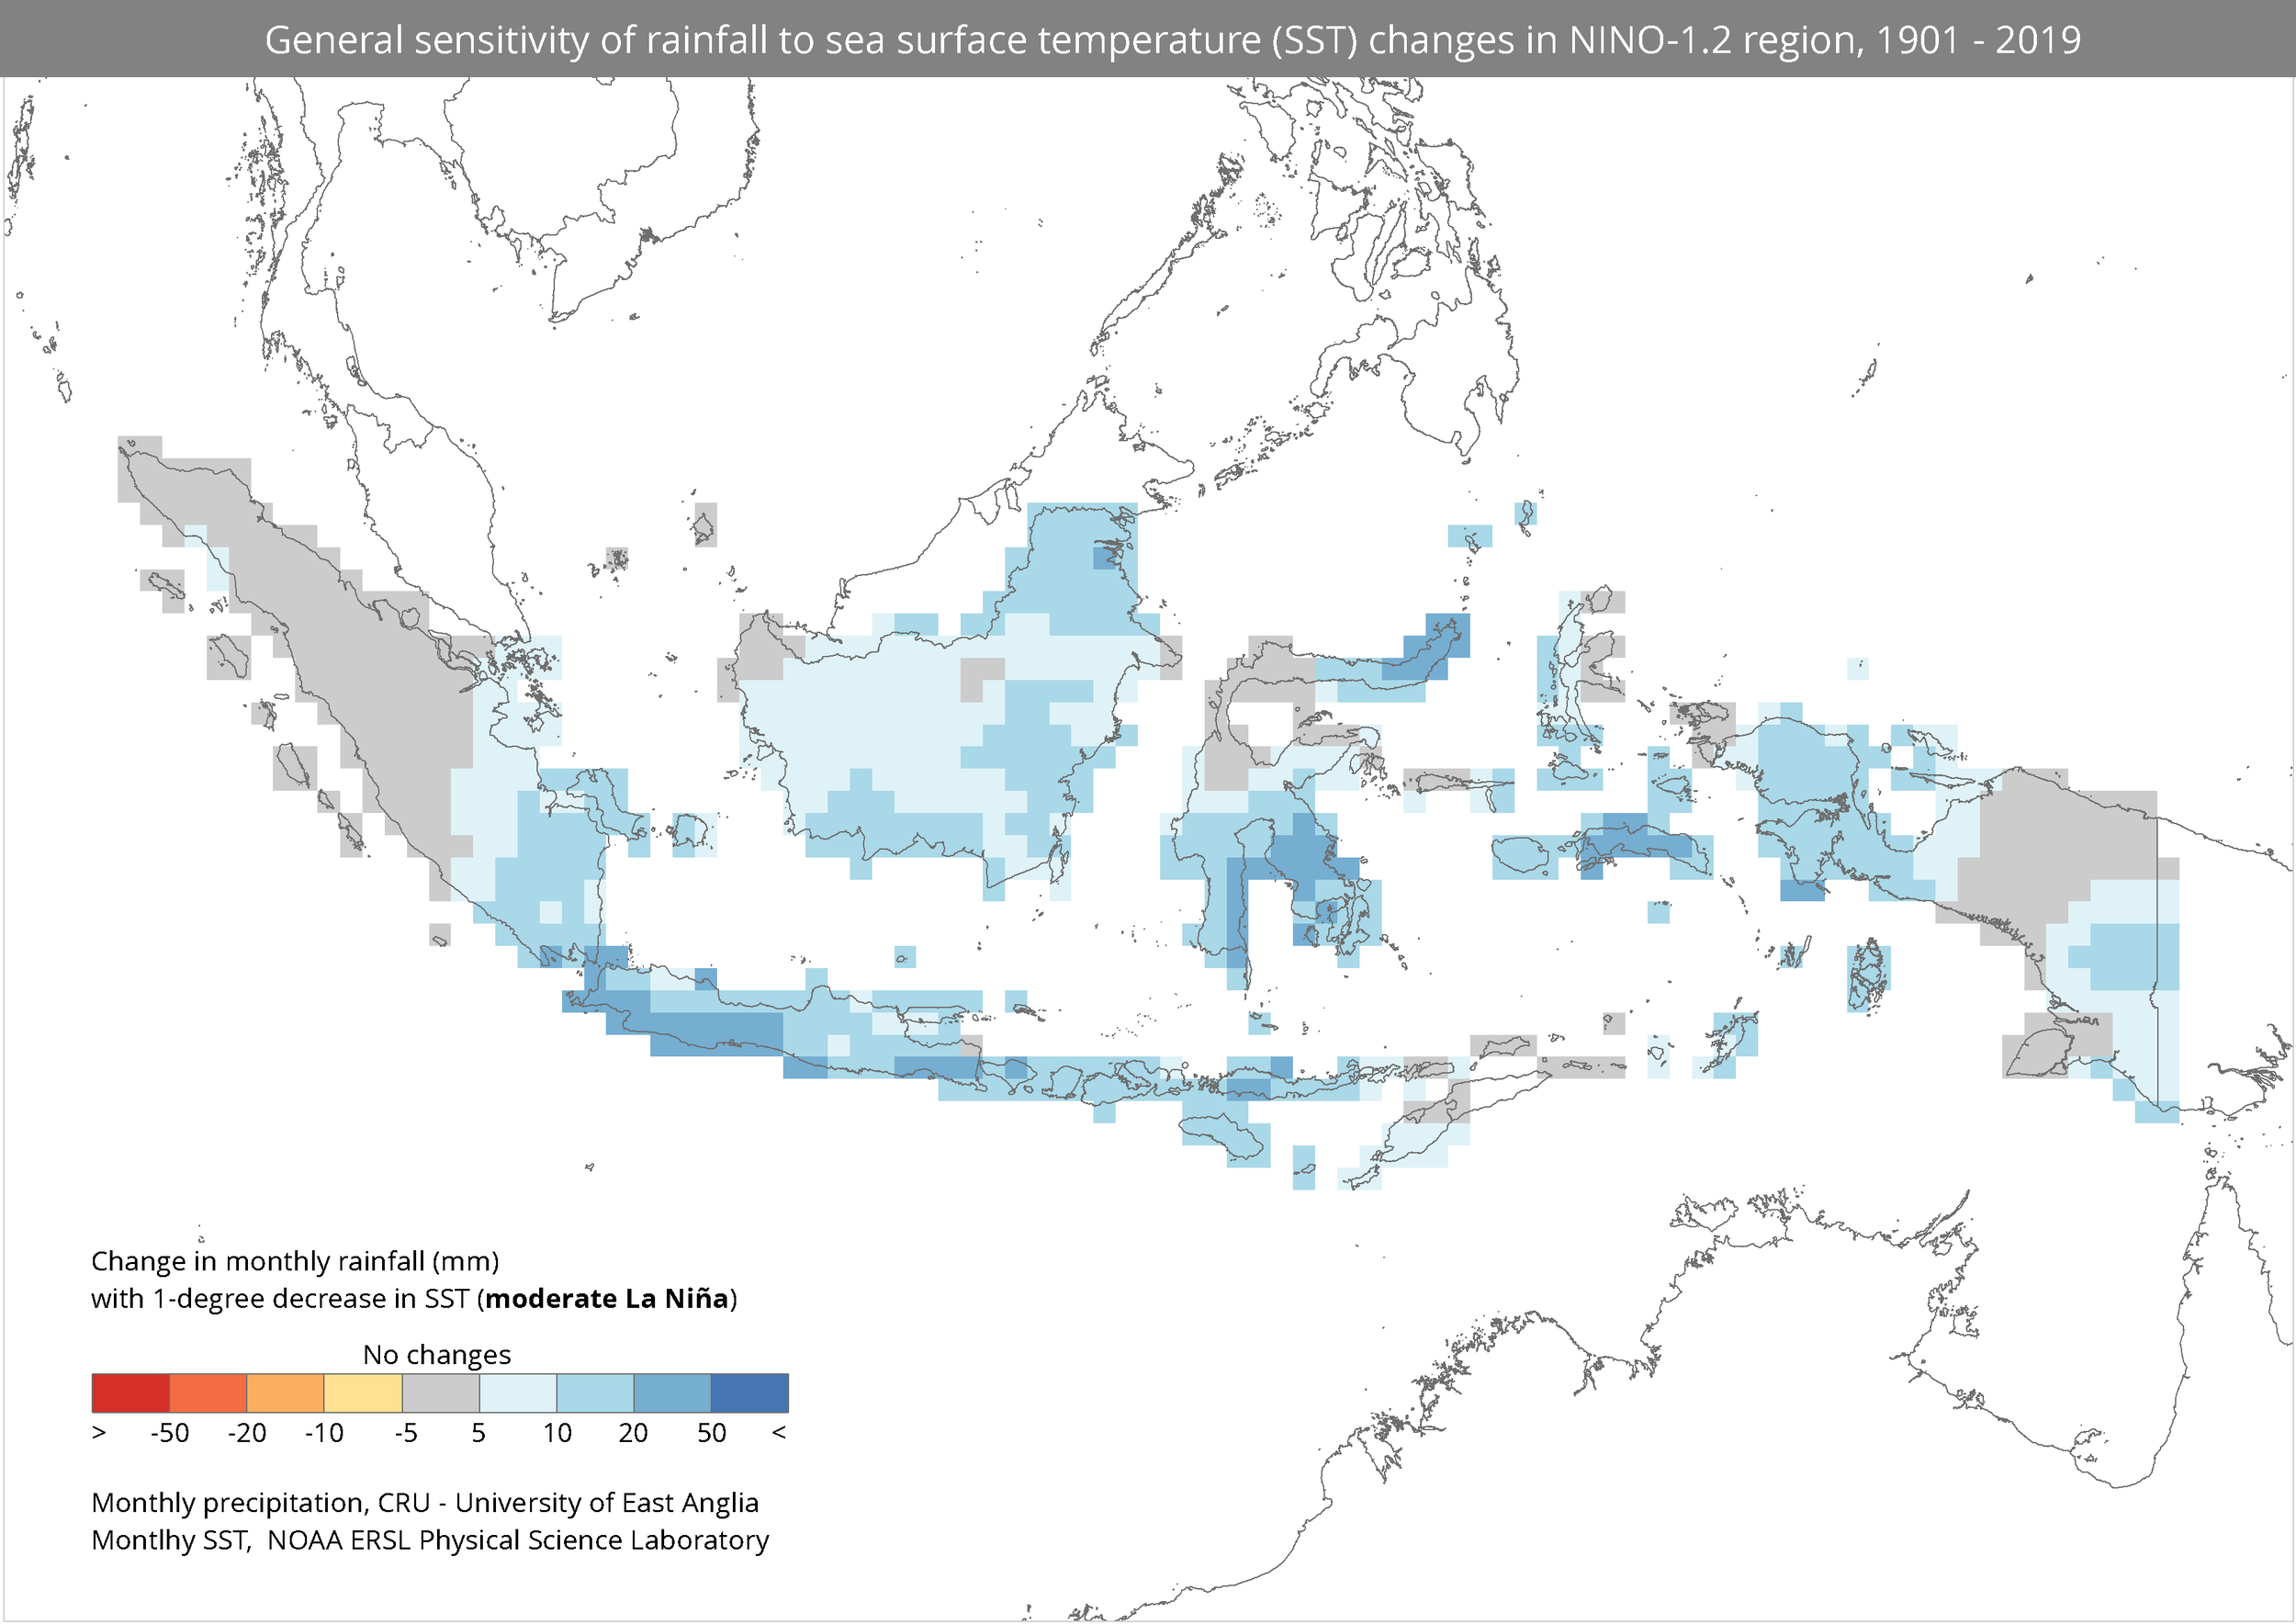
How about other NINO region? You can check below maps.
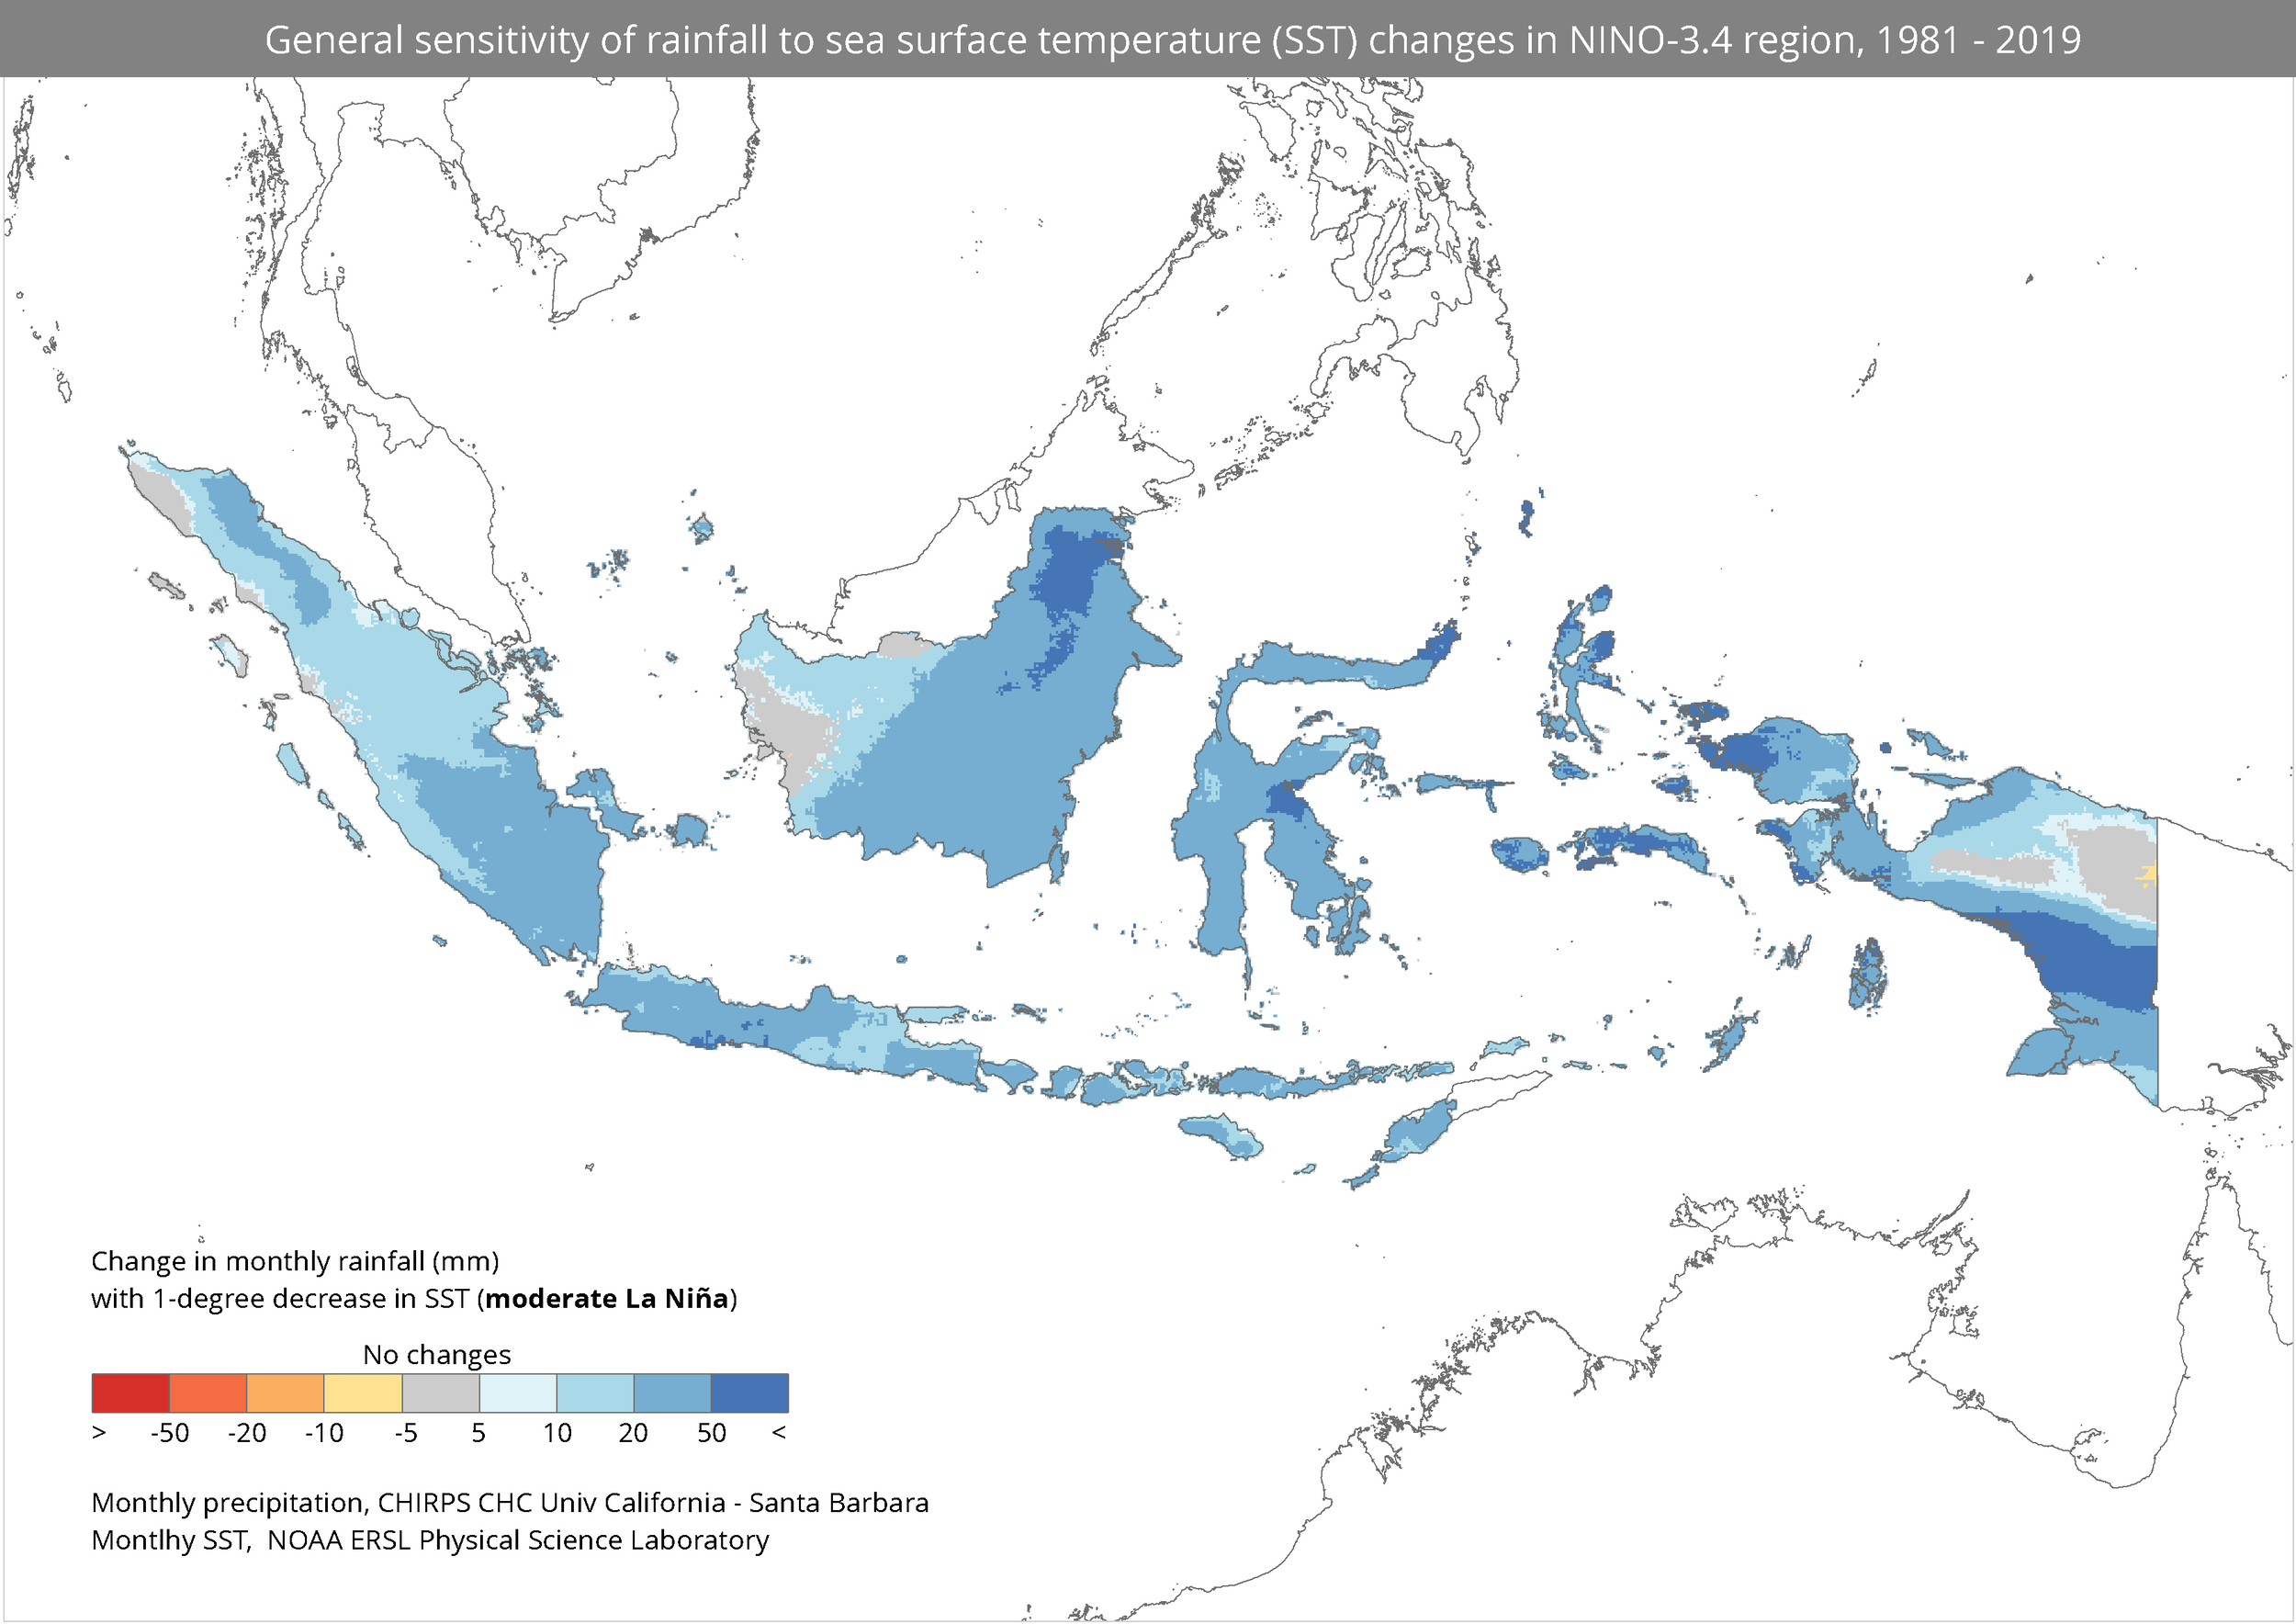
CRU rainfall above has 50km/pixel spatial resolution, and probably couldn’t capture well local phenomena. If we have data with higher spatial resolution we could do similar approach to get sensitivity rainfall due to SST changes.
For example, below map used CHIRPS rainfall from CHC University of California - Santa Barbara, with 0.05 deg ~ 5.6 km spatial resolution and shorter time period 1981 - 2019.