Visualize daily weather forecast from GFS using Google Earth Engine

Since few years ago NOAA Global Forecast Data (GFS) available at Google Earth Engine (GEE), which makes it easier to access even though there are only 9 variables out of hundreds available.

Accessing GFS data is tricky, because it can get pretty confusing with the timing. I have discussed it before on access GFS via GRIB filter and getting GFS rainfall forecast using GEE.

Let’s start write the code. I would like to visualize all the 9-variable of GFS data using GEE.

First step is to define the geographic domain and write the symbology for all variable. Each variable will have different min-max value and palette.

// INITIALISATION AND SYMBOLOGY //----------------------------- ////// // Center of the map Map.setCenter(118, -2.5, 6); // Define geographic domain. //--- var rectangle = ee.Geometry.Rectangle(92, -12, 145, 9); // Indonesia var bbox = ee.Feature(rectangle).geometry(); //Color-codes based on Color-Brewer https://colorbrewer2.org/ //--- // Temperature visualisation var visTave = { min: 20, max: 35, palette: ['ffffcc','ffeda0','fed976','feb24c', 'fd8d3c','fc4e2a','e31a1c','bd0026','800026'] }; // Specific Humidity visualisation var visSH = { min: 0, max: 30, palette: ['a50026', 'd73027', 'f46d43', 'fdae61', 'fee090', 'e0f3f8', 'abd9e9', '74add1', '4575b4', '313695'], }; // Relative Humidity visualisation var visRH = { min: 50, max: 100, palette: ['a50026', 'd73027', 'f46d43', 'fdae61', 'fee090', 'e0f3f8', 'abd9e9', '74add1', '4575b4', '313695'], }; // Wind speed visualisation var visWind = { min: 0, max: 10, palette: ['3288bd', '66c2a5', 'abdda4', 'e6f598', 'fee08b', 'fdae61', 'f46d43', 'd53e4f'], }; // Total precipitation visualisation var visPcp = { min: 0, max: 50, palette: [ 'cccccc','f9f3d5','dce2a8','a8c58d','77a87d','ace8f8', '4cafd9','1d5ede','001bc0','9131f1','e983f3','f6c7ec' ]}; // Precipitable water visualisation var visPW = { min: 0, max: 50, palette: [ 'cccccc','f9f3d5','dce2a8','a8c58d','77a87d','ace8f8', '4cafd9','1d5ede','001bc0','9131f1','e983f3','f6c7ec' ]}; // Total cloud coverage visualisation var visCC = { min: 0, max: 100, // dataset max is 100 palette: ['black','white'] }; // Shortwave radiation visualisation var visSR = { min: 0, max: 1230, palette: ['blue', 'purple', 'cyan', 'green', 'yellow', 'red'], };

Now set the date and data

// DATE AND DATA //-------------------------------- ////// // Strip time off current date/time var today = ee.Date(new Date().toISOString().split('T')[0]); print(today); // GFS Dataset Availability: // https://developers.google.com/earth-engine/datasets/catalog/NOAA_GFS0P25#citations var start_period = ee.Date('2019-11-07'); // First GFS data 1 Jul 2015 // MAIN INPUT //----------- ////// // Create function to import GFS data - https://developers.google.com/earth-engine/datasets/catalog/NOAA_GFS0P25 // 24-hours/1-day forecast from selected date var GFS0P25 = ee.ImageCollection('NOAA/GFS0P25');


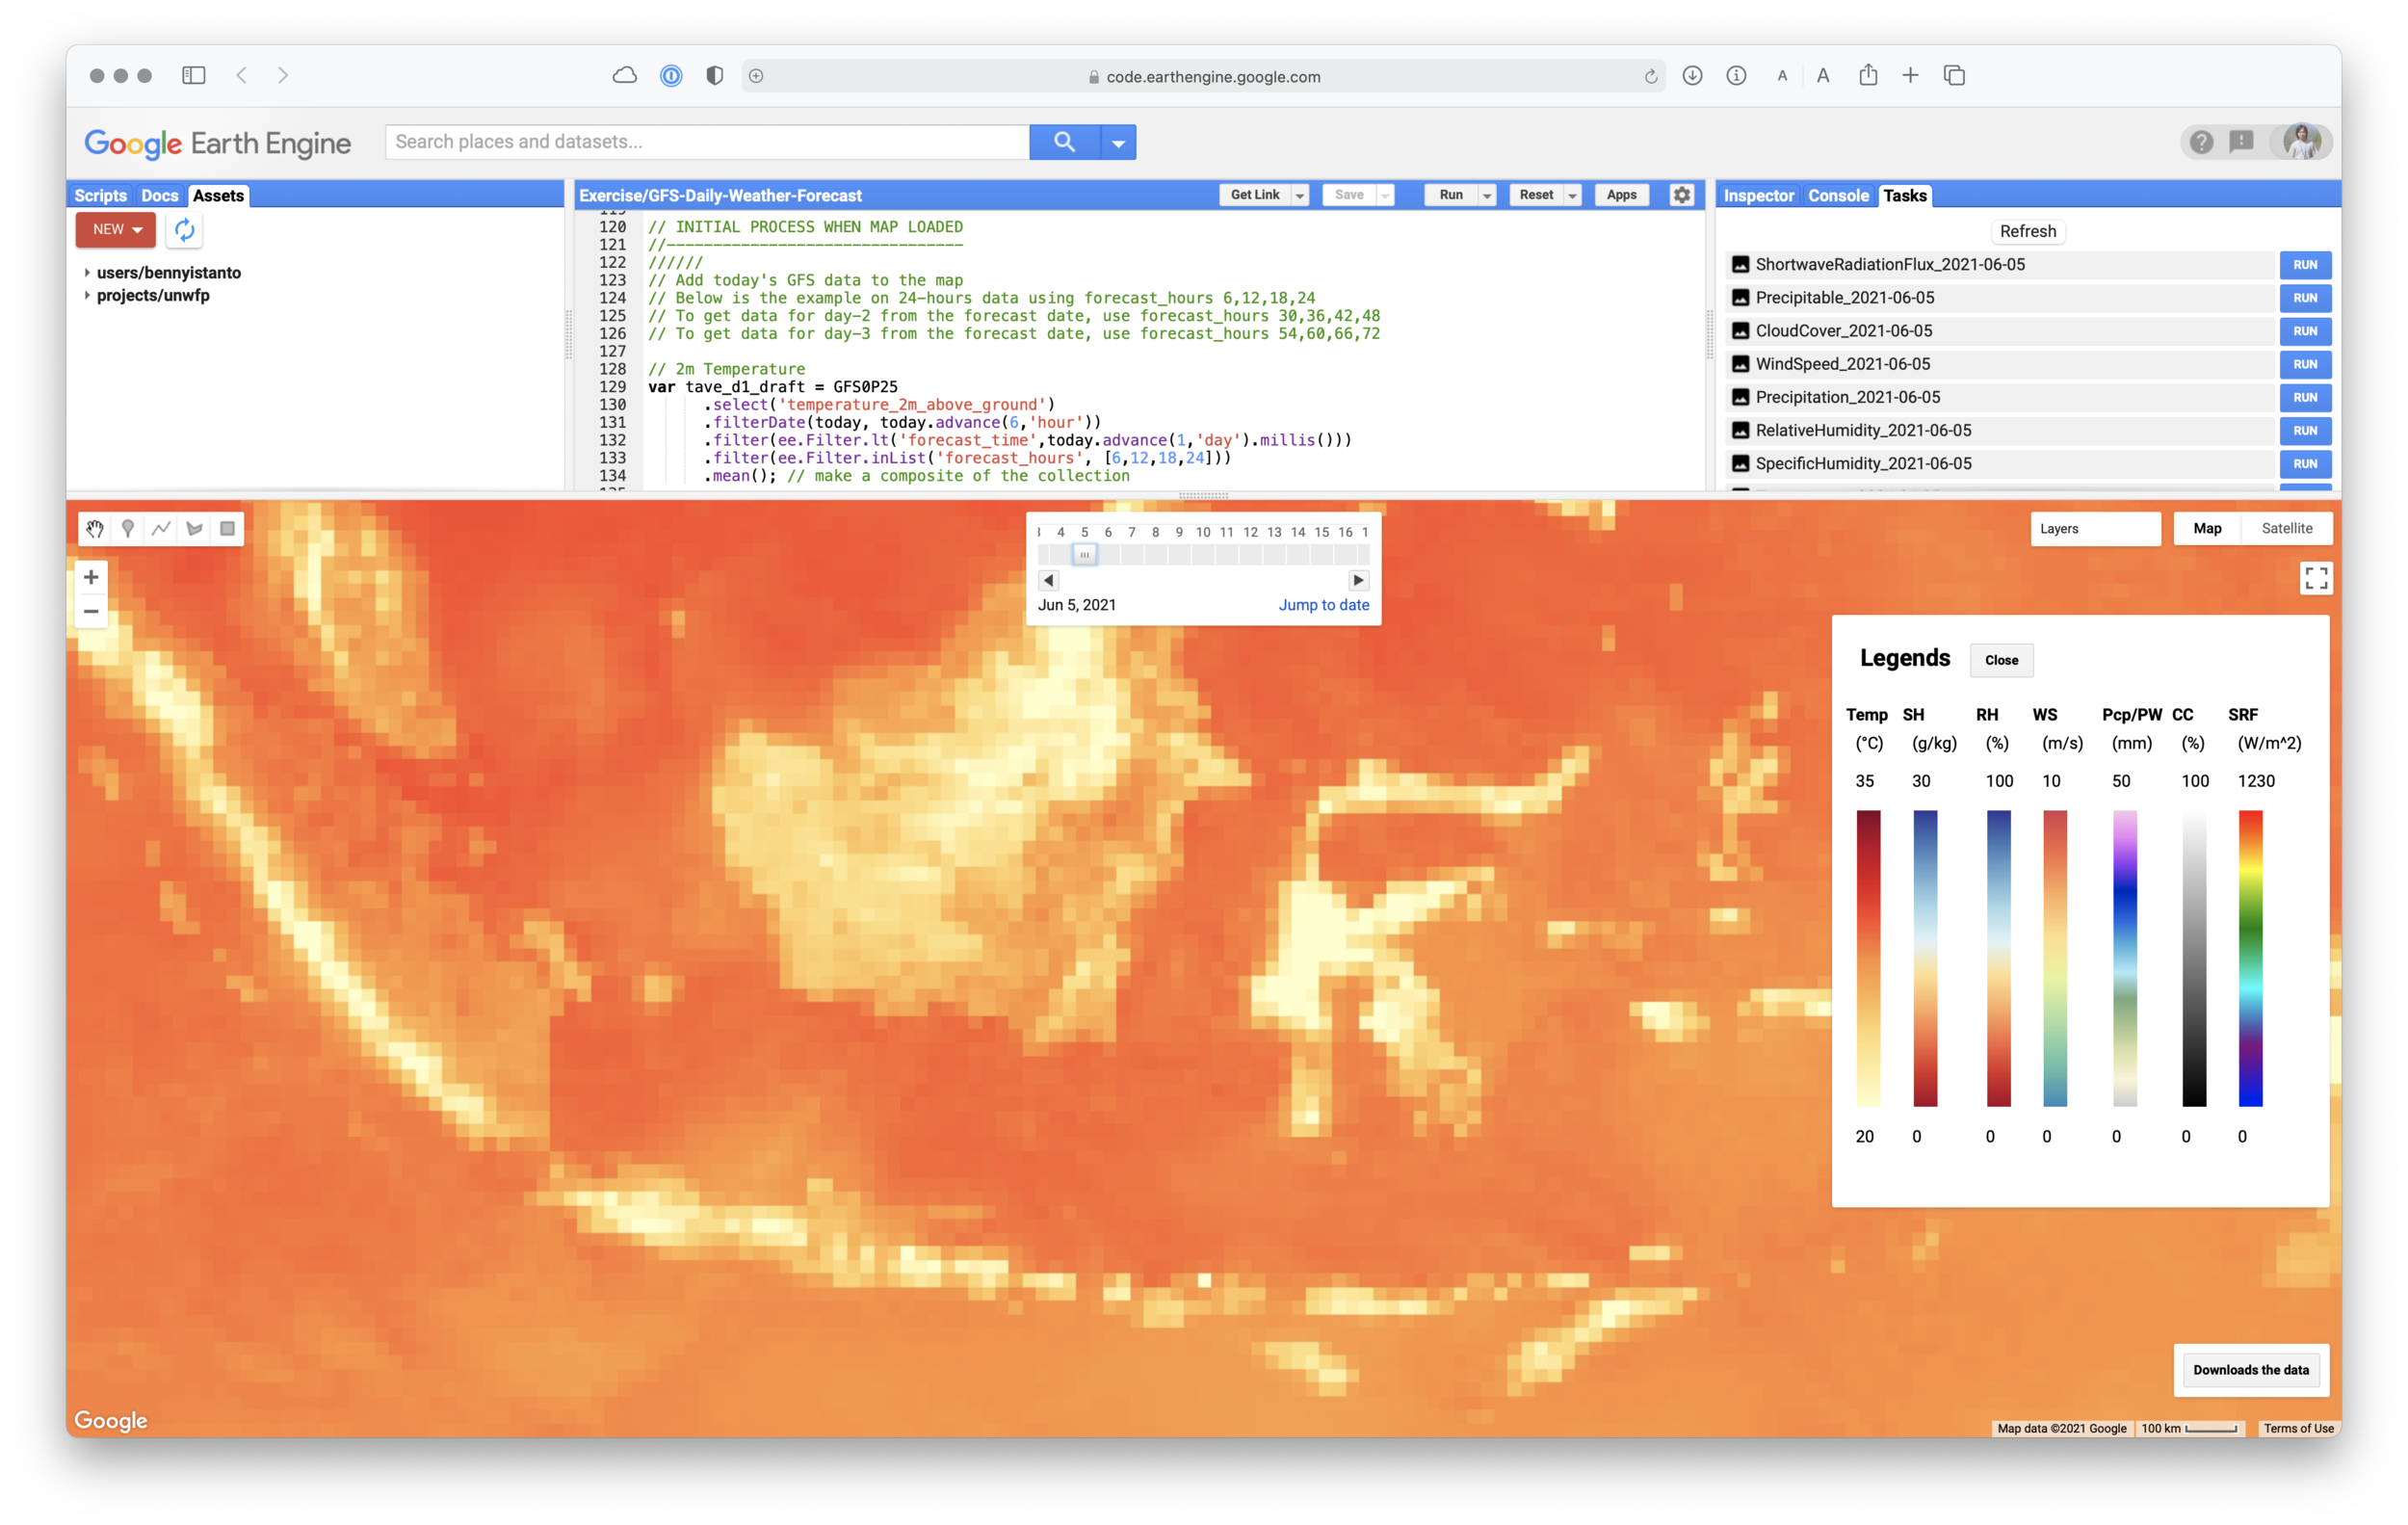
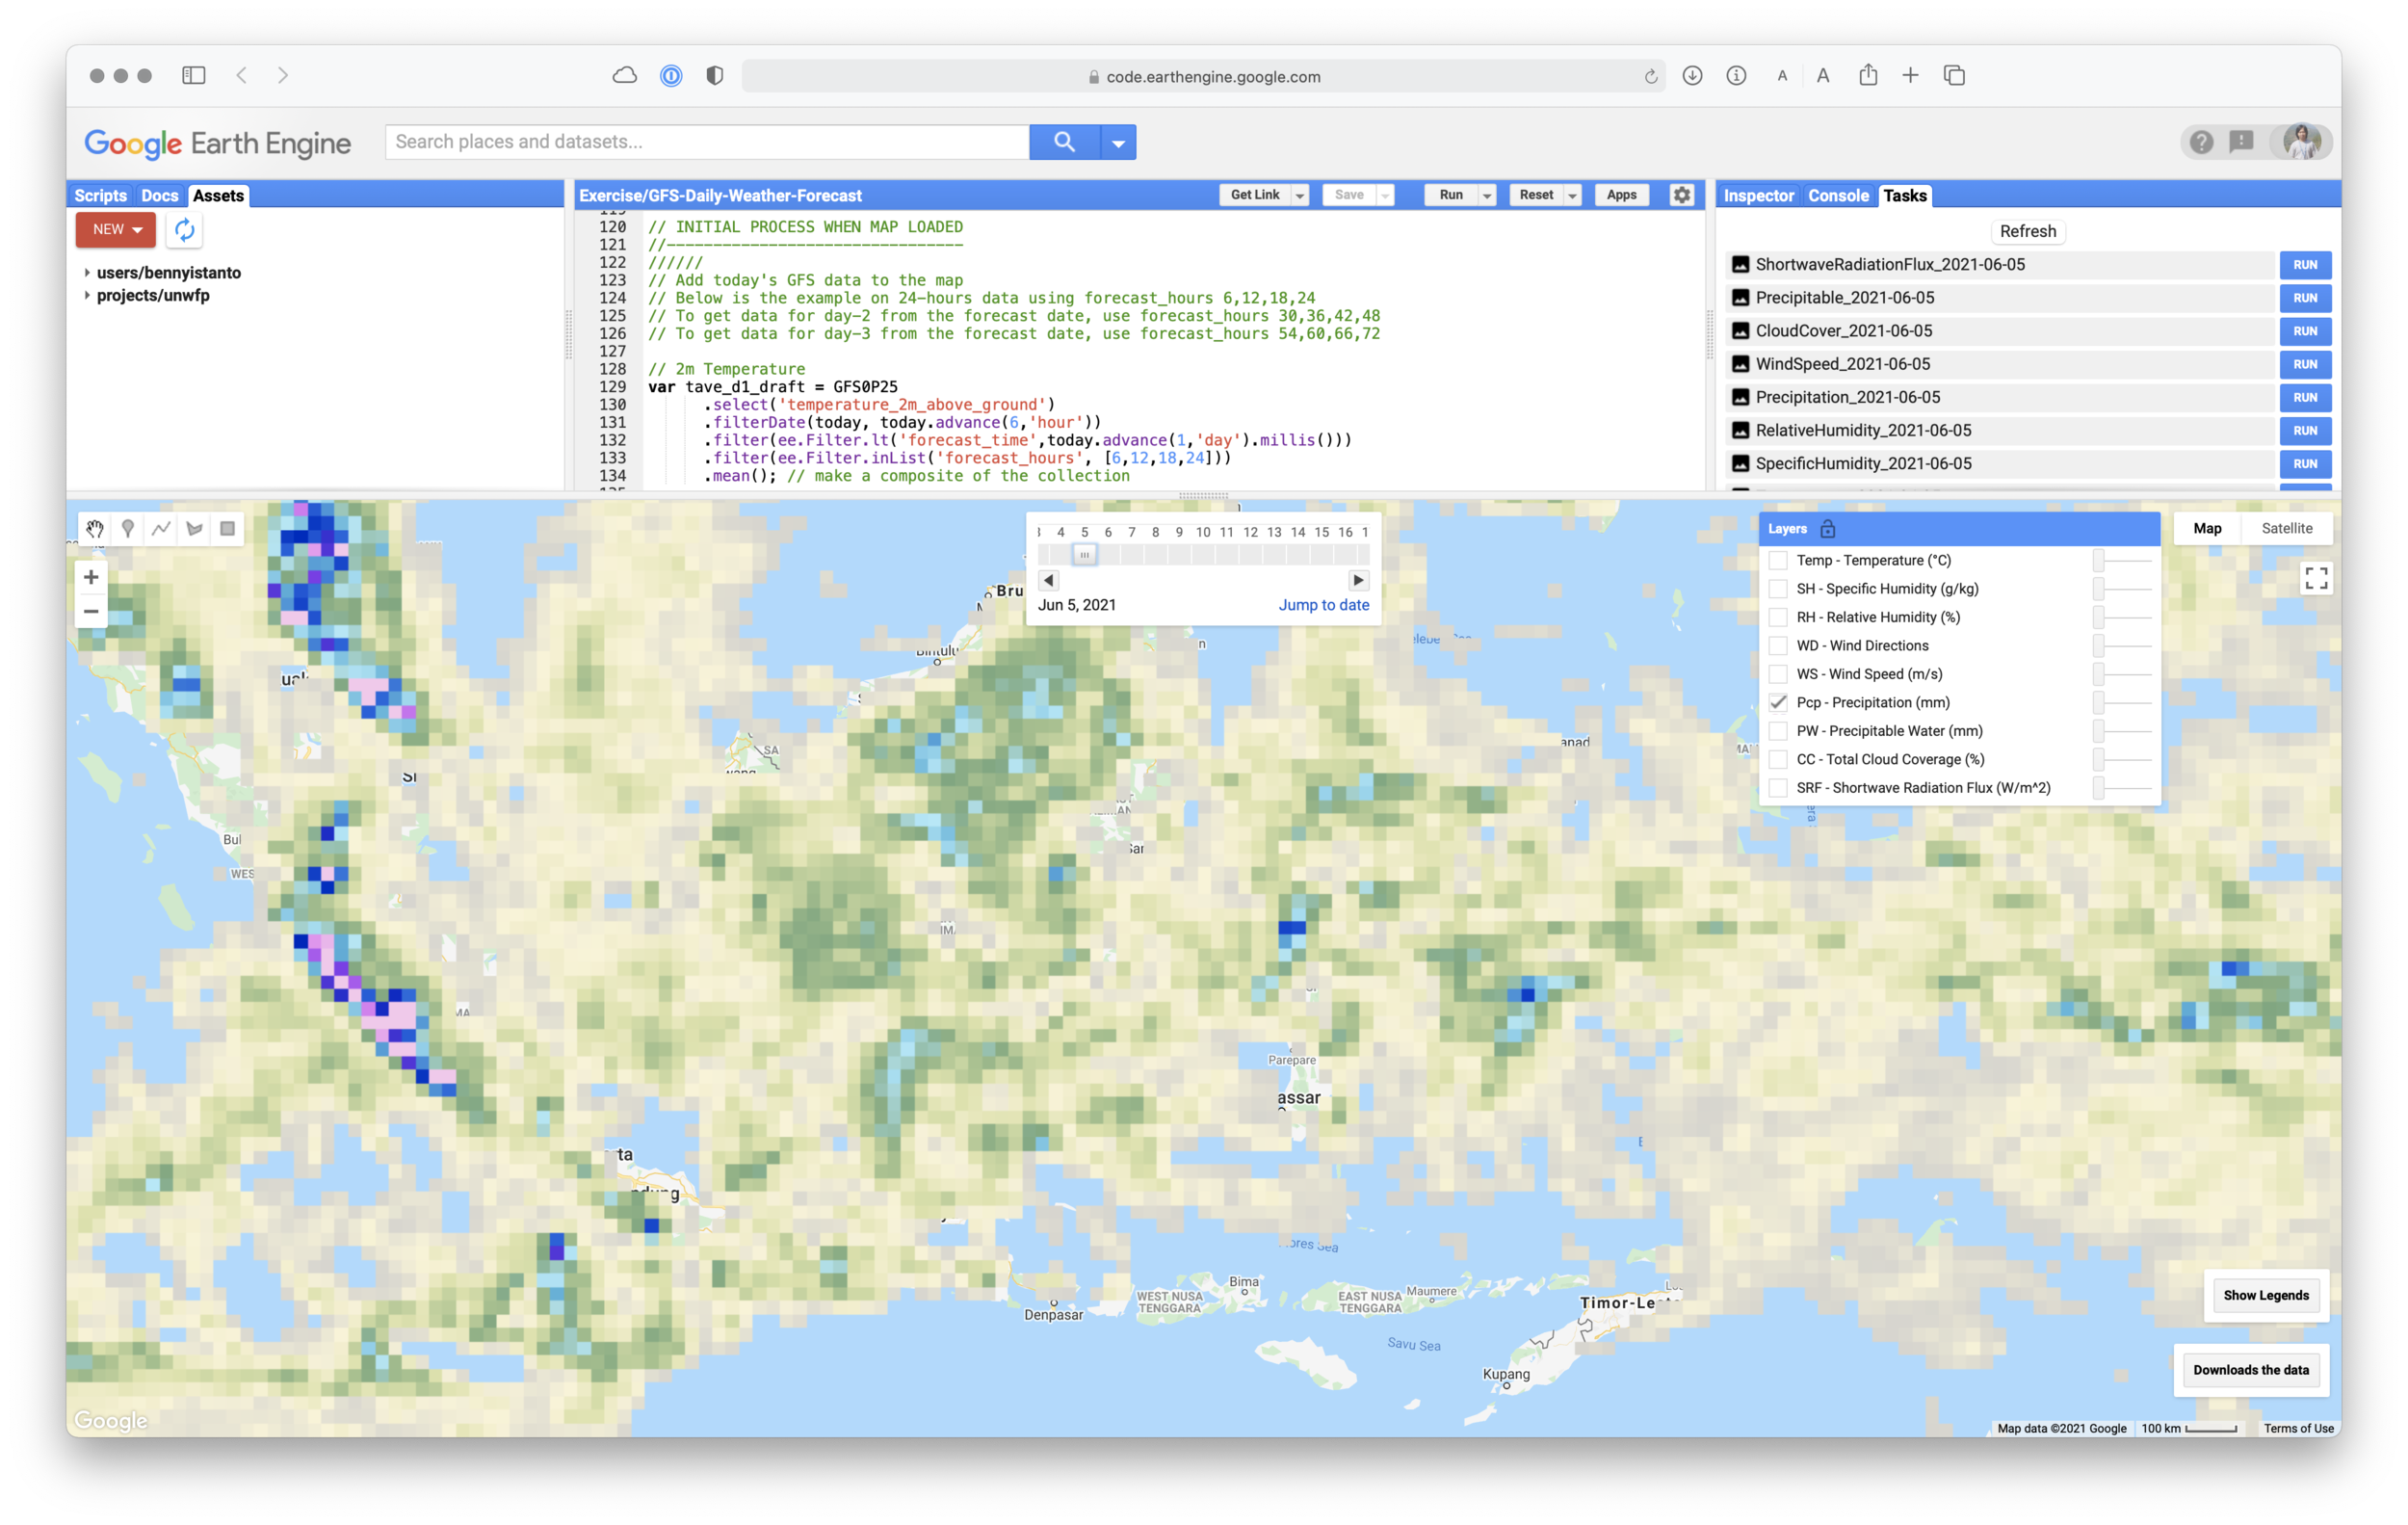
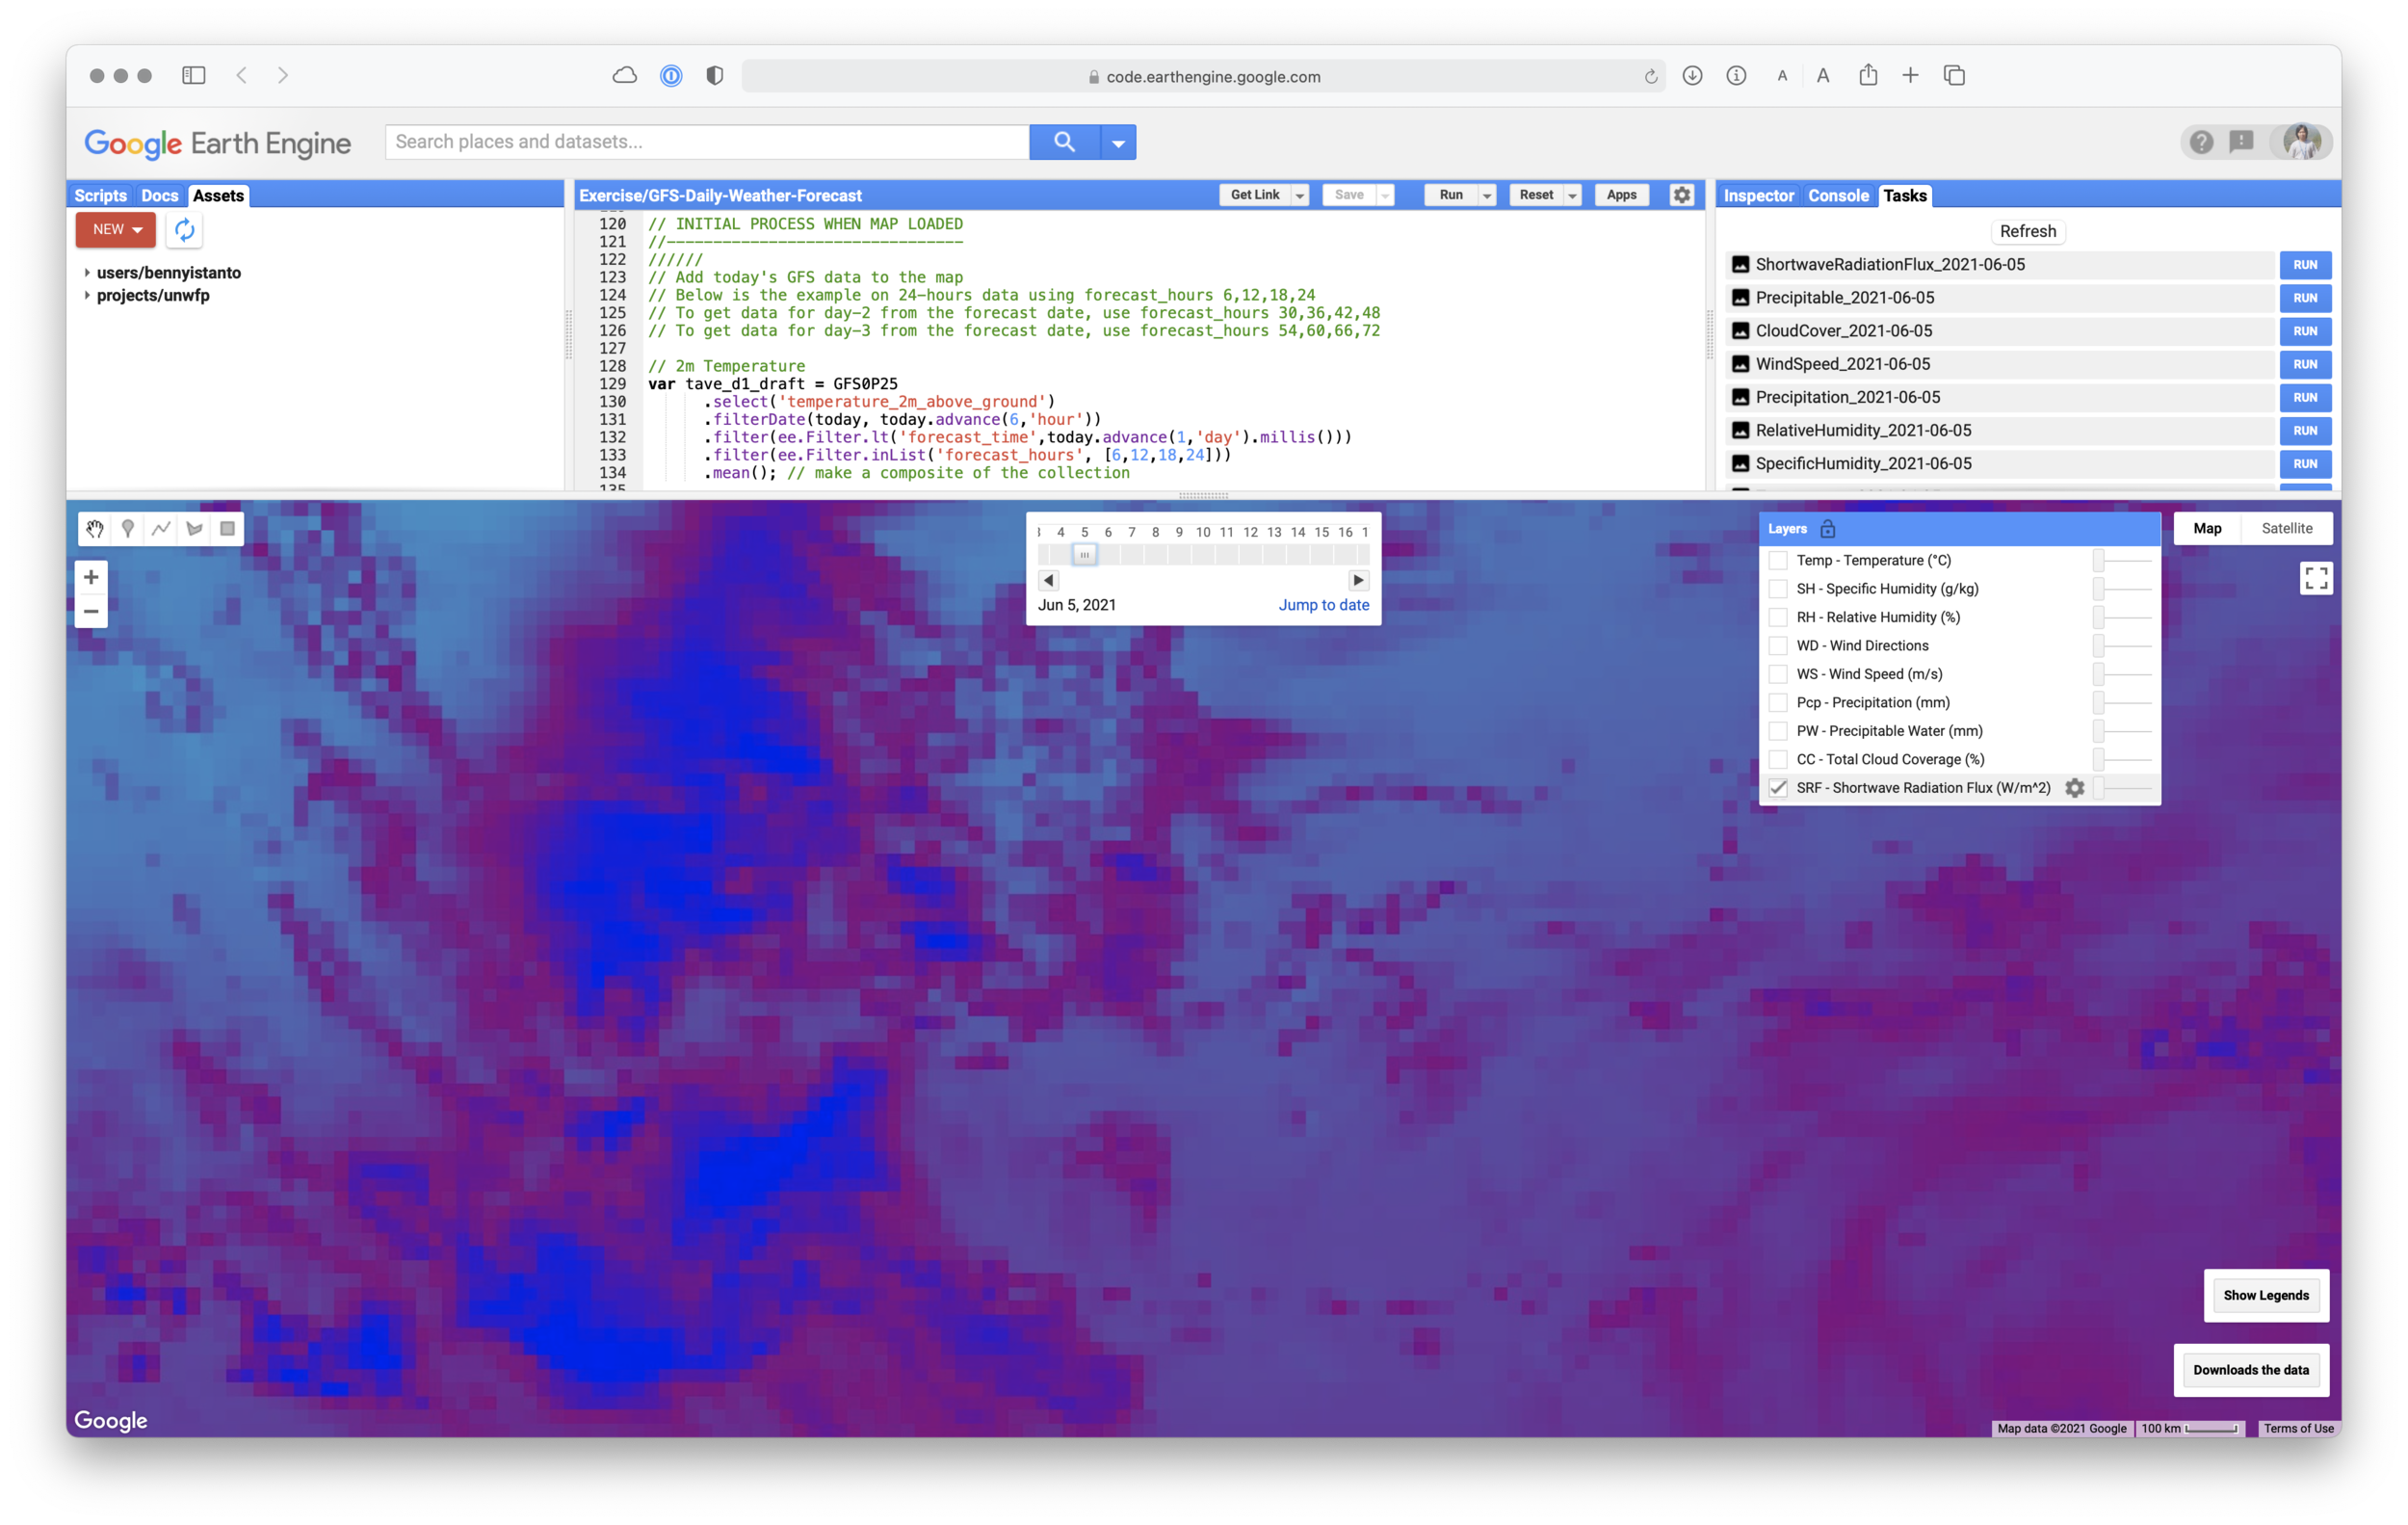
Now as the initial process when map loaded, create new variable for each band, select the bands and do filtering based on date and “forecast_hours”. The focus is only grab 1-day forecast, so I will use forecast hours 6,12,18,24.

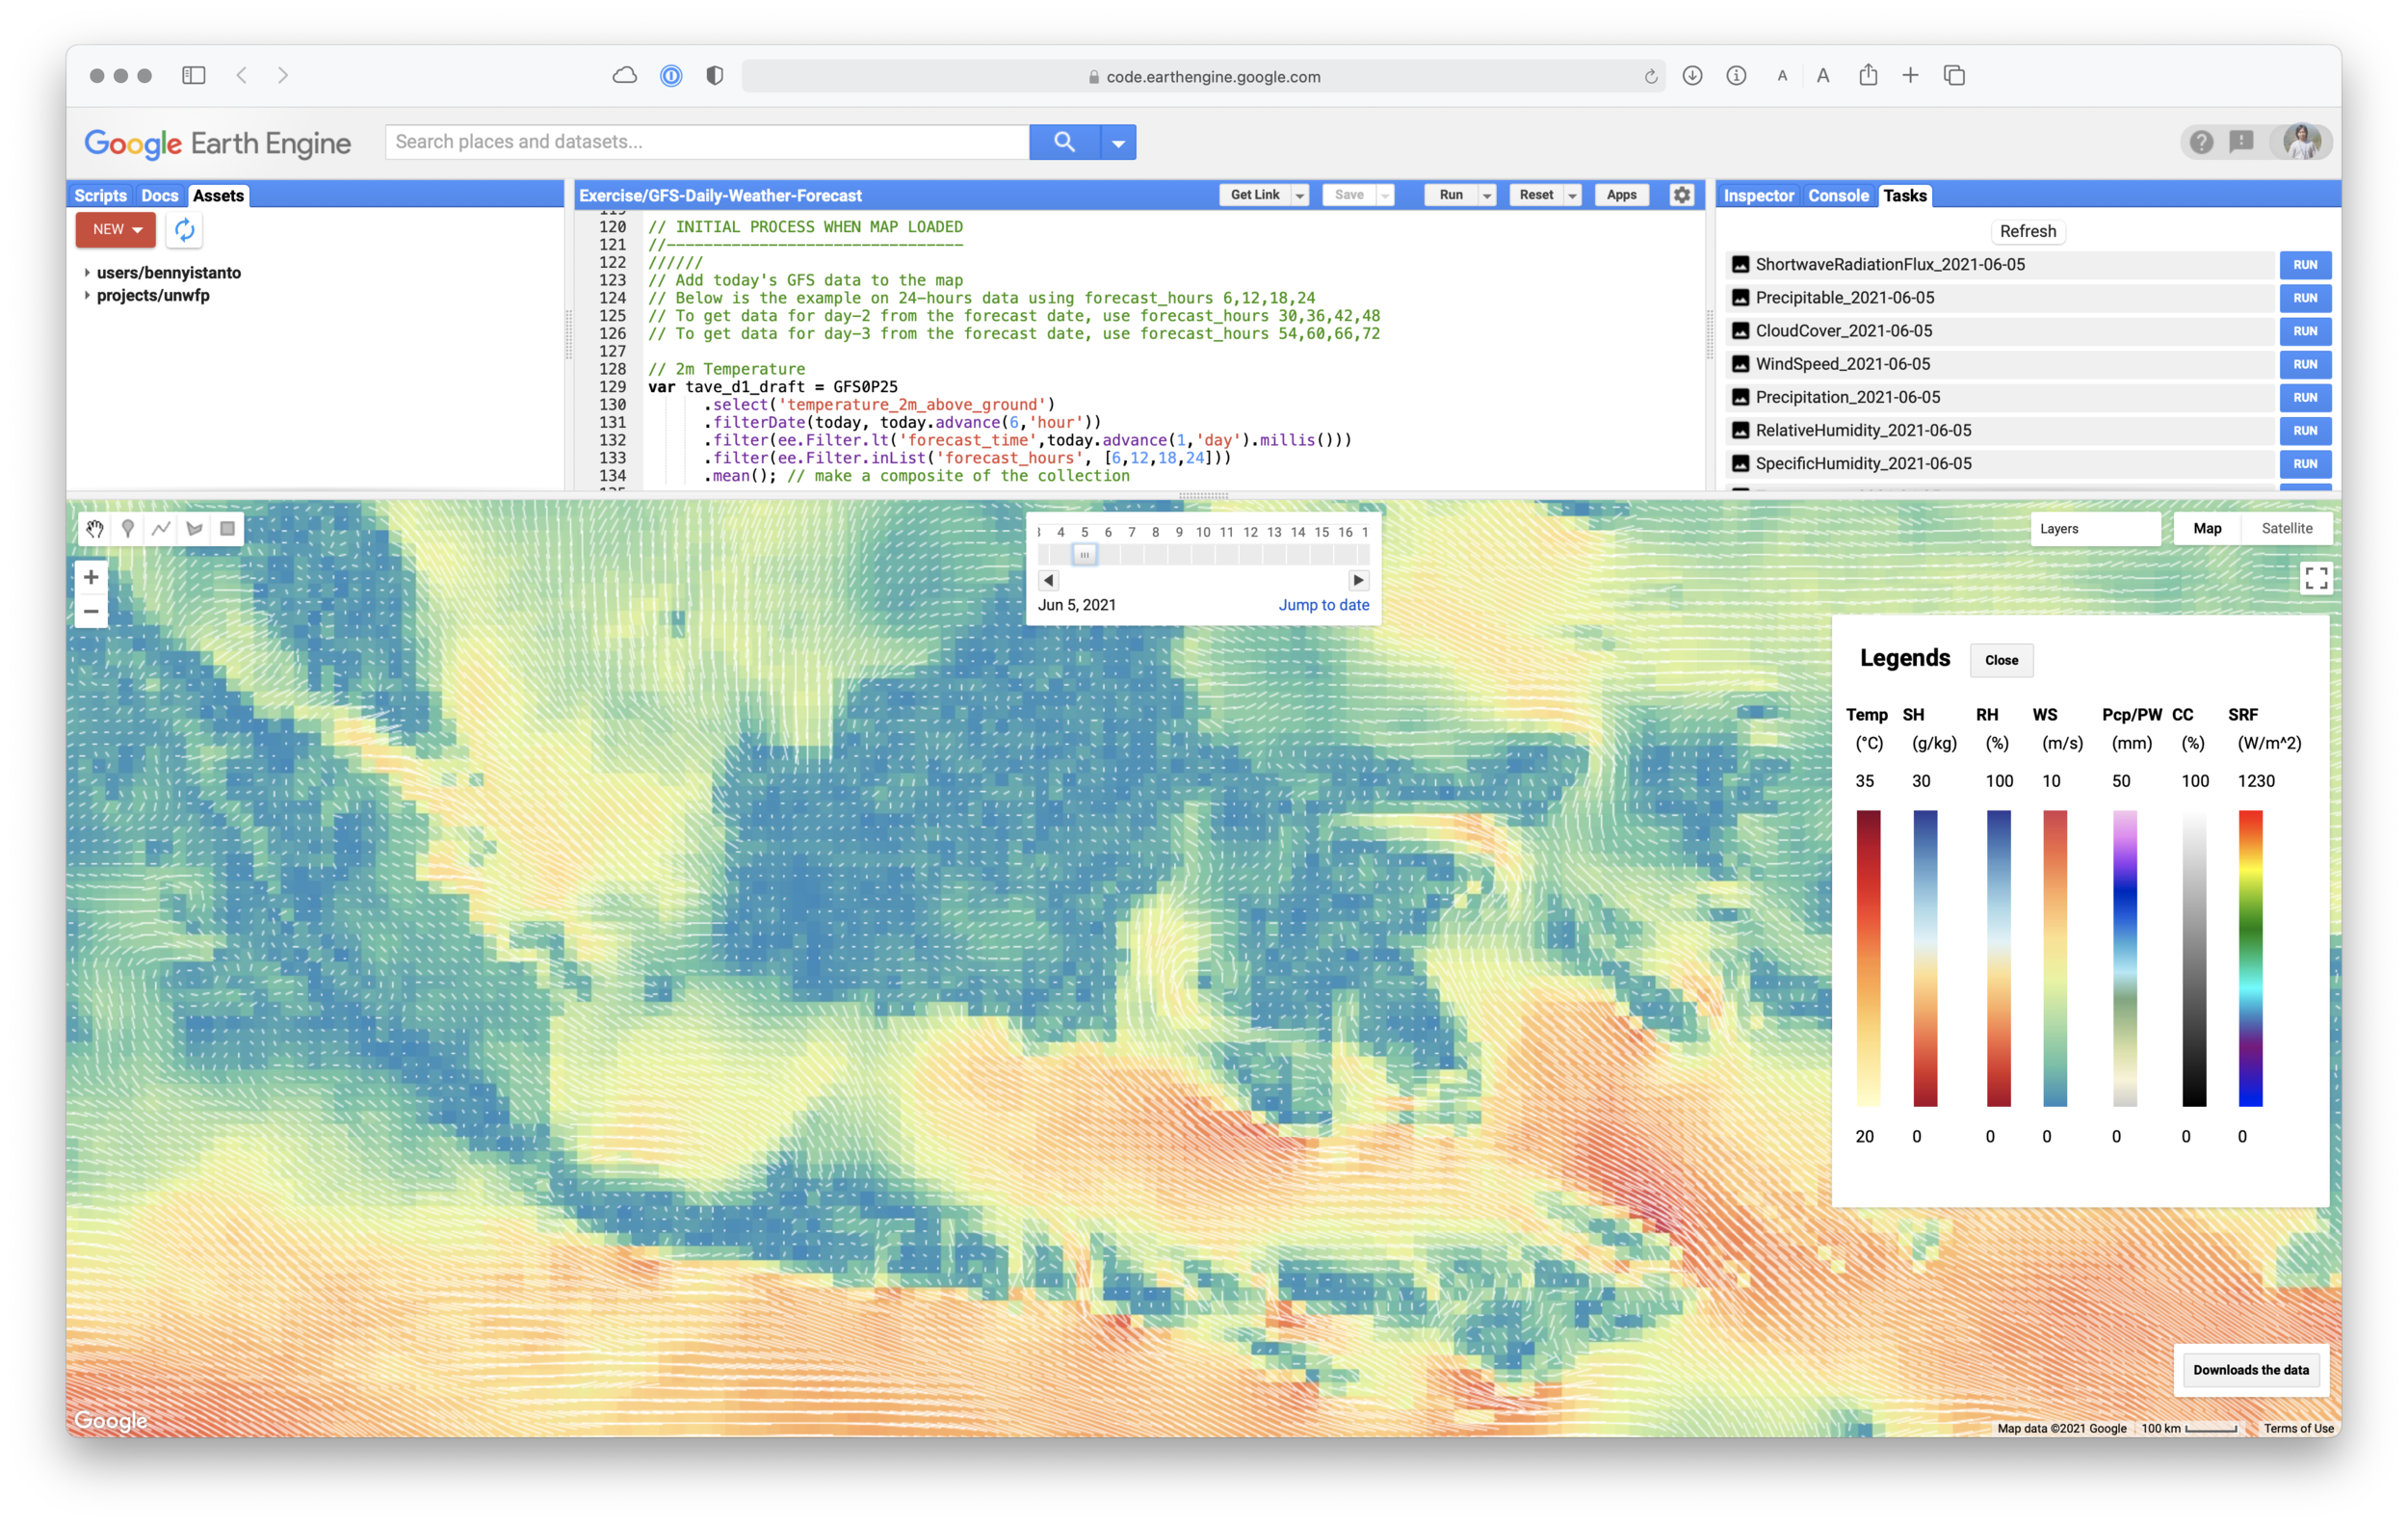
I will adapt script from Gennadii Donchyts to visualize Wind Direction as a vector.

// INITIAL PROCESS WHEN MAP LOADED //-------------------------------- ////// // Add today's GFS data to the map // Below is the example on 24-hours data using forecast_hours 6,12,18,24 // To get data for day-2 from the forecast date, use forecast_hours 30,36,42,48 // To get data for day-3 from the forecast date, use forecast_hours 54,60,66,72 // 2m Temperature var tave_d1_draft = GFS0P25 .select('temperature_2m_above_ground') .filterDate(today, today.advance(6,'hour')) .filter(ee.Filter.lt('forecast_time',today.advance(1,'day').millis())) .filter(ee.Filter.inList('forecast_hours', [6,12,18,24])) .mean(); // make a composite of the collection var tave_d1 = tave_d1_draft.clip(bbox); // 2m Specific Humidity var sh_d1_draft = GFS0P25 .select('specific_humidity_2m_above_ground') .filterDate(today, today.advance(6,'hour')) .filter(ee.Filter.lt('forecast_time',today.advance(1,'day').millis())) .filter(ee.Filter.inList('forecast_hours', [6,12,18,24])) .mean(); // make a composite of the collection // SH unit in GFS is kg/kg, I want to convert it to g/kg // This means that such humidity is expressed as the amount of // water vapour (in grams) present in each kilogram of air var sh_d1 = sh_d1_draft.expression( 'SHg = SHkg * 1000', { 'SHkg': sh_d1_draft.select('specific_humidity_2m_above_ground') }).float().clip(bbox); // 2m Relative Humidity var rh_d1_draft = GFS0P25 .select('relative_humidity_2m_above_ground') .filterDate(today, today.advance(6,'hour')) .filter(ee.Filter.lt('forecast_time',today.advance(1,'day').millis())) .filter(ee.Filter.inList('forecast_hours', [6,12,18,24])) .mean(); // make a composite of the collection var rh_d1 = rh_d1_draft.clip(bbox); // 10m wind var uv_d1_draft = GFS0P25 .select(['u_component_of_wind_10m_above_ground', 'v_component_of_wind_10m_above_ground']) .filterDate(today, today.advance(6,'hour')) .filter(ee.Filter.lt('forecast_time',today.advance(1,'day').millis())) .filter(ee.Filter.inList('forecast_hours', [6,12,18,24])) .mean(); // make a composite of the collection // Wind speed and direction //--- // Based on code from Gennadii Donchyts // https://code.earthengine.google.com/320ee5bc81f2de3ae49f348f8ec9a6d7 var uv_d1_0 = uv_d1_draft.clip(bbox); var scale = Map.getScale() * 10; //25000 var numPixels = 1e10; var samples = uv_d1_0.rename(['u10', 'v10']).sample({ region: bbox, scale: scale, numPixels: numPixels, geometries: true }); var scaleVector = 0.1; var vectors_d1 = samples.map(function(f) { var u = ee.Number(f.get('u10')).multiply(scaleVector); var v = ee.Number(f.get('v10')).multiply(scaleVector); var origin = f.geometry(); // translate var proj = origin.projection().translate(u, v); var end = ee.Geometry.Point(origin.transform(proj).coordinates()); // construct line var geom = ee.Algorithms.GeometryConstructors.LineString([origin, end], null, true); return f.setGeometry(geom); }); var uv_d1 = uv_d1_0.pow(2).reduce(ee.Reducer.sum()).sqrt(); // Precipitation var pcp_d1_draft = GFS0P25 .select('total_precipitation_surface') .filterDate(today, today.advance(6,'hour')) .filter(ee.Filter.lt('forecast_time',today.advance(1,'day').millis())) .filter(ee.Filter.inList('forecast_hours', [6,12,18,24])) .sum(); // make a composite of the collection var pcp_d1 = pcp_d1_draft.updateMask(pcp_d1_draft.gt(1)).clip(bbox); // Precipitable Water var pw_d1_draft = GFS0P25 .select('precipitable_water_entire_atmosphere') .filterDate(today, today.advance(6,'hour')) .filter(ee.Filter.lt('forecast_time',today.advance(1,'day').millis())) .filter(ee.Filter.inList('forecast_hours', [6,12,18,24])) .mean(); // make a composite of the collection var pw_d1 = pw_d1_draft.clip(bbox); // Total Cloud Cover var cc_d1_draft = GFS0P25 .select('total_cloud_cover_entire_atmosphere') .filterDate(today, today.advance(6,'hour')) .filter(ee.Filter.lt('forecast_time',today.advance(1,'day').millis())) .filter(ee.Filter.inList('forecast_hours', [6,12,18,24])) .mean(); // make a composite of the collection var cc_d1 = cc_d1_draft.clip(bbox); // Downward Shortwave Radiation Flux var sr_d1_draft = GFS0P25 .select('downward_shortwave_radiation_flux') .filterDate(today, today.advance(6,'hour')) .filter(ee.Filter.lt('forecast_time',today.advance(1,'day').millis())) .filter(ee.Filter.inList('forecast_hours', [6,12,18,24])) .mean(); // make a composite of the collection var sr_d1 = sr_d1_draft.clip(bbox);

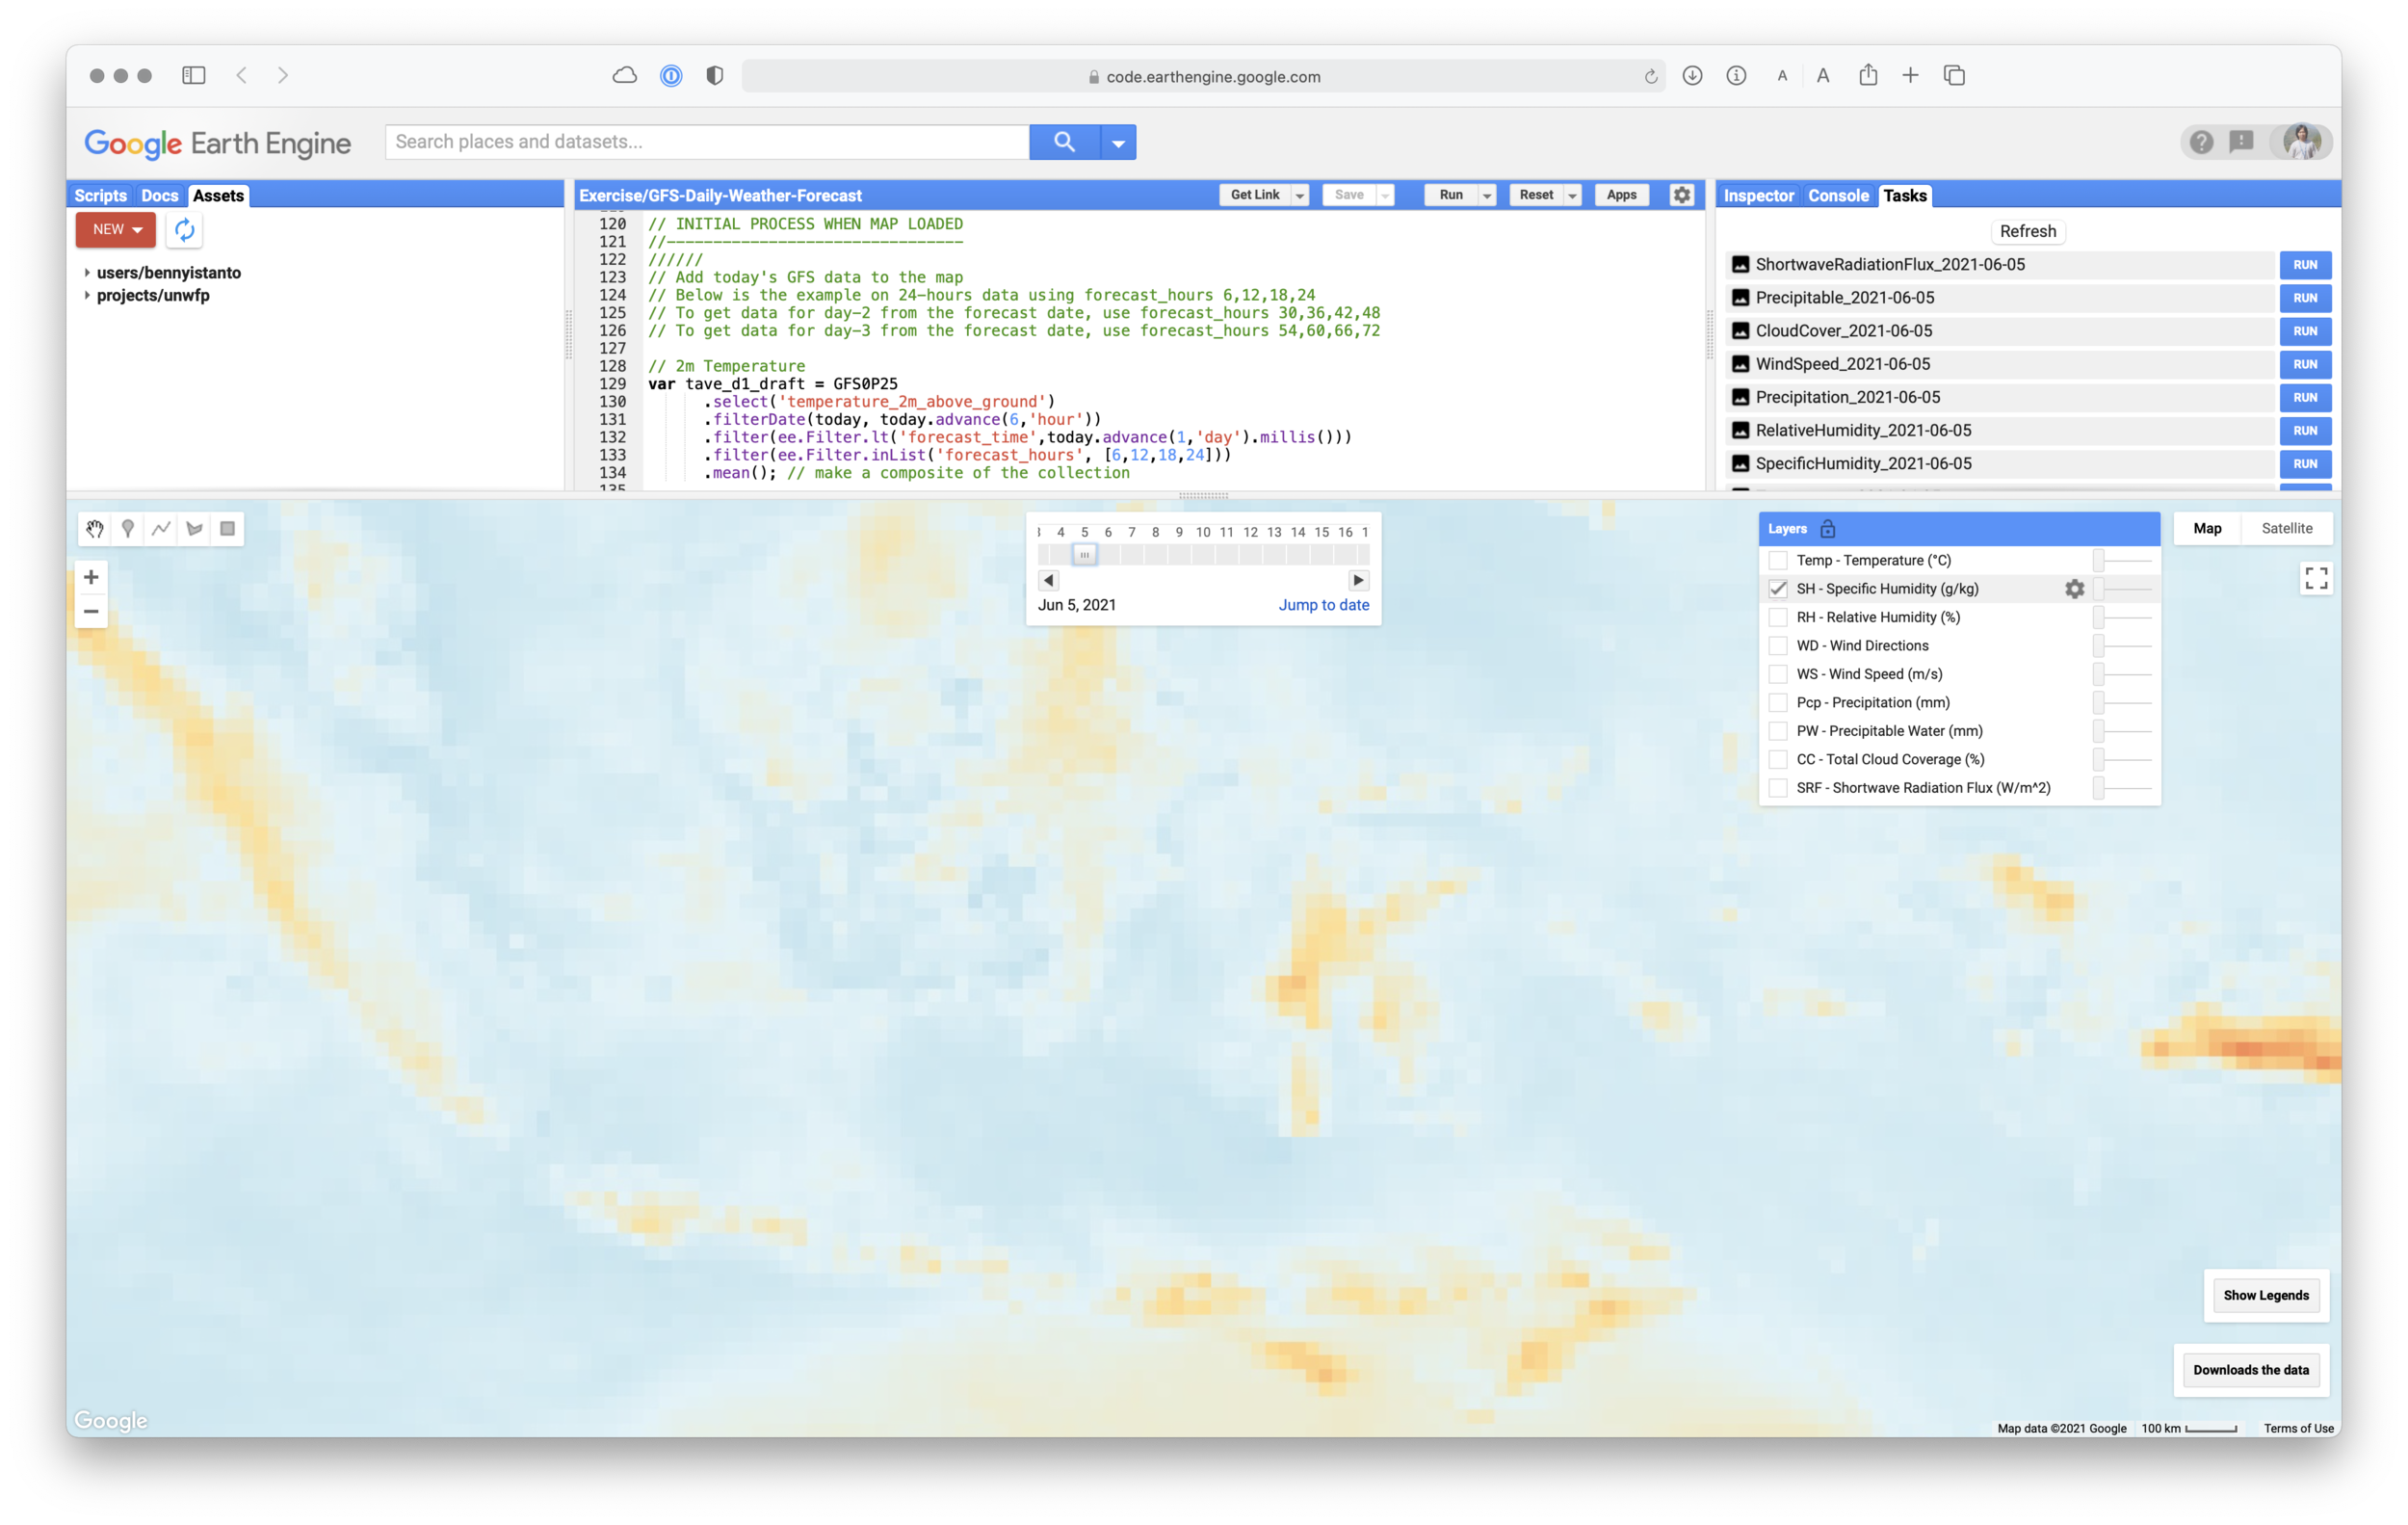
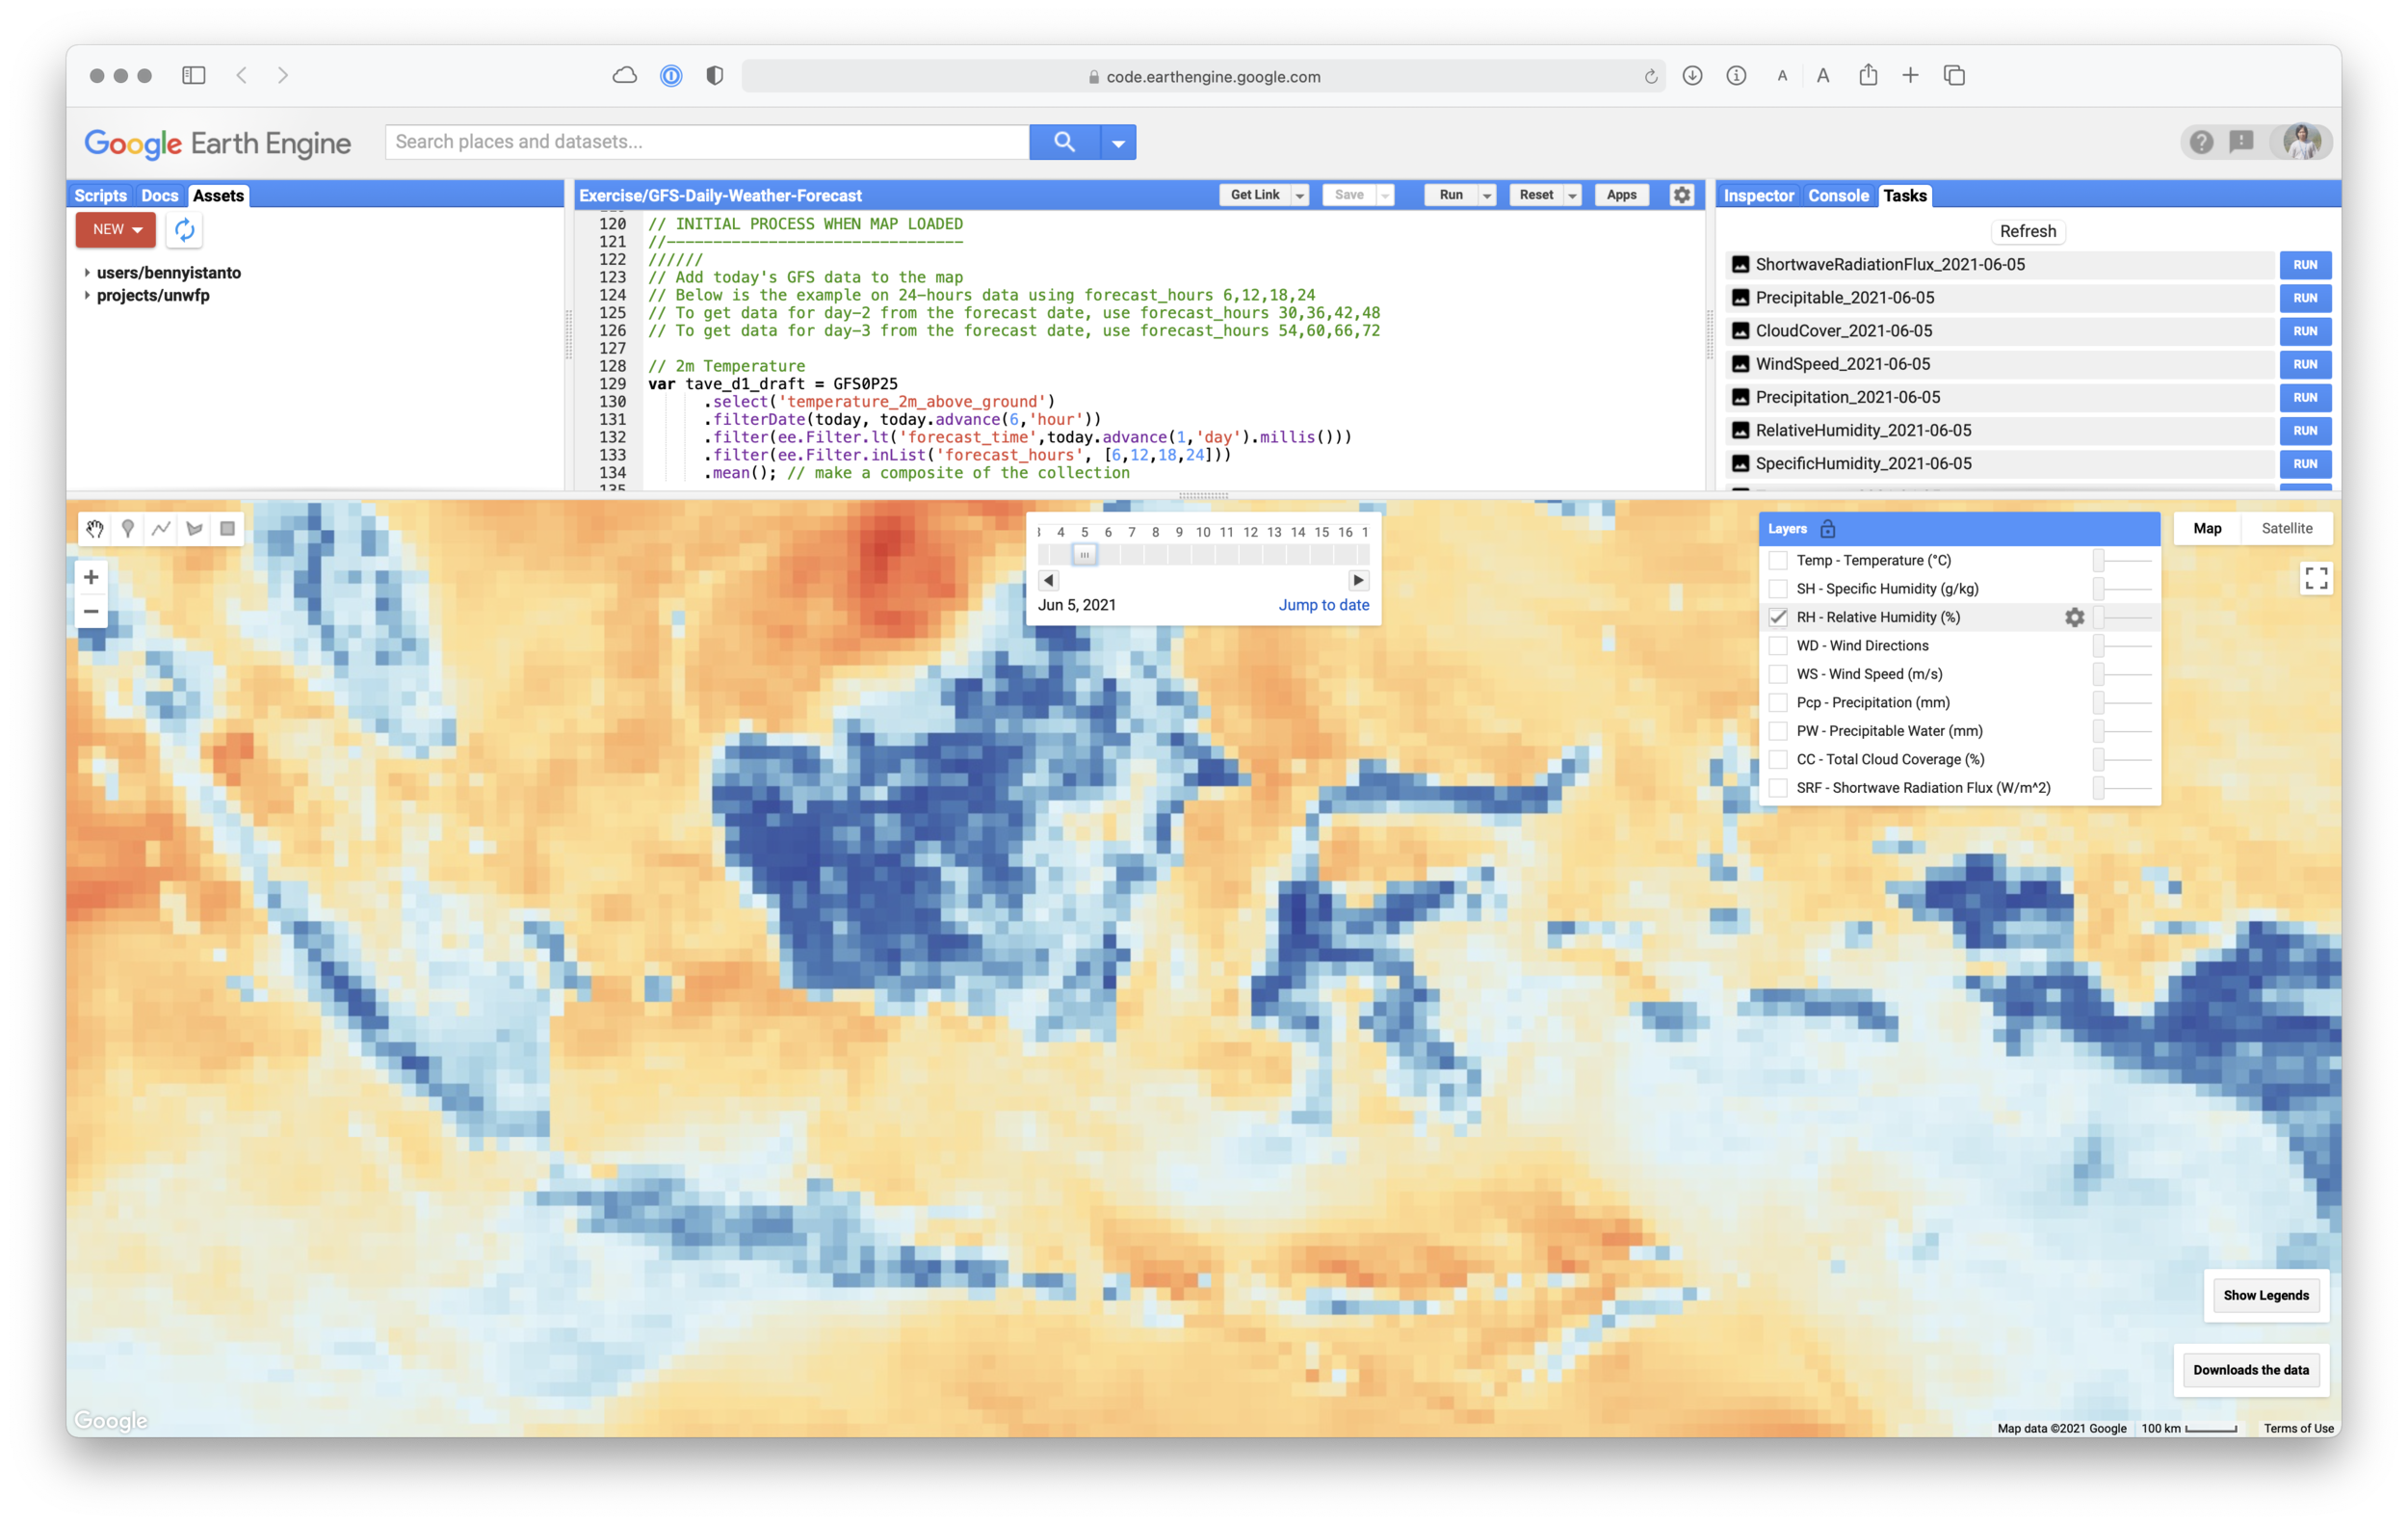
Next script will be adding all layer to the display.

I am planning to use Date Slider widget, so the user can easily change the date then the map will automatically change. To support that plan, I need to add Reset procedure, so every change on the data, all layers will get refresh.

// ui Map Layer // Load the image into map using standard symbology var layer_sr_d1 = ui.Map.Layer(sr_d1,visSR,'SRF - Shortwave Radiation Flux (W/m^2)', false); var layer_cc_d1 = ui.Map.Layer(cc_d1,visCC,'CC - Total Cloud Coverage (%)', false); var layer_pw_d1 = ui.Map.Layer(pw_d1,visPW,'PW - Precipitable Water (mm)', false); var layer_pcp_d1 = ui.Map.Layer(pcp_d1,visPcp,'Pcp - Precipitation (mm)', false); var layer_uv_d1 = ui.Map.Layer(uv_d1,visWind,'WS - Wind Speed (m/s)', false); var layer_vectors_d1 = ui.Map.Layer(vectors_d1.style({ color: 'white', width: 1 }), {}, 'WD - Wind Directions', false); var layer_rh_d1 = ui.Map.Layer(rh_d1,visRH,'RH - Relative Humidity (%)', false); var layer_sh_d1 = ui.Map.Layer(sh_d1,visSH,'SH - Specific Humidity (g/kg)', false); var layer_tave_d1 = ui.Map.Layer(tave_d1,visTave,'Temp - Temperature (°C)', true); // Reset all layers Map.layers().reset([ layer_sr_d1,layer_cc_d1,layer_pw_d1,layer_pcp_d1, layer_uv_d1,layer_vectors_d1,layer_rh_d1,layer_sh_d1,layer_tave_d1 ]);

Let’s add Date Slider configuration to Map.

According to the reference, Date Slider required some arguments: start, end, value, period, onChange, disabled, style

// DATE SLIDER CONFIGURATION //-------------------------- ////// var startDate = start_period.getInfo(); var endDate = today.advance(24,'hour').getInfo(); // Slider function var slider = ui.DateSlider({ start: startDate.value, end: endDate.value, period: 1, // Every 5 days style: {width: '300px', padding: '10px'}, onChange: renderDateRange }); Map.add(slider);

Then the following code will follow to describe the renderDateRange function when the Date Slide onChange is active. The code is similar with initial process when map loaded above..

// Render date range function function renderDateRange(dateRange) { // 24-hours/1-day/Day-1 forecast from selected date // 2m Temperature var tave_d1_draft = GFS0P25 .select('temperature_2m_above_ground') .filterDate(dateRange.start(), dateRange.end().advance(6,'hour')) .filter(ee.Filter.lt('forecast_time',today.advance(1,'day').millis())) .filter(ee.Filter.inList('forecast_hours', [6,12,18,24])) .mean(); // make a composite of the collection var tave_d1 = tave_d1_draft.clip(bbox); // 2m Specific Humidity var sh_d1_draft = GFS0P25 .select('specific_humidity_2m_above_ground') .filterDate(dateRange.start(), dateRange.end().advance(6,'hour')) .filter(ee.Filter.lt('forecast_time',today.advance(1,'day').millis())) .filter(ee.Filter.inList('forecast_hours', [6,12,18,24])) .mean(); // make a composite of the collection // SH unit in GFS is kg/kg, I want to convert it to g/kg // This means that such humidity is expressed as the amount of // water vapour (in grams) present in each kilogram of air var sh_d1 = sh_d1_draft.expression( 'SHg = SHkg * 1000', { 'SHkg': sh_d1_draft.select('specific_humidity_2m_above_ground') }).float().clip(bbox); // 2m Relative Humidity var rh_d1_draft = GFS0P25 .select('relative_humidity_2m_above_ground') .filterDate(dateRange.start(), dateRange.end().advance(6,'hour')) .filter(ee.Filter.lt('forecast_time',today.advance(1,'day').millis())) .filter(ee.Filter.inList('forecast_hours', [6,12,18,24])) .mean(); // make a composite of the collection var rh_d1 = rh_d1_draft.clip(bbox); // 10m wind var uv_d1_draft = GFS0P25 .select(['u_component_of_wind_10m_above_ground', 'v_component_of_wind_10m_above_ground']) .filterDate(dateRange.start(), dateRange.end().advance(6,'hour')) .filter(ee.Filter.lt('forecast_time',today.advance(1,'day').millis())) .filter(ee.Filter.inList('forecast_hours', [6,12,18,24])) .mean(); // make a composite of the collection // Wind speed and direction //--- // Based on code from Gennadii Donchyts // https://code.earthengine.google.com/320ee5bc81f2de3ae49f348f8ec9a6d7 var uv_d1_0 = uv_d1_draft.clip(bbox); var scale = Map.getScale() * 10; //25000 var numPixels = 1e10; var samples = uv_d1_0.rename(['u10', 'v10']).sample({ region: bbox, scale: scale, numPixels: numPixels, geometries: true }); var scaleVector = 0.1; var vectors_d1 = samples.map(function(f) { var u = ee.Number(f.get('u10')).multiply(scaleVector); var v = ee.Number(f.get('v10')).multiply(scaleVector); var origin = f.geometry(); // translate var proj = origin.projection().translate(u, v); var end = ee.Geometry.Point(origin.transform(proj).coordinates()); // construct line var geom = ee.Algorithms.GeometryConstructors.LineString([origin, end], null, true); return f.setGeometry(geom); }); var uv_d1 = uv_d1_0.pow(2).reduce(ee.Reducer.sum()).sqrt(); // Precipitation var pcp_d1_draft = GFS0P25 .select('total_precipitation_surface') .filterDate(dateRange.start(), dateRange.end().advance(6,'hour')) .filter(ee.Filter.lt('forecast_time',today.advance(1,'day').millis())) .filter(ee.Filter.inList('forecast_hours', [6,12,18,24])) .sum(); // make a composite of the collection var pcp_d1 = pcp_d1_draft.updateMask(pcp_d1_draft.gt(1)).clip(bbox); // Precipitable Water var pw_d1_draft = GFS0P25 .select('precipitable_water_entire_atmosphere') .filterDate(dateRange.start(), dateRange.end().advance(6,'hour')) .filter(ee.Filter.lt('forecast_time',today.advance(1,'day').millis())) .filter(ee.Filter.inList('forecast_hours', [6,12,18,24])) .mean(); // make a composite of the collection var pw_d1 = pw_d1_draft.clip(bbox); // Total Cloud Cover var cc_d1_draft = GFS0P25 .select('total_cloud_cover_entire_atmosphere') .filterDate(dateRange.start(), dateRange.end().advance(6,'hour')) .filter(ee.Filter.lt('forecast_time',today.advance(1,'day').millis())) .filter(ee.Filter.inList('forecast_hours', [6,12,18,24])) .mean(); // make a composite of the collection var cc_d1 = cc_d1_draft.clip(bbox); // Downward Shortwave Radiation Flux var sr_d1_draft = GFS0P25 .select('downward_shortwave_radiation_flux') .filterDate(dateRange.start(), dateRange.end().advance(6,'hour')) .filter(ee.Filter.lt('forecast_time',today.advance(1,'day').millis())) .filter(ee.Filter.inList('forecast_hours', [6,12,18,24])) .mean(); // make a composite of the collection var sr_d1 = sr_d1_draft.clip(bbox); // Load the image into map using standard symbology var layer_sr_d1 = ui.Map.Layer(sr_d1,visSR,'SRF - Shortwave Radiation Flux (W/m^2)', false); var layer_cc_d1 = ui.Map.Layer(cc_d1,visCC,'CC - Total Cloud Coverage (%)', false); var layer_pw_d1 = ui.Map.Layer(pw_d1,visPW,'PW - Precipitable Water (mm)', false); var layer_pcp_d1 = ui.Map.Layer(pcp_d1,visPcp,'Pcp - Precipitation (mm)', false); var layer_uv_d1 = ui.Map.Layer(uv_d1,visWind,'WS - Wind Speed (m/s)', false); var layer_vectors_d1 = ui.Map.Layer(vectors_d1.style({ color: 'white', width: 1 }), {}, 'WD - Wind Directions', false); var layer_rh_d1 = ui.Map.Layer(rh_d1,visRH,'RH - Relative Humidity (%)', false); var layer_sh_d1 = ui.Map.Layer(sh_d1,visSH,'SH - Specific Humidity (g/kg)', false); var layer_tave_d1 = ui.Map.Layer(tave_d1,visTave,'Temp - Temperature (°C)', true); // Reset all layers Map.layers().reset([ layer_sr_d1,layer_cc_d1,layer_pw_d1,layer_pcp_d1, layer_uv_d1,layer_vectors_d1,layer_rh_d1,layer_sh_d1,layer_tave_d1 ]); }

Next, I would like to add Download button, so user can easily download all the variable and save it into Google Drive for whatever date they choose. The filename convention will be NameOfVariable_YYYY-MM-DD

// DATA DOWNLOAD //--------------------- ////// // Add download button to panel var download = ui.Button({ label: 'Downloads the data', style: {position: 'bottom-right', color: 'black'}, onClick: function() { // As the download request probably takes some time, we need to warn the user, // so they not repeating click the download button alert("If you see this message, the download request is started! Please go to Tasks, wait until the download list appear. Click RUN for each data you want to download"); // Downloading data // Export the result to Google Drive var dt = ee.Date(slider.getValue()[0]); // Temperature Export.image.toDrive({ image:tave_d1, description:'Temperature_' + dt.format('yyyy-MM-dd').getInfo(), folder:'GEE_GFS', scale:projection.nominalScale(), region:bbox, maxPixels:1e12 }); // Specific Humidity Export.image.toDrive({ image:sh_d1, description:'SpecificHumidity_' + dt.format('yyyy-MM-dd').getInfo(), folder:'GEE_GFS', scale:projection.nominalScale(), region:bbox, maxPixels:1e12 }); // Relative Humidity Export.image.toDrive({ image:rh_d1, description:'RelativeHumidity_' + dt.format('yyyy-MM-dd').getInfo(), folder:'GEE_GFS', scale:projection.nominalScale(), region:bbox, maxPixels:1e12 }); // Wind Speed Export.image.toDrive({ image:uv_d1, description:'WindSpeed_' + dt.format('yyyy-MM-dd').getInfo(), folder:'GEE_GFS', scale:projection.nominalScale(), region:bbox, maxPixels:1e12 }); // Precipitation Export.image.toDrive({ image:pcp_d1, description:'Precipitation_' + dt.format('yyyy-MM-dd').getInfo(), folder:'GEE_GFS', scale:projection.nominalScale(), region:bbox, maxPixels:1e12 }); // Precipitable Water Export.image.toDrive({ image:pw_d1, description:'Precipitable_' + dt.format('yyyy-MM-dd').getInfo(), folder:'GEE_GFS', scale:projection.nominalScale(), region:bbox, maxPixels:1e12 }); // Cloud Cover Export.image.toDrive({ image:cc_d1, description:'CloudCover_' + dt.format('yyyy-MM-dd').getInfo(), folder:'GEE_GFS', scale:projection.nominalScale(), region:bbox, maxPixels:1e12 }); // Shortwave Radiation Flux Export.image.toDrive({ image:sr_d1, description:'ShortwaveRadiationFlux_' + dt.format('yyyy-MM-dd').getInfo(), folder:'GEE_GFS', scale:projection.nominalScale(), region:bbox, maxPixels:1e12 }); print('Data Downloaded!', dt); } }); // Add the button to the map and the panel to root. Map.add(download);

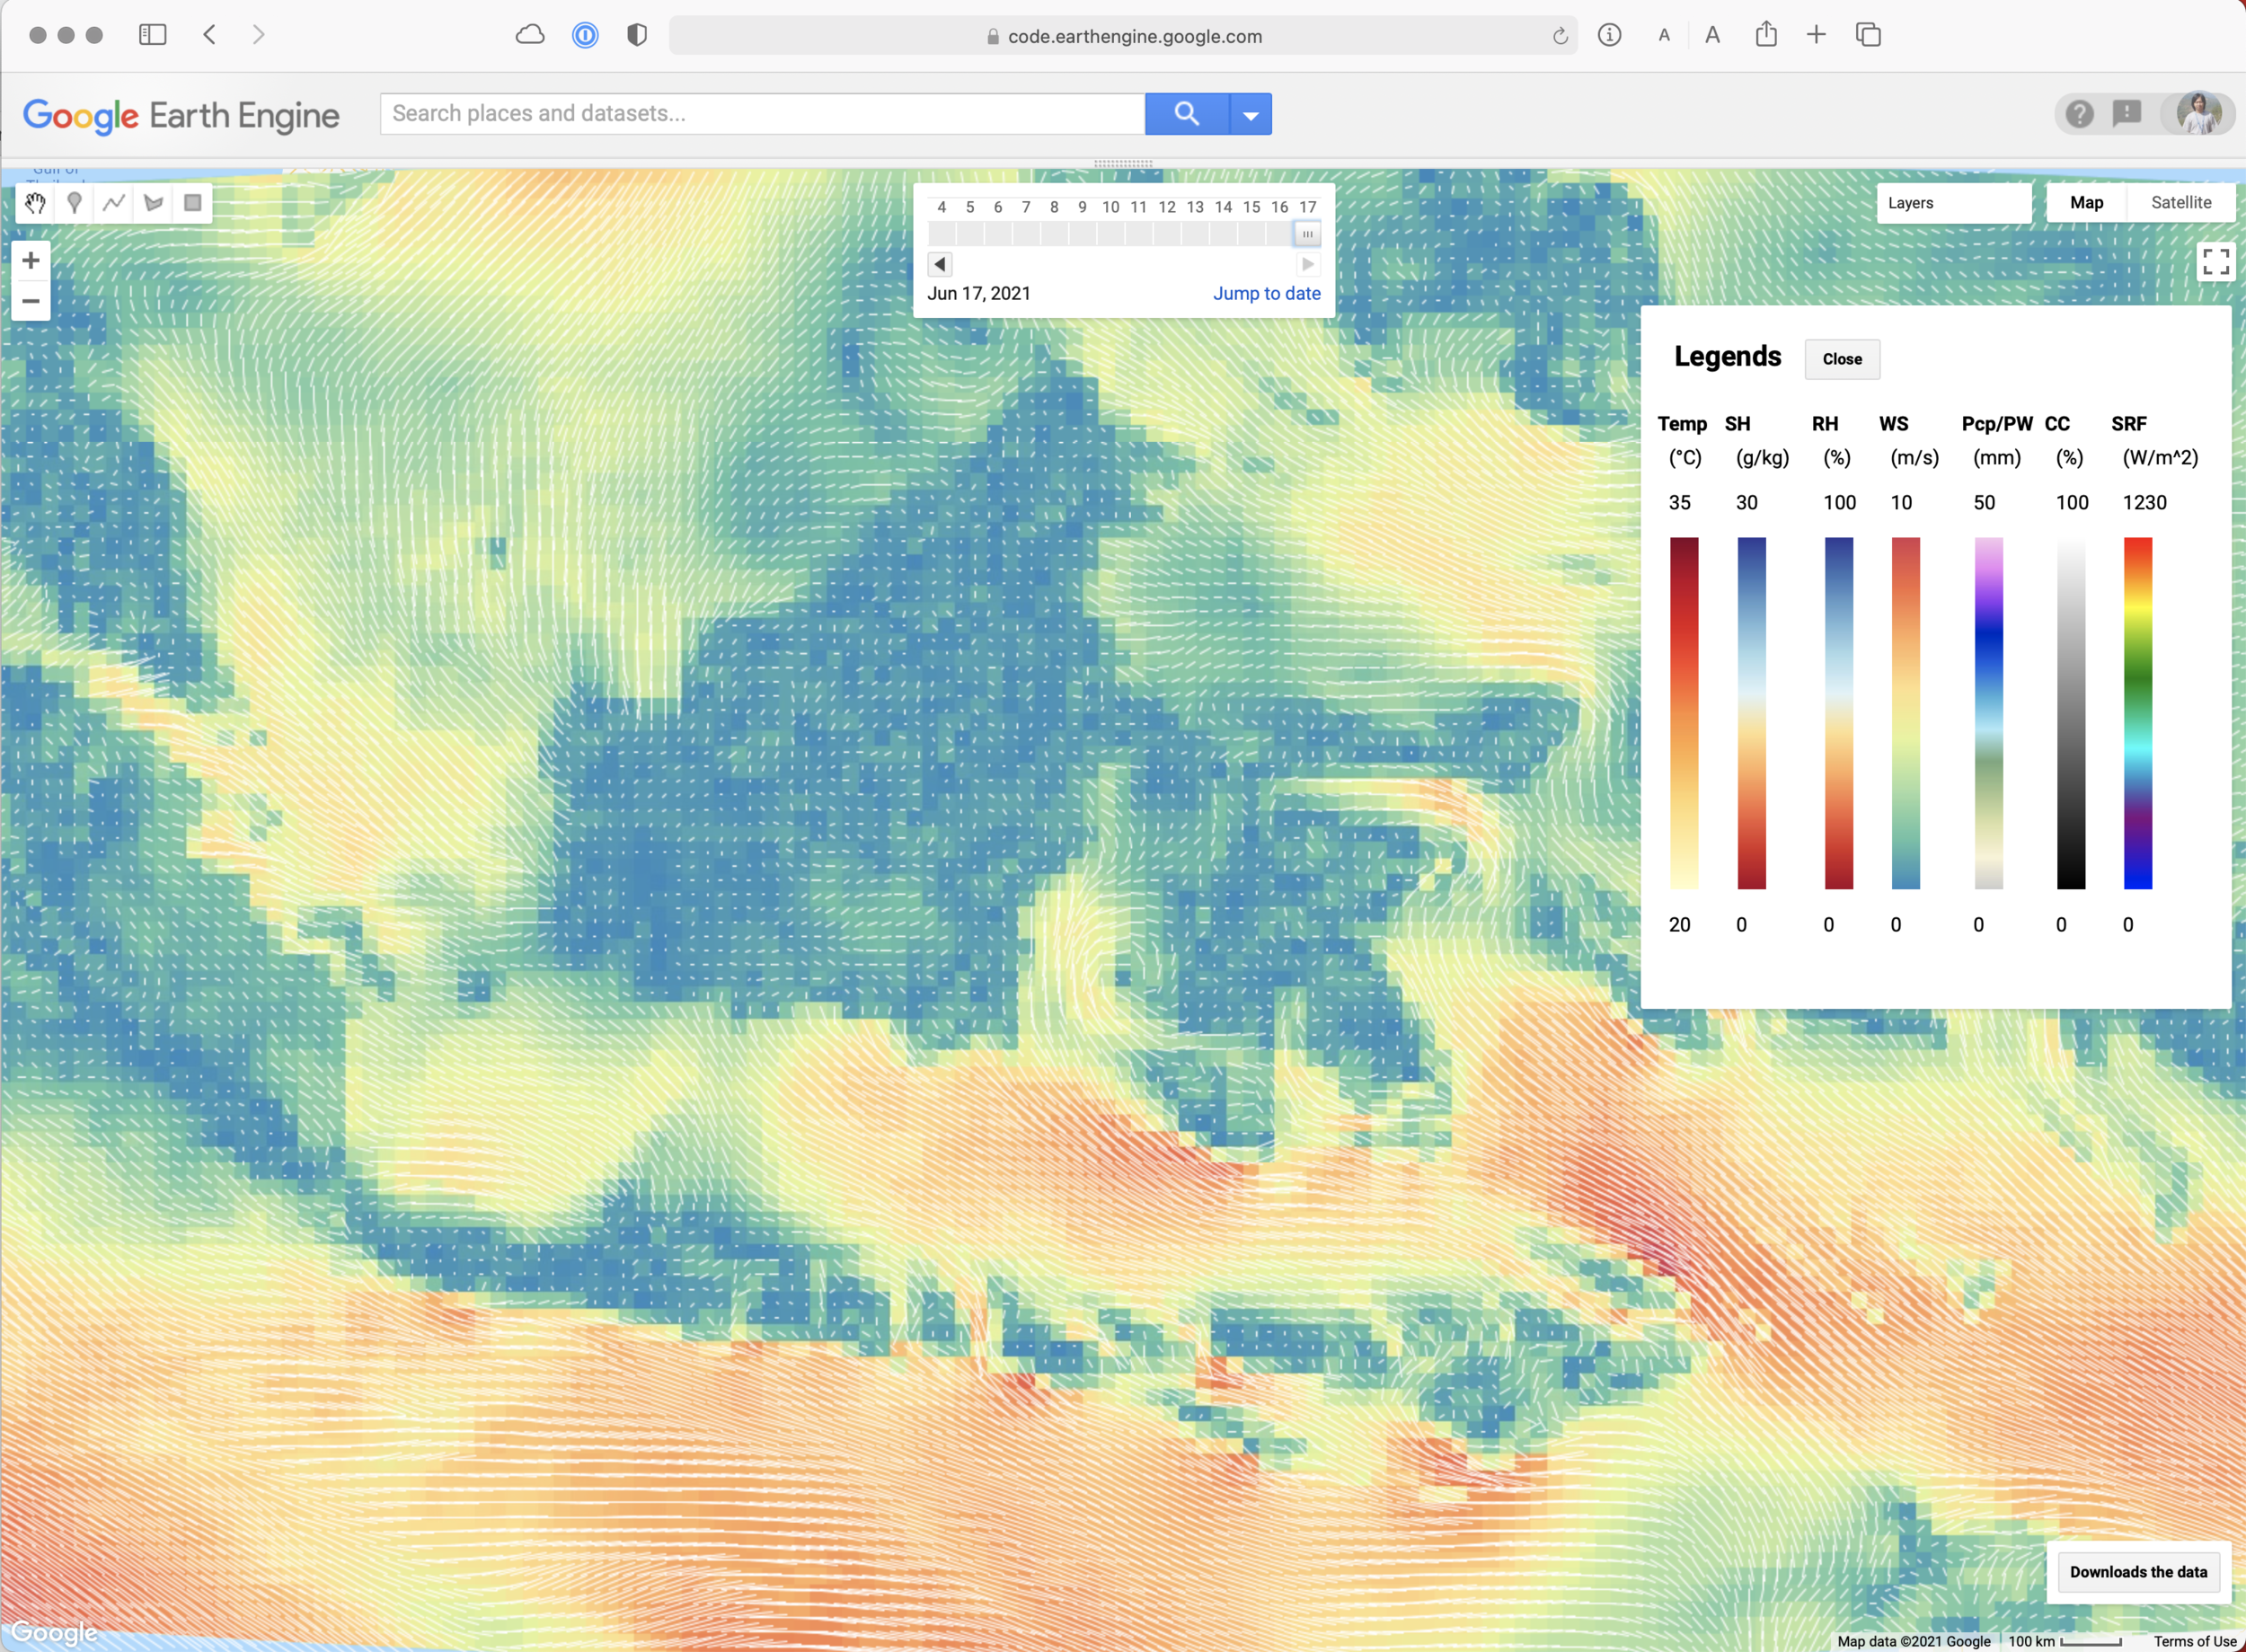
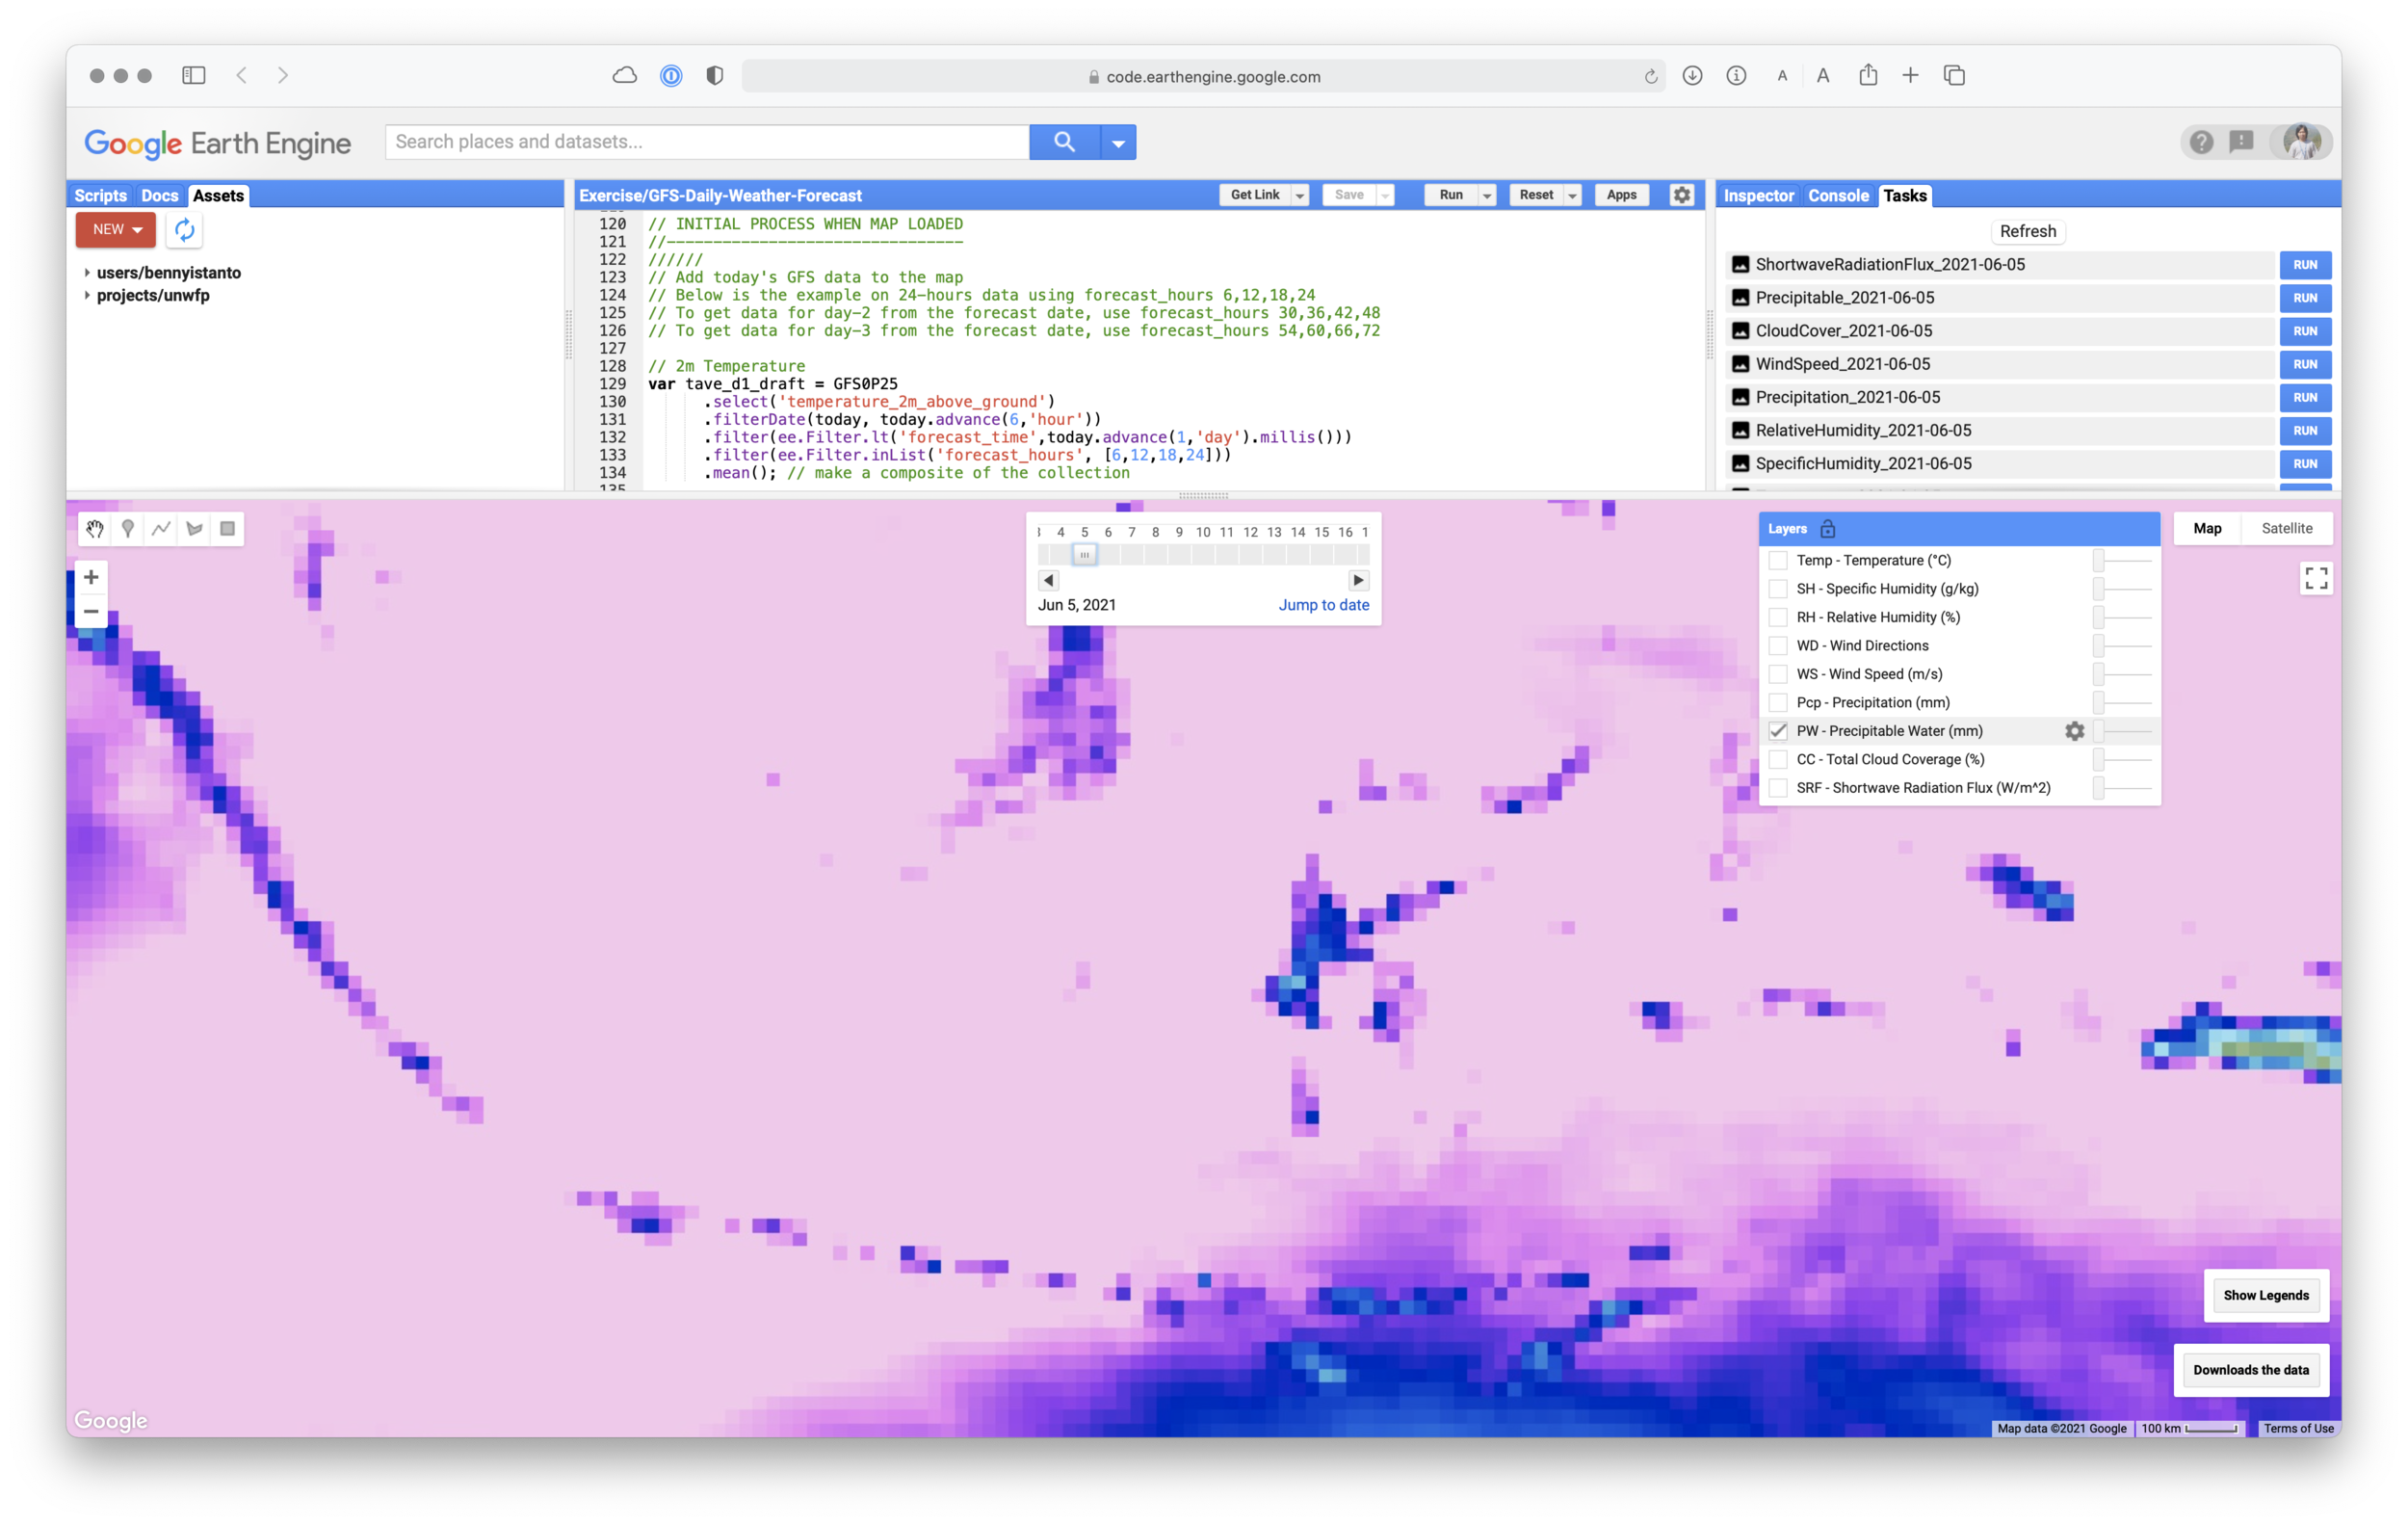
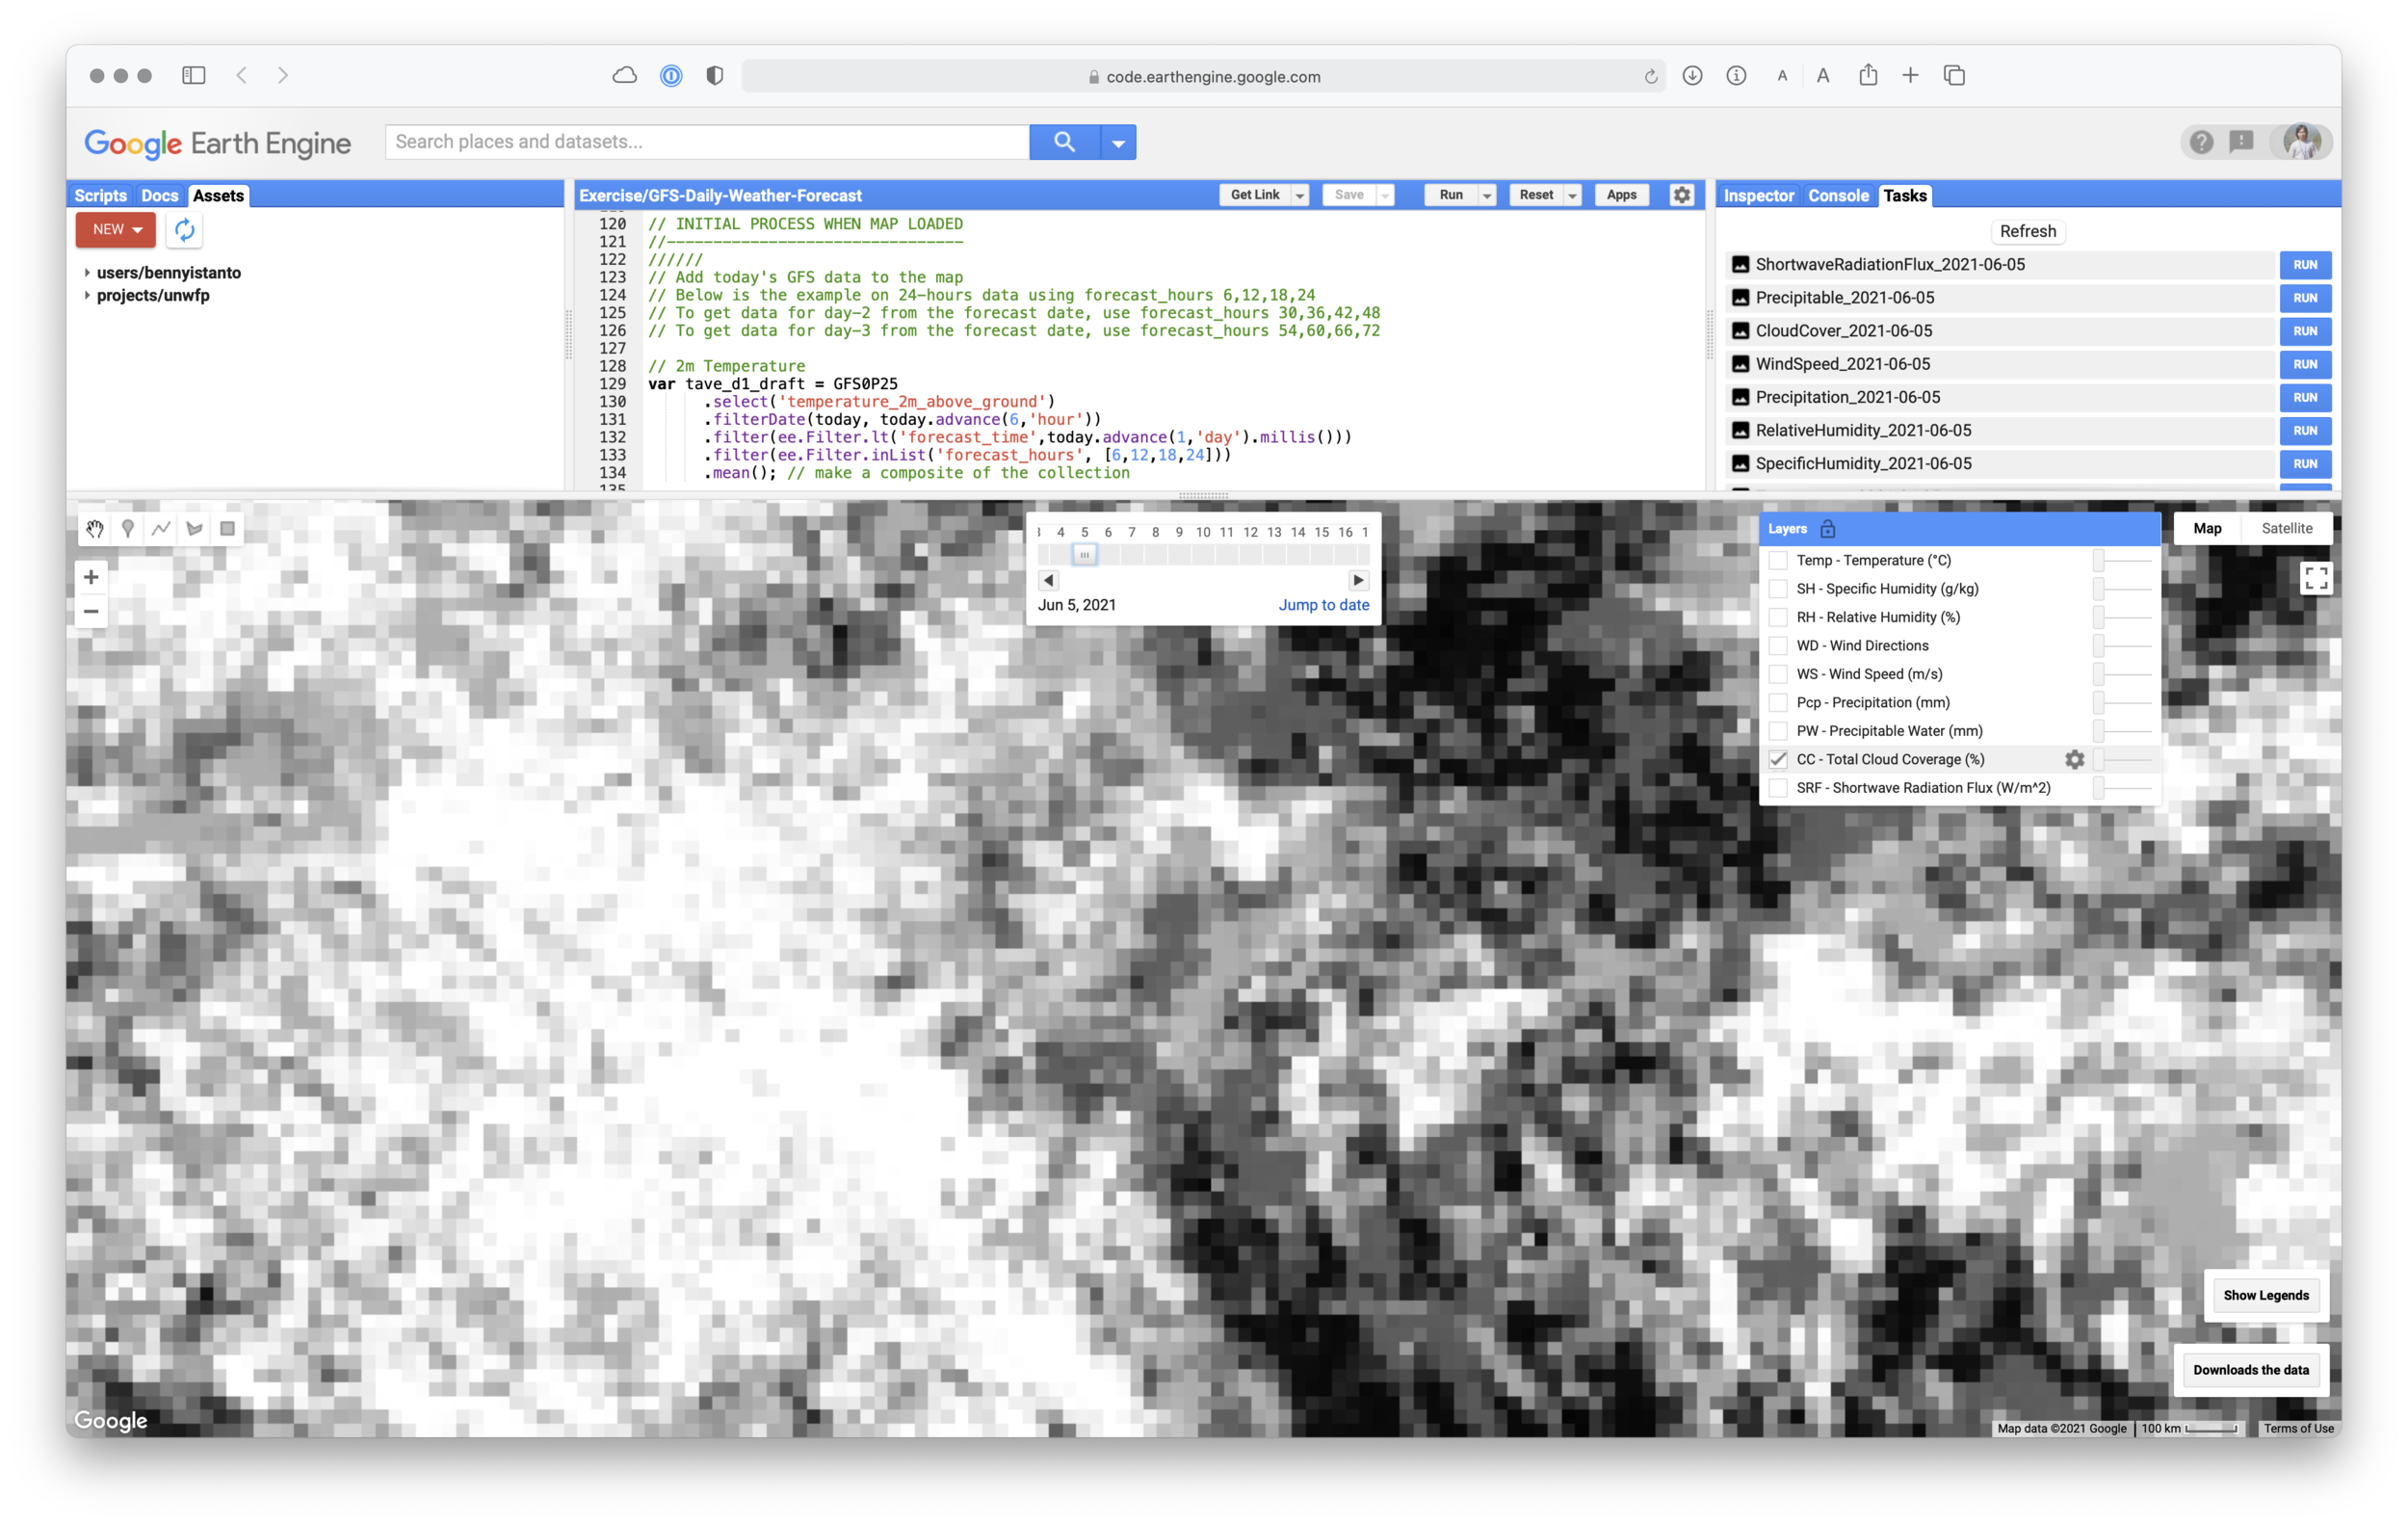
I would like to display all legend for all layer in a one place. To achieve the goal, I need to define some parameters: position in the panel, widget for each feature (title, unit, min-max value and a vertical ramp color as thumbnail image.

// LEGEND CONFIGURATION //--------------------- ////// // Temperature legend // Create legend title var TaveLegendTitle = ui.Label({value: 'Temp',style: {fontWeight: 'bold',fontSize: '14px', margin: '0 0 4px 10',padding: '0'}}); // Create text on top of legend var Taveunit = ui.Label({value:'(°C)'}); var TaveunitMax = ui.Label({value: '35'}); // Create the legend image var lon = ee.Image.pixelLonLat().select('latitude'); var TaveGradient = lon.multiply((visTave.max-visTave.min)/100.0).add(visTave.min); var TaveLegendImage = TaveGradient.visualize(visTave); var TaveThumb = ui.Thumbnail({image: TaveLegendImage,params: {bbox:'0,0,20,100', dimensions:'20x250'}, style: {padding: '1px', position: 'bottom-center'}}); var TaveunitMin = ui.Label({value: '20'}); // Set position of panel var TaveLegend = ui.Panel({ widgets: [TaveLegendTitle, Taveunit, TaveunitMax, TaveThumb, TaveunitMin], style: {position: 'bottom-left',padding: '8px 4px'}}); ////// ////// // Specific Humidity legend // Create legend title var SHLegendTitle = ui.Label({value: 'SH',style: {fontWeight: 'bold',fontSize: '14px', margin: '0 0 4px 10',padding: '0'}}); // Create text on top of legend var SHunit = ui.Label({value:'(g/kg)'}); var SHunitMax = ui.Label({value: '30'}); // Create the legend image var lon = ee.Image.pixelLonLat().select('latitude'); var SHGradient = lon.multiply((visSH.max-visSH.min)/100.0).add(visSH.min); var SHLegendImage = SHGradient.visualize(visSH); var SHThumb = ui.Thumbnail({image: SHLegendImage,params: {bbox:'0,0,20,100', dimensions:'20x250'}, style: {padding: '1px', position: 'bottom-center'}}); var SHunitMin = ui.Label({value: '0'}); // Set position of panel var SHLegend = ui.Panel({ widgets: [SHLegendTitle, SHunit, SHunitMax, SHThumb, SHunitMin], style: {position: 'bottom-left',padding: '8px 4px'}}); ////// ////// // Relative Humidity legend // Create legend title var RHLegendTitle = ui.Label({value: 'RH',style: {fontWeight: 'bold',fontSize: '14px', margin: '0 0 4px 10',padding: '0'}}); // Create text on top of legend var RHunit = ui.Label({value:'(%)'}); var RHunitMax = ui.Label({value: '100'}); // Create the legend image var lon = ee.Image.pixelLonLat().select('latitude'); var RHGradient = lon.multiply((visRH.max-visRH.min)/100.0).add(visRH.min); var RHLegendImage = RHGradient.visualize(visRH); var RHThumb = ui.Thumbnail({image: RHLegendImage,params: {bbox:'0,0,20,100', dimensions:'20x250'}, style: {padding: '1px', position: 'bottom-center'}}); var RHunitMin = ui.Label({value: '0'}); // Set position of panel var RHLegend = ui.Panel({ widgets: [RHLegendTitle, RHunit, RHunitMax, RHThumb, RHunitMin], style: {position: 'bottom-left',padding: '8px 4px'}}); ////// ////// // Wind Speed legend // Create legend title var WSLegendTitle = ui.Label({value: 'WS',style: {fontWeight: 'bold',fontSize: '14px', margin: '0 0 4px 10',padding: '0'}}); // Create text on top of legend var WSunit = ui.Label({value:'(m/s)'}); var WSunitMax = ui.Label({value: '10'}); // Create the legend image var lon = ee.Image.pixelLonLat().select('latitude'); var WSGradient = lon.multiply((visWind.max-visWind.min)/100.0).add(visWind.min); var WSLegendImage = WSGradient.visualize(visWind); var WSThumb = ui.Thumbnail({image: WSLegendImage,params: {bbox:'0,0,20,100', dimensions:'20x250'}, style: {padding: '1px', position: 'bottom-center'}}); var WSunitMin = ui.Label({value: '0'}); // Set position of panel var WSLegend = ui.Panel({ widgets: [WSLegendTitle, WSunit, WSunitMax, WSThumb, WSunitMin], style: {position: 'bottom-left',padding: '8px 4px'}}); ////// ////// // Precipitation and Precipitable Water legend // Create legend title var PcpLegendTitle = ui.Label({value: 'Pcp/PW',style: {fontWeight: 'bold',fontSize: '14px', margin: '0 0 4px 10',padding: '0'}}); // Create text on top of legend var Pcpunit = ui.Label({value:'(mm)'}); var PcpunitMax = ui.Label({value: '50'}); // Create the legend image var lon = ee.Image.pixelLonLat().select('latitude'); var PcpGradient = lon.multiply((visPcp.max-visPcp.min)/100.0).add(visPcp.min); var PcpLegendImage = PcpGradient.visualize(visPcp); var PcpThumb = ui.Thumbnail({image: PcpLegendImage,params: {bbox:'0,0,20,100', dimensions:'20x250'}, style: {padding: '1px', position: 'bottom-center'}}); var PcpunitMin = ui.Label({value: '0'}); // Set position of panel var PcpLegend = ui.Panel({ widgets: [PcpLegendTitle, Pcpunit, PcpunitMax, PcpThumb, PcpunitMin], style: {position: 'bottom-left',padding: '8px 4px'}}); ////// ////// // Cloud Coverage legend // Create legend title var CCLegendTitle = ui.Label({value: 'CC',style: {fontWeight: 'bold',fontSize: '14px', margin: '0 0 4px 10',padding: '0'}}); // Create text on top of legend var CCunit = ui.Label({value:'(%)'}); var CCunitMax = ui.Label({value: '100'}); // Create the legend image var lon = ee.Image.pixelLonLat().select('latitude'); var CCGradient = lon.multiply((visCC.max-visCC.min)/100.0).add(visCC.min); var CCLegendImage = CCGradient.visualize(visCC); var CCThumb = ui.Thumbnail({image: CCLegendImage,params: {bbox:'0,0,20,100', dimensions:'20x250'}, style: {padding: '1px', position: 'bottom-center'}}); var CCunitMin = ui.Label({value: '0'}); // Set position of panel var CCLegend = ui.Panel({ widgets: [CCLegendTitle, CCunit, CCunitMax, CCThumb, CCunitMin], style: {position: 'bottom-left',padding: '8px 4px'}}); ////// ////// // Shortwave Radiation Flux legend // Create legend title var SRLegendTitle = ui.Label({value: 'SRF',style: {fontWeight: 'bold',fontSize: '14px', margin: '0 0 4px 10',padding: '0'}}); // Create text on top of legend var SRunit = ui.Label({value:'(W/m^2)'}); var SRunitMax = ui.Label({value: '1230'}); // Create the legend image var lon = ee.Image.pixelLonLat().select('latitude'); var SRGradient = lon.multiply((visSR.max-visSR.min)/100.0).add(visSR.min); var SRLegendImage = SRGradient.visualize(visSR); var SRThumb = ui.Thumbnail({image: SRLegendImage,params: {bbox:'0,0,20,100', dimensions:'20x250'}, style: {padding: '1px', position: 'bottom-center'}}); var SRunitMin = ui.Label({value: '0'}); // Set position of panel var SRLegend = ui.Panel({ widgets: [SRLegendTitle, SRunit, SRunitMax, SRThumb, SRunitMin], style: {position: 'bottom-left',padding: '8px 4px'}}); //////

Last configuration will be adding a panel for Legends. As I will display all the legend together, it will take up a space. So activate the panel through the button click are good idea, then I need to add additional button to hide the legend panel if not needed.

////// // Panel Legends // Vertical ramp color var vertRamp = ui.Panel({ widgets: [TaveLegend, SHLegend, RHLegend, WSLegend, PcpLegend, CCLegend, SRLegend], layout: ui.Panel.Layout.Flow('horizontal') }); var panel_legends = ui.Panel(); panel_legends.style().set({ width: '420px', height: '500px', position: 'top-right', color: 'black', shown: false }); Map.add(panel_legends); // Legend title var Lintro = ui.Panel([ ui.Label({ value: 'Legends', style: {fontSize: '20px', fontWeight: 'bold'} }), ]); // Add a button to close legend // Add a button to hide the Panel. var Closebut = ui.Button({label: 'Close', style: {color: 'black'}, onClick: function() { panel_legends.style().set('shown', false); button.style().set('shown', true); } }); // // Add a button to hide the Panel. var buts = ui.Panel({layout: ui.Panel.Layout.flow('horizontal'), widgets:[Lintro, Closebut], style: {width: '420px', height: '60px', position:'top-right'}}); panel_legends.add(buts); panel_legends.add(vertRamp); // Create a button to unhide the panel. var button = ui.Button({ label: 'Show Legends', style: {position: 'bottom-right', color: 'black'}, onClick: function() { // Hide the button. button.style().set('shown', false); // Display the panel. panel_legends.style().set('shown', true); // Temporarily make a map click hide the panel // and show the button. var listenerId = Map.onClick(function() { panel_legends.style().set('shown', false); button.style().set('shown', true); // Once the panel is hidden, the map should not try to close it by listening for clicks. Map.unlisten(listenerId); }); } }); // Add the button to the map and the panel to root. Map.add(button);


Link for the full code


Notes: The code was compiled from various source (GEE help, GEE Groups, StackExchange)

Previous
Previous

Farewell WFP!

Next
Next

Ninth year and the 2020 Nobel Peace Prize Laureate