TerraClimate EDDI
Evaporative Demand Drought Index, 1950 to 2025
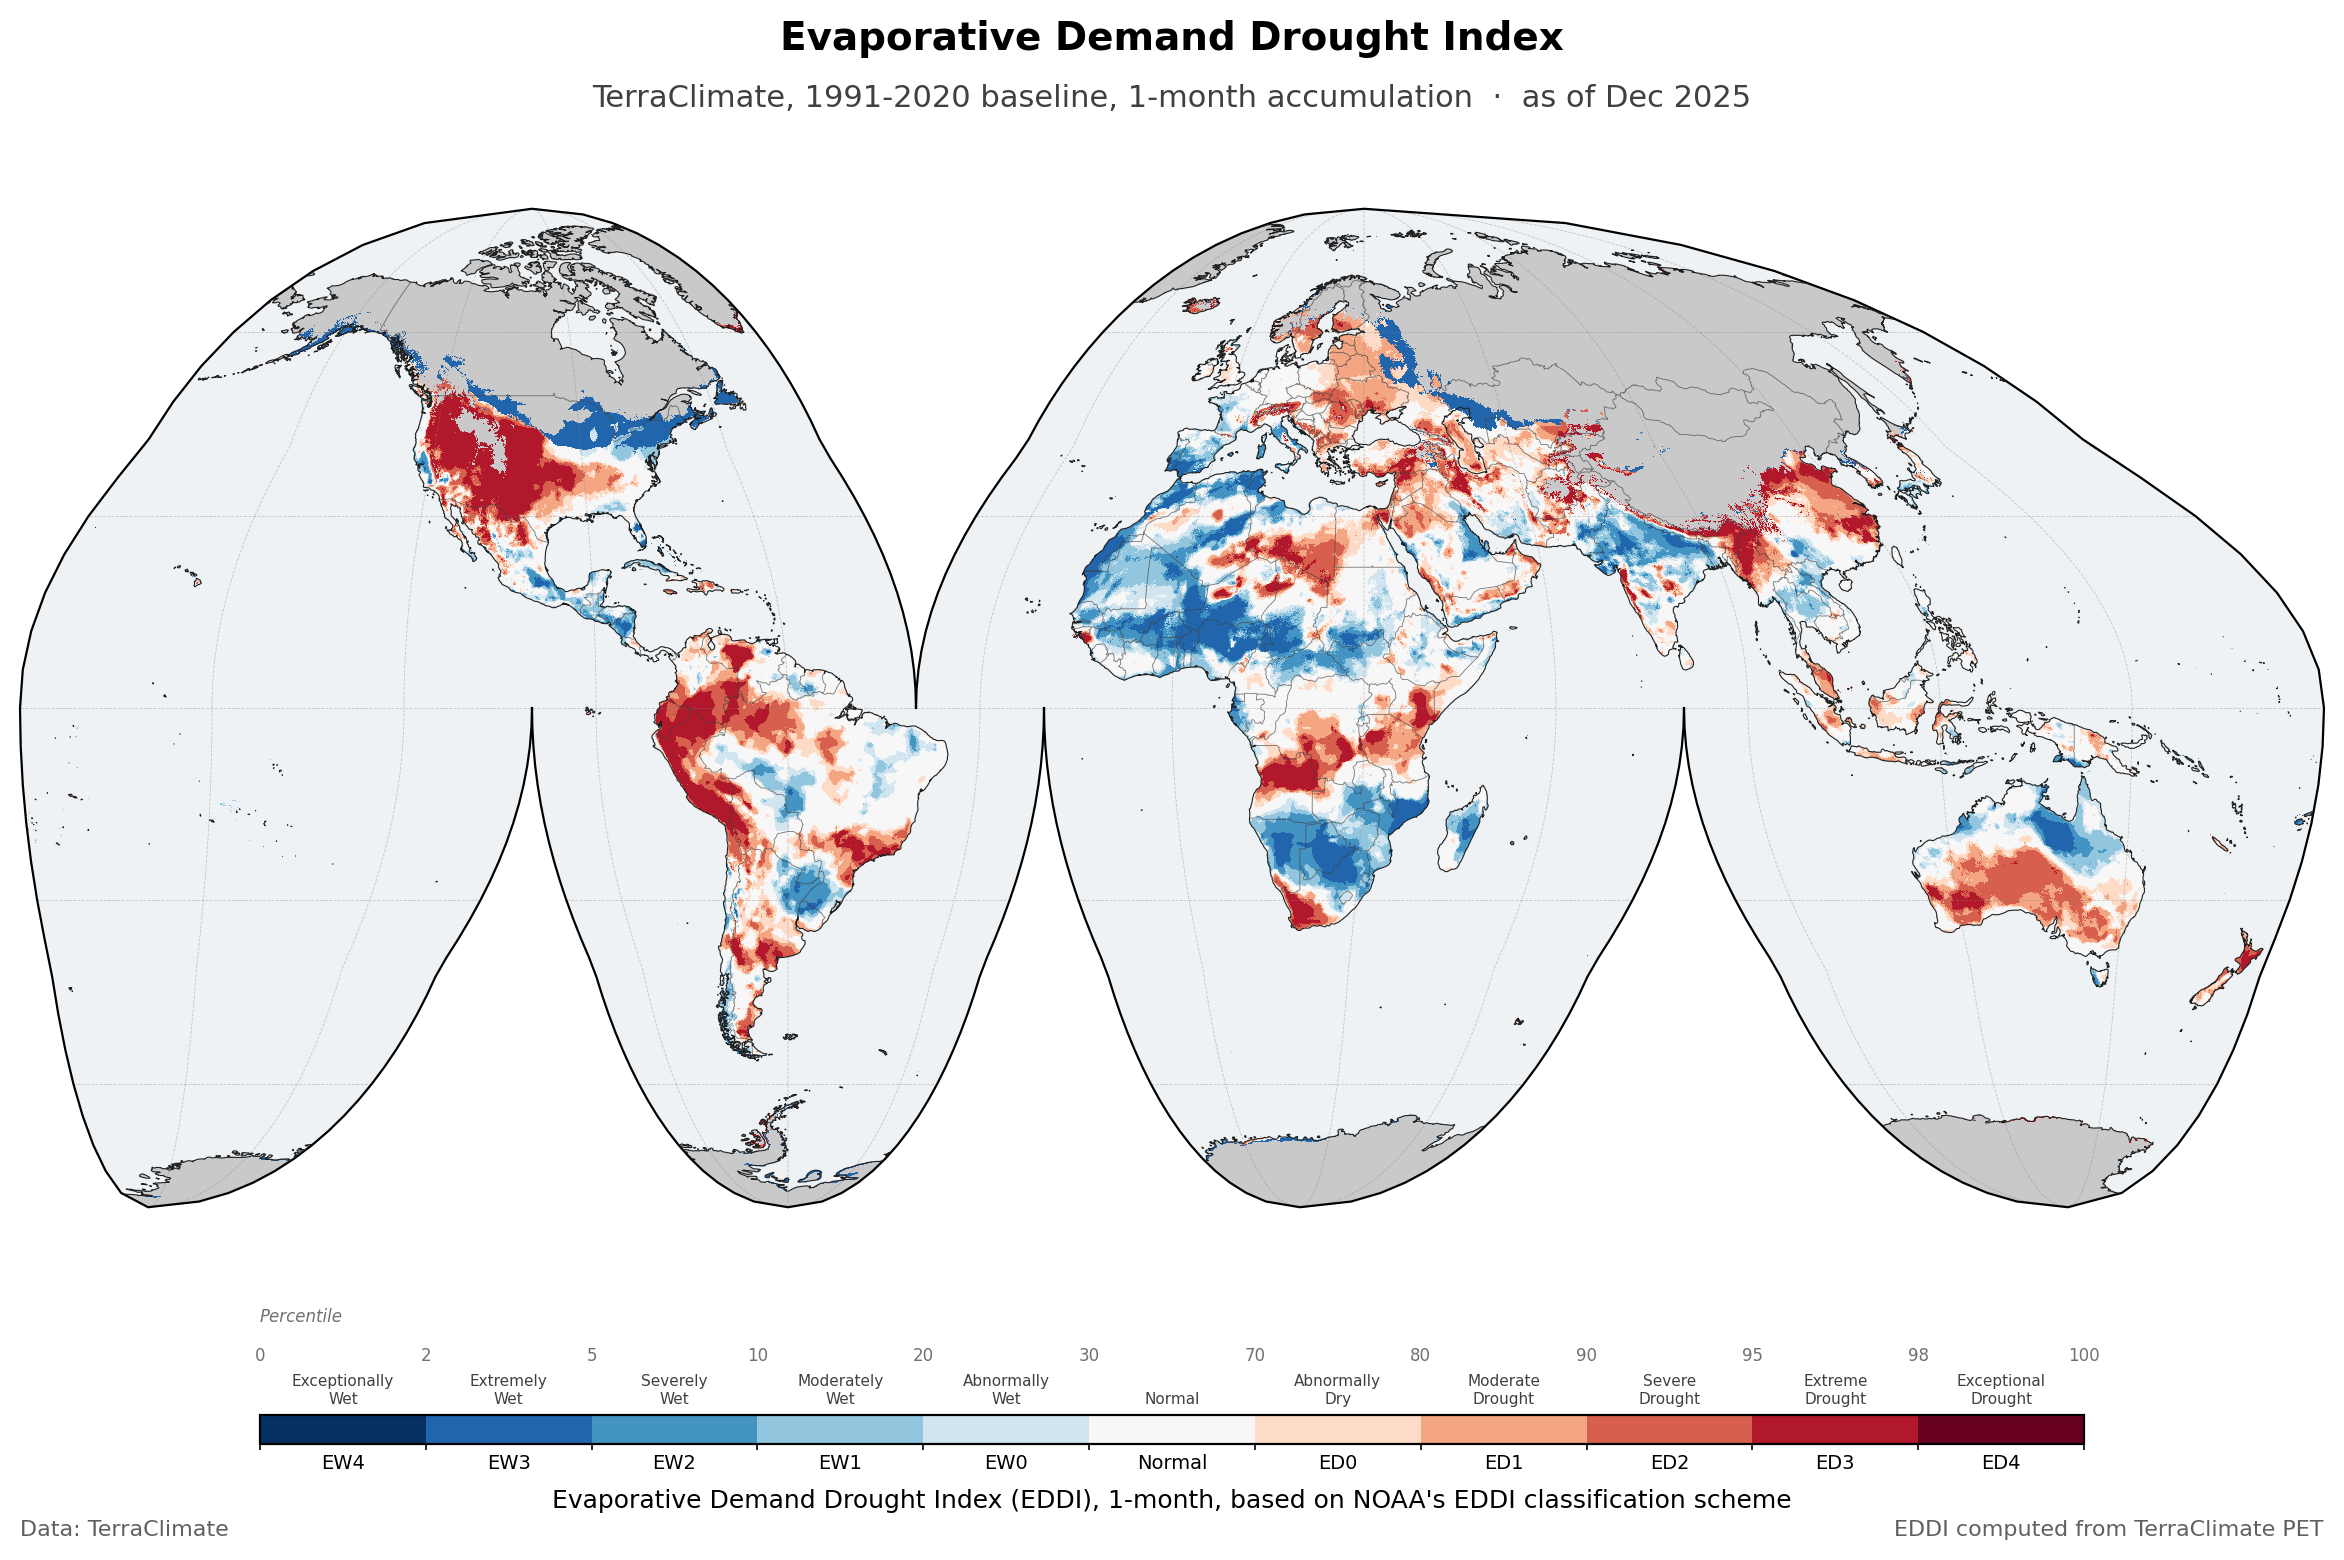
The Evaporative Demand Drought Index over the global land surface, monthly, at about 4 km, from 1950 to 2025. EDDI asks how thirsty the atmosphere is, not how much rain fell. It ranks accumulated reference evapotranspiration against the same calendar month in a baseline period, so a high value means the air has been pulling harder at the surface than usual. That makes it an early signal: evaporative demand climbs before soil moisture falls, often before a rainfall index has anything to report. Four accumulation periods are published, from 1 to 12 months.
Method
EDDI is computed from a single TerraClimate v1.1 variable, reference evapotranspiration (pet). For each pixel and each accumulation length, the trailing n-month sum is ranked against the same calendar month across the baseline period, and that rank becomes a non-exceedance probability. The baseline is 1991 to 2020, the WMO thirty-year normal.
There is no fitted distribution. Unlike SPI and SPEI, which fit a gamma or a Pearson Type III and then read the index off the fitted curve, EDDI is nonparametric: it is a rank, converted to a percentile. That is the method’s strength, because nothing has to be assumed about the shape of the distribution, and it is also the source of the limit described two sections below.
What is in the file
Three variables, all exact functions of one another, so use whichever suits your workflow.
| Variable | What it holds |
|---|---|
eddi |
The standardised anomaly, a z-score. Positive means higher evaporative demand than normal, so drier |
eddi_pct |
The non-exceedance percentile, 0 to 100. 100 is the driest, 0 the wettest |
eddi_cat |
The NOAA class, an integer 0 to 10 |
The classes in eddi_cat follow the EDDI User Guide, and the percentile cut points travel with the file in the percentile_bounds attribute.
| Class | Category | Code | Percentile | Hex | RGB |
|---|---|---|---|---|---|
| 0 | Exceptionally Wet | EW4 |
0 to 2 | #053061 |
rgb(5, 48, 97) |
| 1 | Extremely Wet | EW3 |
2 to 5 | #2166ac |
rgb(33, 102, 172) |
| 2 | Severely Wet | EW2 |
5 to 10 | #4393c3 |
rgb(67, 147, 195) |
| 3 | Moderately Wet | EW1 |
10 to 20 | #92c5de |
rgb(146, 197, 222) |
| 4 | Abnormally Wet | EW0 |
20 to 30 | #d1e5f0 |
rgb(209, 229, 240) |
| 5 | Normal | Normal |
30 to 70 | #f7f7f7 |
rgb(247, 247, 247) |
| 6 | Abnormally Dry | ED0 |
70 to 80 | #fddbc7 |
rgb(253, 219, 199) |
| 7 | Moderate Drought | ED1 |
80 to 90 | #f4a582 |
rgb(244, 165, 130) |
| 8 | Severe Drought | ED2 |
90 to 95 | #d6604d |
rgb(214, 96, 77) |
| 9 | Extreme Drought | ED3 |
95 to 98 | #b2182b |
rgb(178, 24, 43) |
| 10 | Exceptional Drought | ED4 |
98 to 100 | #67001f |
rgb(103, 0, 31) |
Note which end is which. EDDI runs the opposite way to SPI and SPEI: a high EDDI is dry, because it means high evaporative demand. The map above uses a diverging red to blue ramp with red at the dry end, so the colours read the same way round as on the other two pages even though the index underneath does not.
On the 1991 to 2020 baseline, the two outermost classes never appear
EW4 and ED4 are defined in the file and drawn in the legend, and in the 1991 to 2020 files neither is ever populated. Not rarely: never. Across the whole grid from 1991 to 2025, some 80 million valid cell-months, the count for class 0 is zero and the count for class 10 is zero. The other nine are all well populated.
This is arithmetic rather than a bug, and it is a property of the baseline, not of EDDI. Thirty years gives thirty samples per calendar month, so the finest percentile step a rank can resolve is roughly one in thirty-one, about 3.2 percent. EW4 spans 2 percent and ED4 spans 2 percent, so neither bin is wide enough to catch a rank.
The file states the same limit in its own attainable_range attribute, which caps the index at plus or minus 2.028. That is worth converting: a z-score of 2.028 is the 97.87th percentile, and 97.87 never reaches the 98 where ED4 begins. The attribute predicts the empty class before you count anything.
So on the 1991 to 2020 baseline, read ED3 as the top of the scale rather than as one step below an unreached extreme.
A longer baseline lifts the ceiling, which is what the full-climatology files are for. Fitted against the whole 1950 to 2025 record, they have seventy-six samples per calendar month, which resolve to about 1.3 percent, inside the 2 percent bins at both ends. Their attainable_range rises to plus or minus 2.382, the 99.14th percentile, and the extremes do fill: counted over 1991 to 2025, EW4 holds 0.71 percent of valid cell-months and ED4 holds 1.74 percent.
The two are published side by side rather than one replacing the other, because they answer different questions. The 1991 to 2020 normal is the WMO reference period and the right choice when the number has to be comparable with other operational products. The full climatology is the one to reach for when the tails are the point, at the cost of a baseline that is no longer a standard thirty-year normal and that includes the warming trend it is measuring against.
Coverage moves with the season
EDDI is undefined where evaporative demand is effectively zero, which in practice means the high-latitude winter. Coverage is therefore not constant through the year: about 13 percent of the global grid carries a value in December 2025, against about 24 percent in July 2025.
Almost all of that swing is in the northern extratropics. Between 60N and 90N the count of valid cells goes from roughly 1,700 in December to 56,500 in July on the quarter-degree grid, while the band from the equator to 30N barely moves, 50,288 against 50,529. So a global count of drought-classified pixels is not comparable from one month to the next, though a given pixel compared against its own calendar month is.
Limitations inherited from TerraClimate
The two sections above are limits of the index as computed here. These are limits of the source, and they pass straight through, because nothing in the ranking removes them. The TerraClimate page carries the full list; these are the ones that bear on EDDI.
Trends are not independent evidence. Long-term trends in TerraClimate are inherited from its parent datasets, so a trend found in this EDDI record is a trend in those parents, re-expressed. It is not separate confirmation of them. This is the one to hold on to, because an index built to measure anomalies invites exactly that misreading.
Apparent detail exceeds real detail. The grid is about 4 km, but TerraClimate cannot resolve temporal variability finer than its parent datasets, and orographic ratios and inversions in particular are not captured. A sharp gradient across a mountain range may be an artefact of downscaling rather than a signal.
The evaporative demand model is simple. It uses a static reference landcover and does not account for heterogeneity in vegetation. EDDI is computed from reference evapotranspiration and nothing else, so this one applies to the whole product rather than to one input among several.
Validation is thin where stations are thin. TerraClimate reports limited validation in data-sparse regions, Antarctica among them. The map above draws Antarctica because the grid extends there, not because the value is trustworthy. The same caution covers high-elevation boreal systems, where winter inversions inherited from WorldClim v2.1 are likely extrapolated unrealistically, and that is the same place where seasonal coverage is thinnest.
One version, back to 1950
The record starts in 1950 because that is where TerraClimate v1.1 starts. The original TerraClimate was built on the JRA-55 reanalysis and covered 1958 onward; v1.1 replaced that with monthly anomalies from ERA5 laid over WorldClim climatologies, and that is what carries it back to 1950.
A single version is used throughout, and there is a measured reason to insist on it. TerraClimate advises against mixing v1.0 with v1.1. An earlier trial run did exactly that, joining v1.1 for 1950 to 1957 onto v1.0 from 1958, and the spread of the EDDI z-score broke at the join. On the full v1.1 record the break is gone:
| Years | Trial run, v1.1 joined to v1.0 | Full v1.1 record |
|---|---|---|
| 1950 to 1957 | 1.22 to 1.28 | 1.05 to 1.12 |
| 1958 to 1966 | 0.98 to 1.06 | 0.98 to 1.07 |
In the trial run the earlier block carried about a quarter more spread, with the step landing exactly on 1958. On the full record the two ranges overlap, and 1957 and 1958 sit at 1.047 and 1.056. A discontinuity like the first is invisible on any single map and fatal to a trend, because a trend fitted across the join partly measures the join.
Two things about the first year. TerraClimate cautions that 1950 may be affected by water balance model spin-up, but that concerns the model’s storage outputs, such as soil moisture and runoff, and reference evapotranspiration is computed from the climate variables rather than carried forward. The output agrees: 1950 has a standard deviation of 1.106, inside the 1951 to 1957 range, and a mean of -0.39, level with 1956. Separately, an accumulation needs its full window before it can produce a value, so each timescale starts late by its own length. The first values fall in January 1950 for the 1-month files, March for 3-month, June for 6-month and December for 12-month.
Reading the time axis
Every time step is stamped on the first of the month: 1950-01-01, 1950-02-01, and so on through 2025-12-01.
The day is there because a netCDF time coordinate has to be a complete date. It is not a claim about the first of the month. These are monthly values, each one covering its whole month, so 2025-12-01 means December 2025 and nothing narrower.
In practice: slice on the year and month and ignore the day. If your tooling wants an exact match, either select with method="nearest" or group by month rather than indexing on a literal date.
Download
Each accumulation period is a separate netCDF covering the full 1950 to 2025 record, with all three variables inside. Every file also comes in a quarter-degree version, resampled from the same computation: at roughly a fifteenth of the size it is the more practical download for continental or global work, and the one to start with if you only want to look around.
The filename carries the baseline, so base1991_2020 and base1950_2025 files can sit in the same directory without colliding.
Baseline 1991 to 2020, the WMO normal
Native resolution, about 4 km.
| Timescale | File | Size |
|---|---|---|
| 1 month | wld_cli_terraclimate_eddi_01month_1950_2025_base1991_2020.nc |
7.23 GB |
| 3 month | wld_cli_terraclimate_eddi_03month_1950_2025_base1991_2020.nc |
7.51 GB |
| 6 month | wld_cli_terraclimate_eddi_06month_1950_2025_base1991_2020.nc |
7.88 GB |
| 12 month | wld_cli_terraclimate_eddi_12month_1950_2025_base1991_2020.nc |
7.05 GB |
Quarter degree.
| Timescale | File | Size |
|---|---|---|
| 1 month | wld_cli_terraclimate_eddi_01month_1950_2025_base1991_2020_025deg.nc |
476.4 MB |
| 3 month | wld_cli_terraclimate_eddi_03month_1950_2025_base1991_2020_025deg.nc |
507.5 MB |
| 6 month | wld_cli_terraclimate_eddi_06month_1950_2025_base1991_2020_025deg.nc |
532.9 MB |
| 12 month | wld_cli_terraclimate_eddi_12month_1950_2025_base1991_2020_025deg.nc |
474.7 MB |
Baseline 1950 to 2025, the full climatology
This is the variant that reaches all eleven classes, for the reason set out above. Same four accumulation periods, same two resolutions, same three variables inside each file.
Native resolution, about 4 km.
| Timescale | File | Size |
|---|---|---|
| 1 month | wld_cli_terraclimate_eddi_01month_1950_2025_base1950_2025.nc |
9.66 GB |
| 3 month | wld_cli_terraclimate_eddi_03month_1950_2025_base1950_2025.nc |
10.05 GB |
| 6 month | wld_cli_terraclimate_eddi_06month_1950_2025_base1950_2025.nc |
10.57 GB |
| 12 month | wld_cli_terraclimate_eddi_12month_1950_2025_base1950_2025.nc |
9.66 GB |
Quarter degree.
| Timescale | File | Size |
|---|---|---|
| 1 month | wld_cli_terraclimate_eddi_01month_1950_2025_base1950_2025_025deg.nc |
595.6 MB |
| 3 month | wld_cli_terraclimate_eddi_03month_1950_2025_base1950_2025_025deg.nc |
653.1 MB |
| 6 month | wld_cli_terraclimate_eddi_06month_1950_2025_base1950_2025_025deg.nc |
699.3 MB |
| 12 month | wld_cli_terraclimate_eddi_12month_1950_2025_base1950_2025_025deg.nc |
629.9 MB |
License
- TerraClimate, the source data: CC0-1.0, or refer to the Climatology Lab.
- EDDI derived from TerraClimate: CC-BY-4.0. Credit this site and TerraClimate, note it if you changed anything, and otherwise do as you like with it.