Heat wave duration index
The World Meteorological Organization (WMO), defines a heat wave as five or more consecutive days of prolonged heat in which the daily maximum temperature is higher than the average maximum temperature by 5°C (9°F) or more.
To measure the heat wave index, one of recommendation of the Intergovernmental Panel on Climate Change (IPCC) was to use the heat wave duration index (HWDI). This index has been defined as as the maximum period in each year of at least 5 consecutive days where the maximum temperature is at least 5°C warmer than the daily climatology.
How-to?
To calculate the HWDI, you need to have timeseries daily maximum temperature data and tools to calculate the index. Please follow below procedure to get started.
Tools
- Windows Subsystem for Linux (WSL) - https://docs.microsoft.com/en-us/windows/wsl/install. Since Climate Data Operator (CDO) is not available for Windows, the easiest way to use it is via the WSL. If you are on Linux/macOS, then you are good to go.
- Anaconda or Miniconda
- Climate Data Operator (CDO) - https://code.mpimet.mpg.de/projects/cdo, installed using conda install -c conda-forge cdo. Please create a new environment to install CDO, just to make sure the CDO will not breaking your current python environment.
Data
- Global high resolution (30 arc sec ~ 1km) daily maximum temperature data (
tasmax), 1979 - 2016, available as 1 month data per 1 file, from CHELSA - https://chelsa-climate.org/, downloaded from https://data.isimip.org/datasets/92b05291-fbe5-4ed2-b3df-29ff0cded9f2/.
Case
California, US
Step-by-step
Lets start!
NOTE
- To follow below step, you need to download CHELSA tasmax data from above link. Total size for tasmax data is 1.2TB, please make sure you have bandwidth and unlimited data package
- Or you can proceed directly to step 2, using pre-computed result for step 1 which is available in folder 01_tasmax, with size 9.75GB.
- Also make sure you have plenty of storage. Step 2 and 3 will produce intermediate output each around 40GB, step 4 and 5 each around 80GB, step 6 around 2GB and step 7 around 430MB.
Clip global data using bounding box
for fl in ./00_chelsa_global_tasmax/*.nc; do cdo sellonlatbox,-8.3,-7.6,12.3,12.9 $fl ./01_tasmax_/usa_california_`basename $fl`; doneMerge monthly data into annual
for year in {1979..2016}; do cdo mergetime ./01_tasmax/usa_california_chelsa-w5e5v1.0_obsclim_tasmax_30arcsec_global_daily_${year}??.nc ./02_tasmax_annual/usa_california_chelsa_daily_tasmax_${year}.nc; doneDelete data who has 29th February.
According to https://code.mpimet.mpg.de/boards/2/topics/9522, dealing with leap years in climate model output has caused many scientists to stumble, since there are just about 25% February 29ths in the time series so that the sample size for February 29th is just not big enough. Therefore, remove it from the time series before analysing it.
for year in {1979..2016}; do cdo -delete,month=2,day=29 ./02_tasmax_annual/usa_california_chelsa_daily_tasmax_${year}.nc ./03_tasmax_del29feb/usa_california_chelsa_daily_tasmax_${year}.nc; donebelow script also works, using
del29dfebfor year in {1979..2016}; do cdo -del29feb ./02_tasmax_annual/usa_california_chelsa_daily_tasmax_${year}.nc ./03_tasmax_del29feb/usa_california_chelsa_daily_tasmax_${year}.nc; doneConvert Kelvin to degree Celsius and don’t forget to change the variable (here
tasmax) units, too. Combining operators:for year in {1979..2016}; do cdo -b 32 -setattribute,tasmax@units="degC" -addc,-273.15 ./03_tasmax_del29feb/usa_california_chelsa_daily_tasmax_${year}.nc ./04_tasmax_celsius/usa_california_chelsa_daily_tasmax_${year}.nc; doneMerge all nc files result from point 4 into single nc.
cdo mergetime ./04_tasmax_celsius/usa_*.nc ./05_tasmax_all/usa_california_chelsa_daily_tasmax_1979_2016.ncCalculate the mean TXnorm of daily maximum temperatures for any period used as reference
cdo ydrunmean,5,rm=c ./05_tasmax_all/usa_california_chelsa_daily_tasmax_1979_2016.nc ./06_tasmax_meanofreference/usa_california_chelsa_daily_tasmaxnorm_ref_1979_2016.ncCalculate annual heat wave duration index w.r.t mean of reference period
for year in {1979..2016}; do cdo eca_hwdi ./04_tasmax_celsius/usa_california_chelsa_daily_tasmax_${year}.nc ./06_tasmax_meanofreference/usa_california_chelsa_daily_tasmaxnorm_ref_1979_2016.nc ./07_hwdi/usa_california_chelsa_daily_hwdi_${year}.nc; done
Result
Year 2008
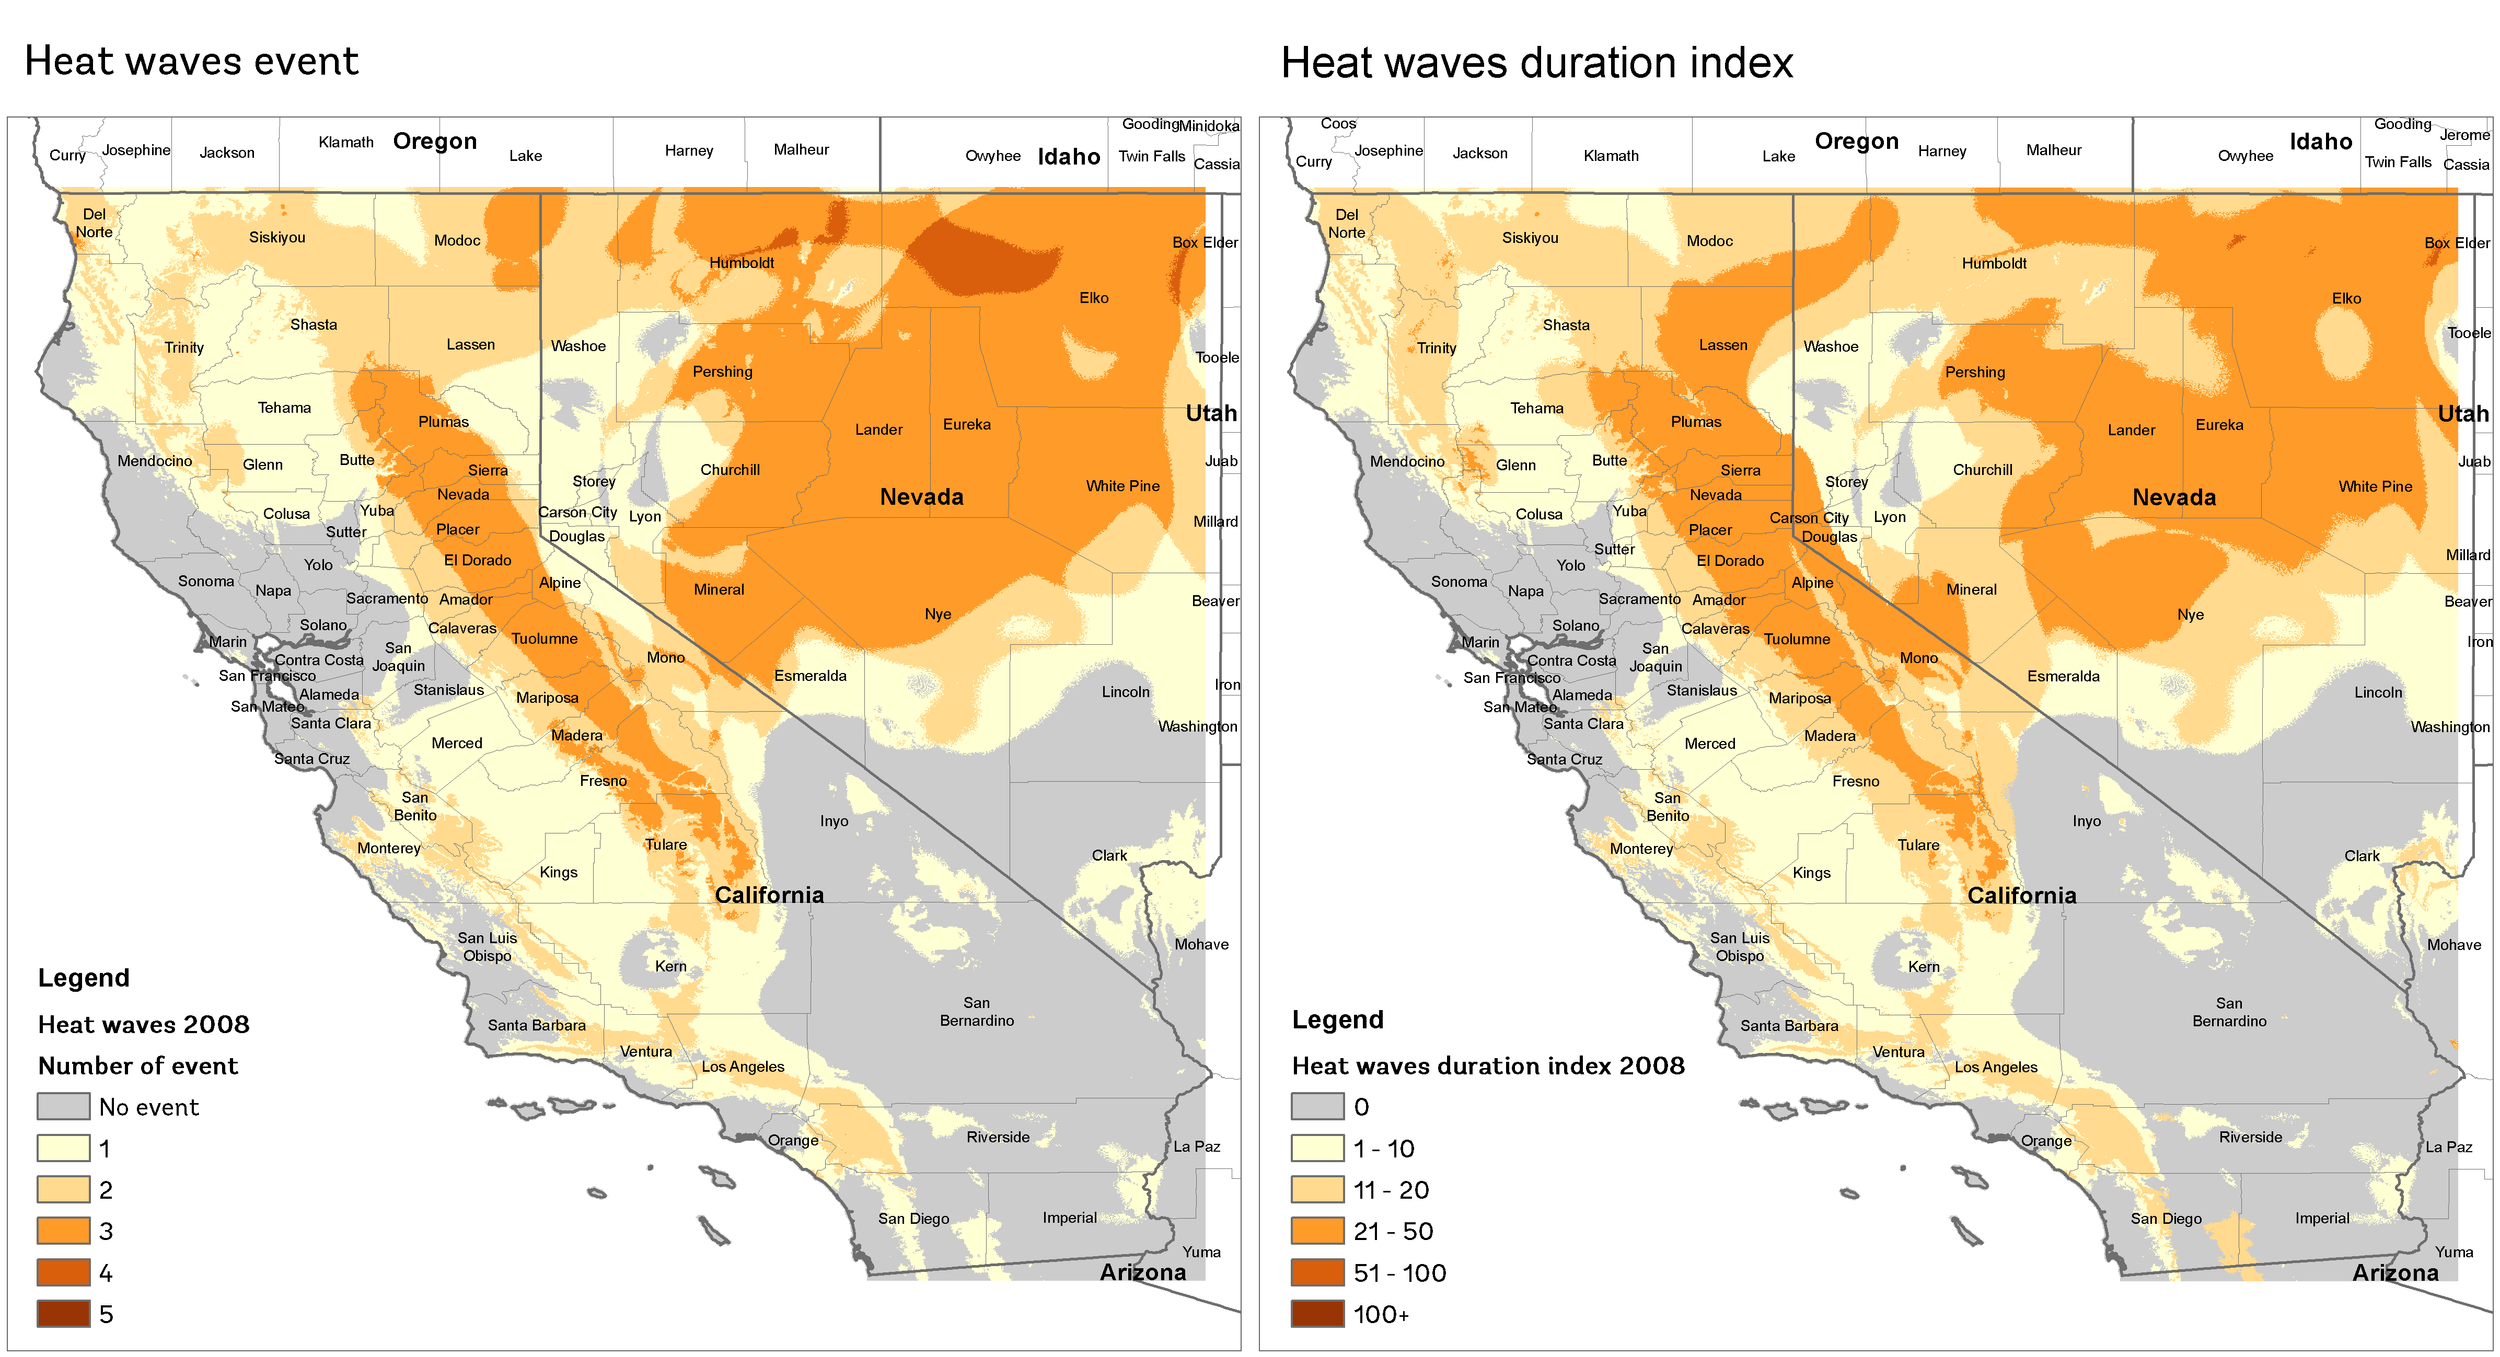
Reference:
- https://web.archive.org/web/20100915191025/https://www.usatoday.com/weather/news/2008-06-19-socal-heat-wave_N.htm
- https://www.upi.com/Top_News/2008/07/06/Heat-wave-coming-to-scorched-California/13351215345710/
Year 2013
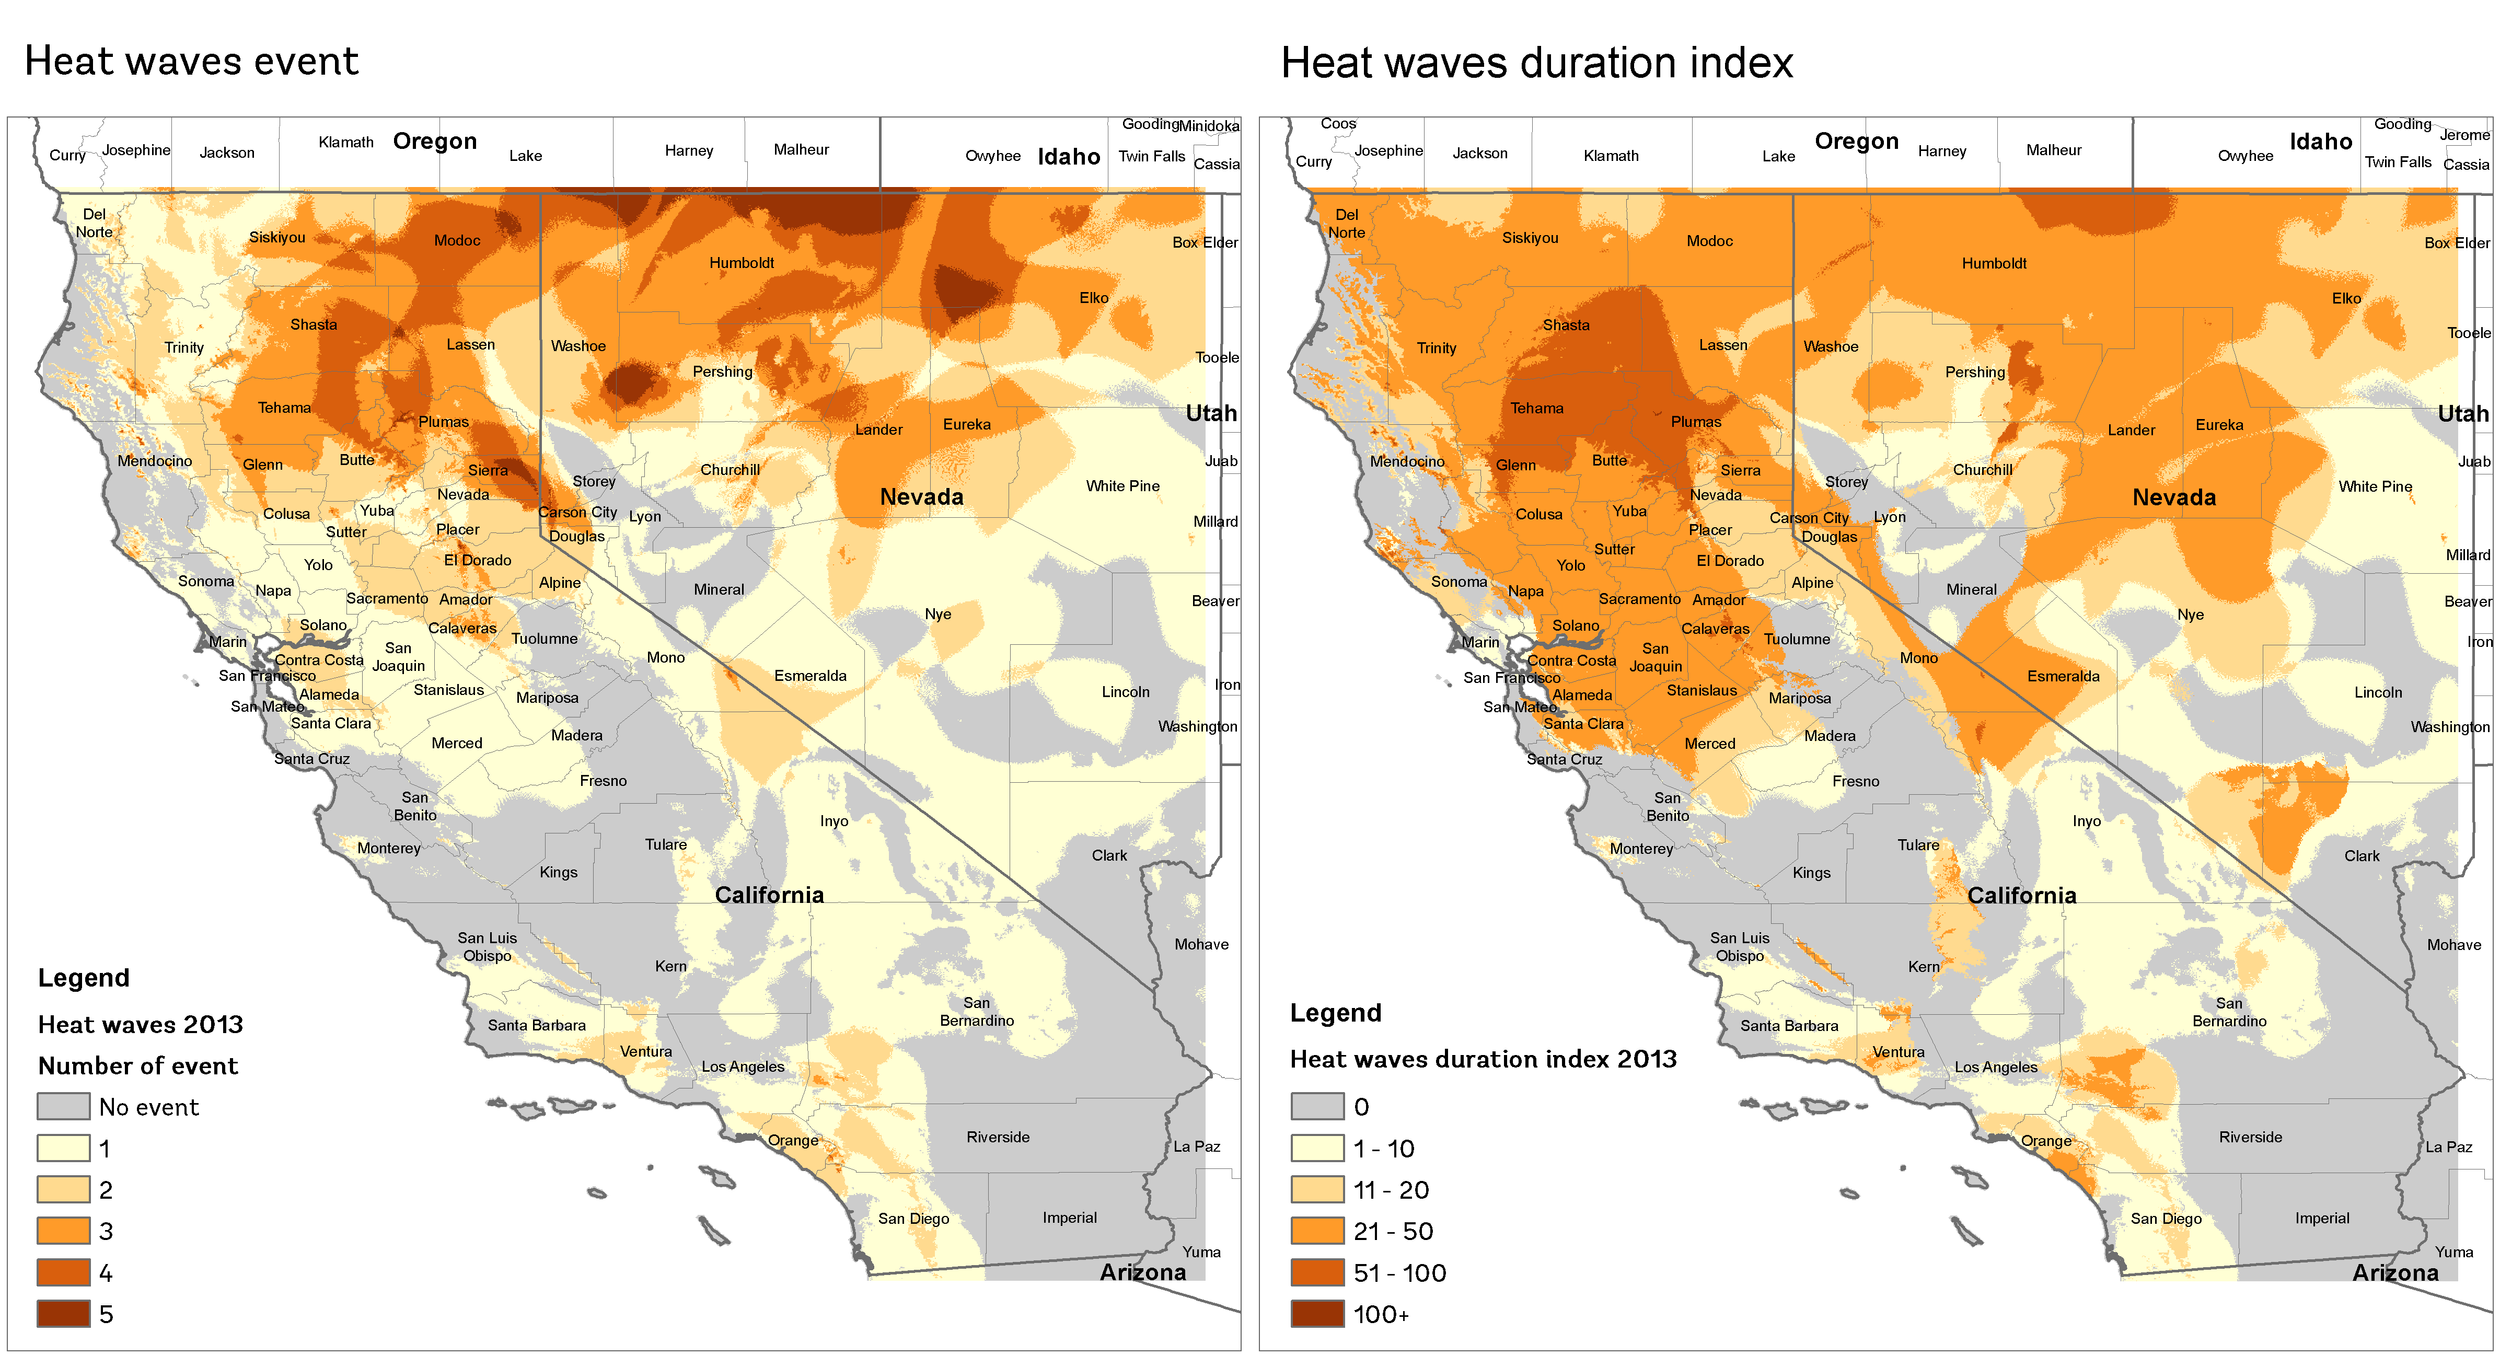
Reference:
- https://www.nbclosangeles.com/news/local/Southern-California-Heat-Wave-Record-Hot-Temperatures-213729901.html
- https://web.archive.org/web/20131105060318/http://www.wunderground.com/blog/JeffMasters/comment.html?entrynum=2451
Year 2016
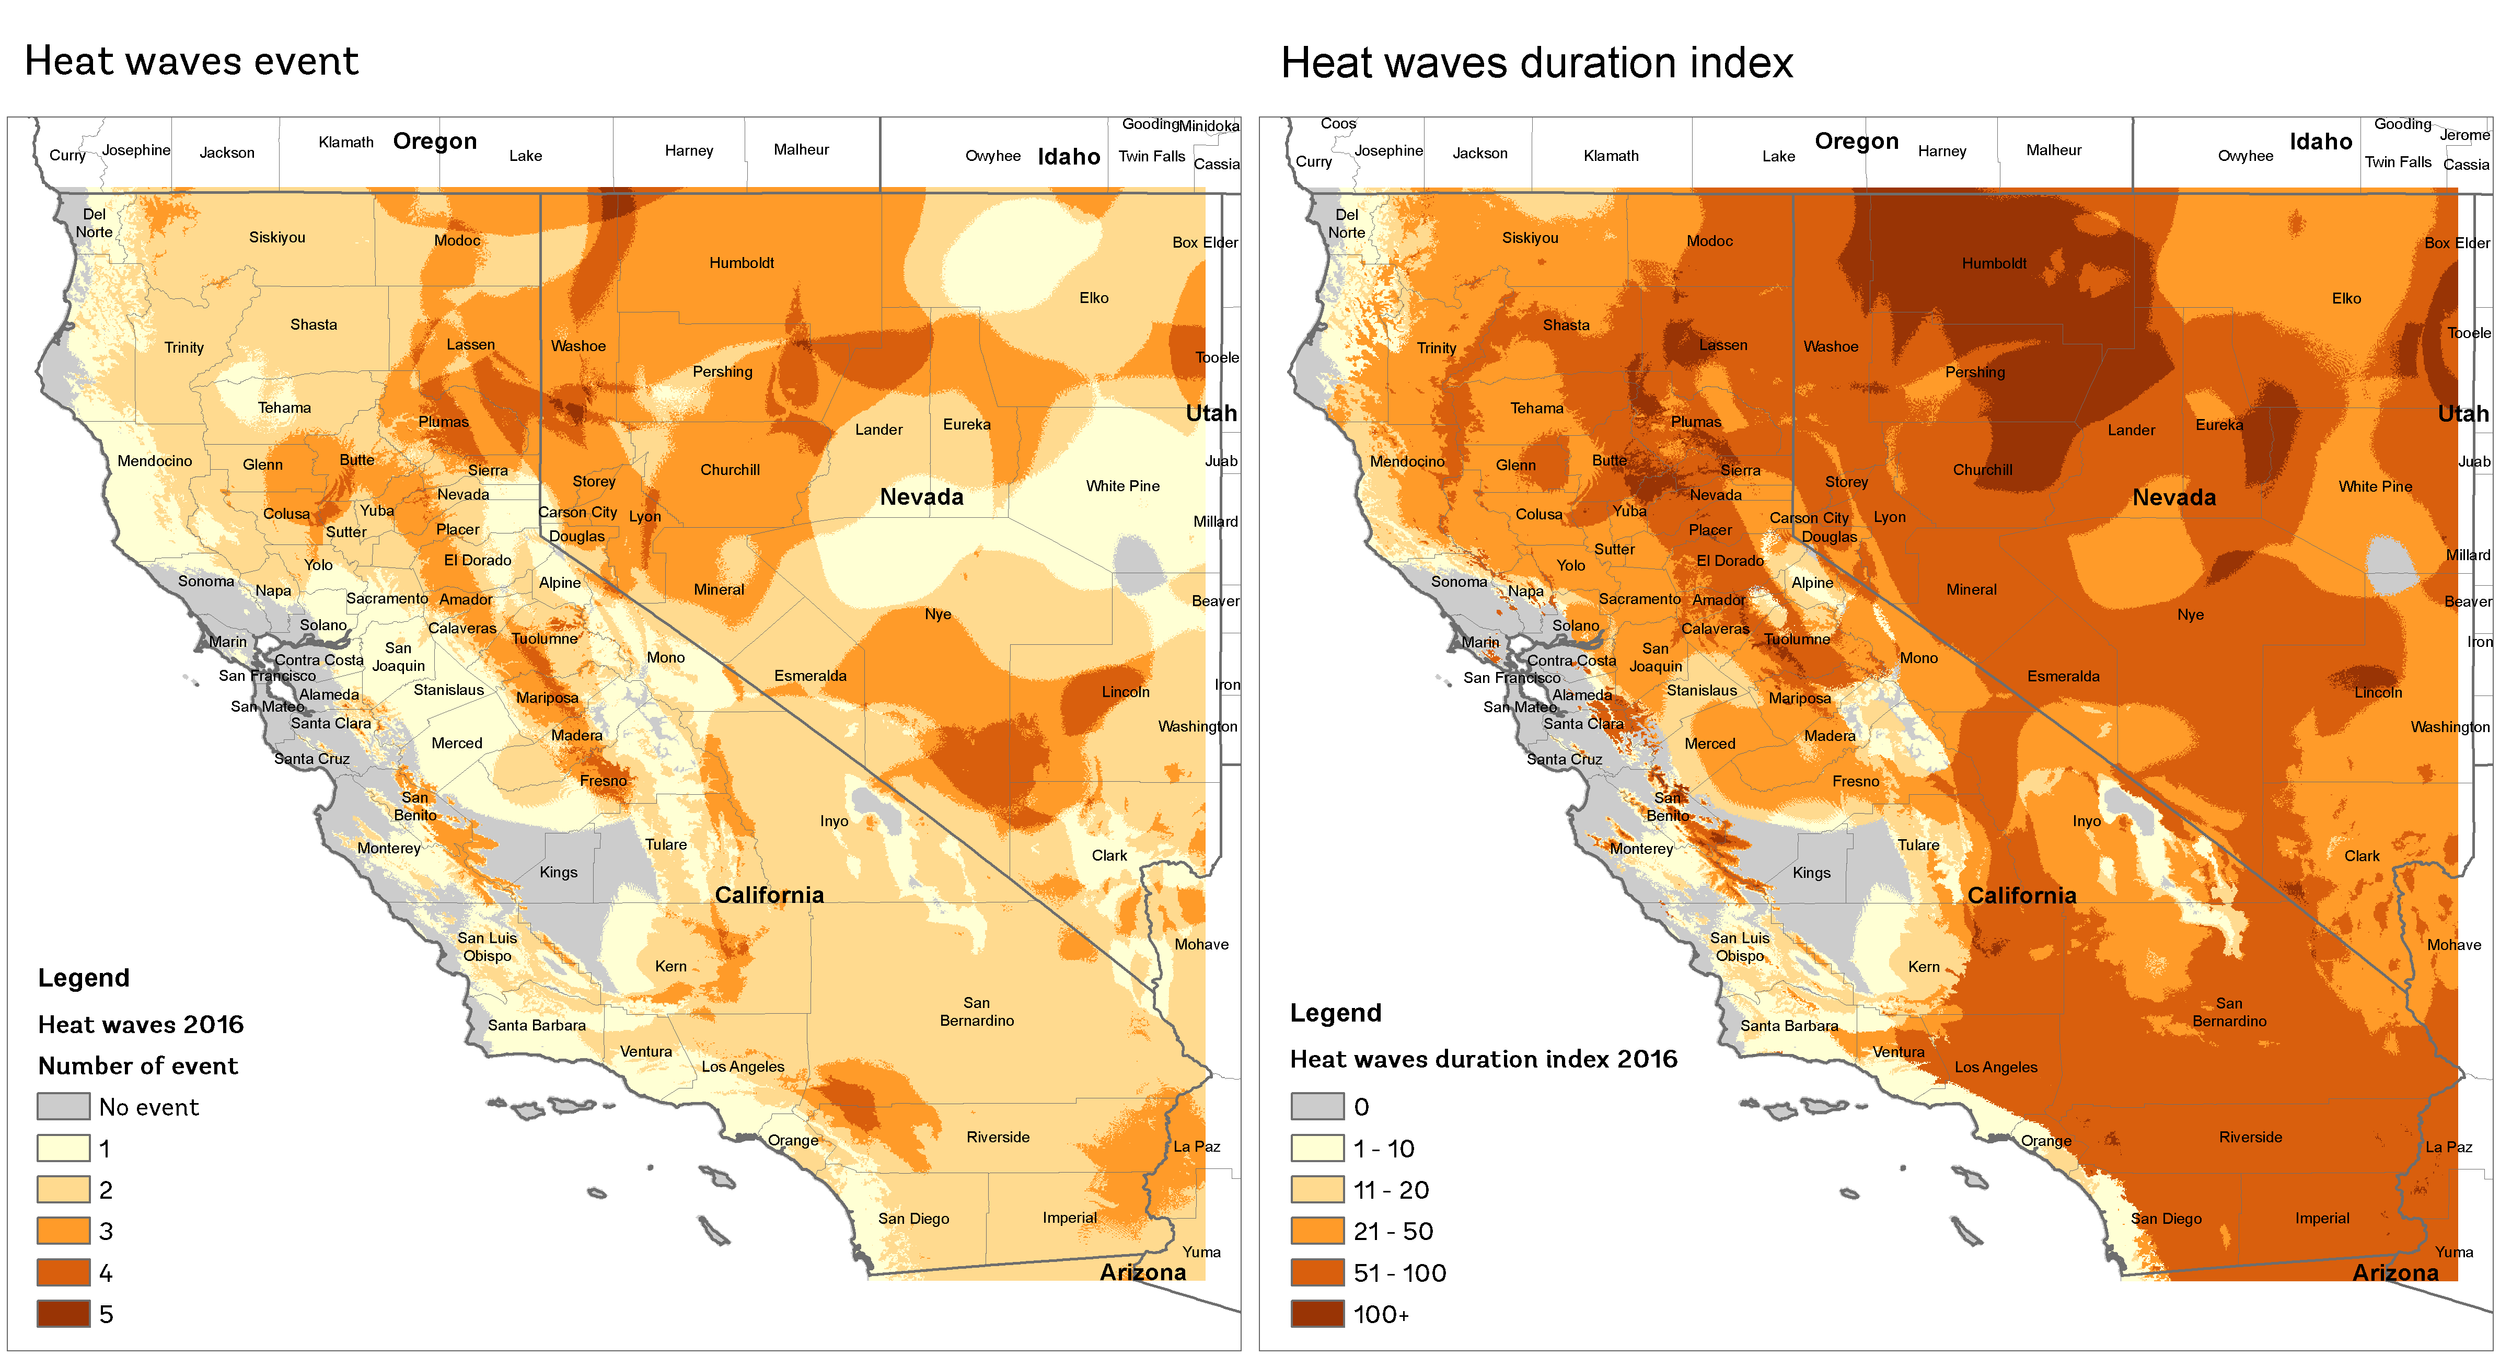
Reference:
- https://www.huffpost.com/entry/record-heat-wildfires-west-us_n_57678bb4e4b015db1bc9be59?section=
- https://web.archive.org/web/20160622004100/https://weather.com/forecast/regional/news/dangerous-record-heat-southwest-plains
- https://www.accuweather.com/en/weather-news/blistering-june-heat-fades-in-southwest-after-records-highs-top-125f-phoenix-vegas-/58322509
References
- https://www.wcrp-climate.org/etccdi
- http://etccdi.pacificclimate.org/list_27_indices.shtml
- https://code.mpimet.mpg.de/projects/cdo/embedded/cdo.pdf
- https://code.mpimet.mpg.de/projects/cdo/embedded/cdo_eca.pdf
- https://data-infrastructure-services.gitlab-pages.dkrz.de/tutorials-and-use-cases/use-case_climate-extremes-indices_cdo.html
- https://en.wikipedia.org/wiki/List_of_heat_waves
CDO operators
- sellonlatbox - Select a longitude/latitude box. https://code.mpimet.mpg.de/projects/cdo/embedded/index.html#x1-1760002.3.5
- mergetime - Merge datasets sorted by date and time. https://code.mpimet.mpg.de/projects/cdo/embedded/index.html#x1-1130002.2.8
- delete - Delete fields. https://code.mpimet.mpg.de/projects/cdo/embedded/index.html#x1-1540002.3.1
- del29feb - the special CDO operator to remove all the ‘29th of february’. This operator is not yet documented.
- addc - Add a constant. https://code.mpimet.mpg.de/projects/cdo/embedded/index.html#x1-3360002.7.3
- setattribute - Set attribute. https://code.mpimet.mpg.de/projects/cdo/embedded/index.html#x1-2380002.6.1
- ydrunmean - Multi year daily running mean. https://code.mpimet.mpg.de/projects/cdo/embedded/index.html#x1-5860002.8.37
- rm - The read_method can be set to c for circular which takes into account the last time steps at the begin of the time period and vise versa. Otherwise, the first and last time steps are not used as often as the other time steps in the calculations.
- eca_hwdi - Heat wave duration index. https://code.mpimet.mpg.de/projects/cdo/embedded/cdo_eca.pdf