Sentinel-1 modified Radar Vegetation Index
The Sentinel-1 modified Radar Vegetation Index (RVI) based on Google Earth Engine (GEE) script below originally developed by my friend Jose Manuel Delgado Blasco (Scholar, Linkedin) as part of our team (GOST) activities to support during Ukraine response last year, published as GOST Public Good’s Github repo https://github.com/worldbank/GOST_SAR/tree/master/Radar_Vegetation_Index
The original GEE script was meant to be used only for individual updates, as time progresses and the need for vegetation monitoring continually increases, I believe it’s necessary to obtain this RVI time-series data, which can be matched with monthly rainfall time-series data for monitoring food crop phenology.
For this reason, I’ve added a function to mosaic every ten days and batch downloading if the list of data is quite extensive.
All credit goes to the awesome work of Jose Manuel! Hats off to him!
[caption id=“” align=“alignnone” width=“1277”]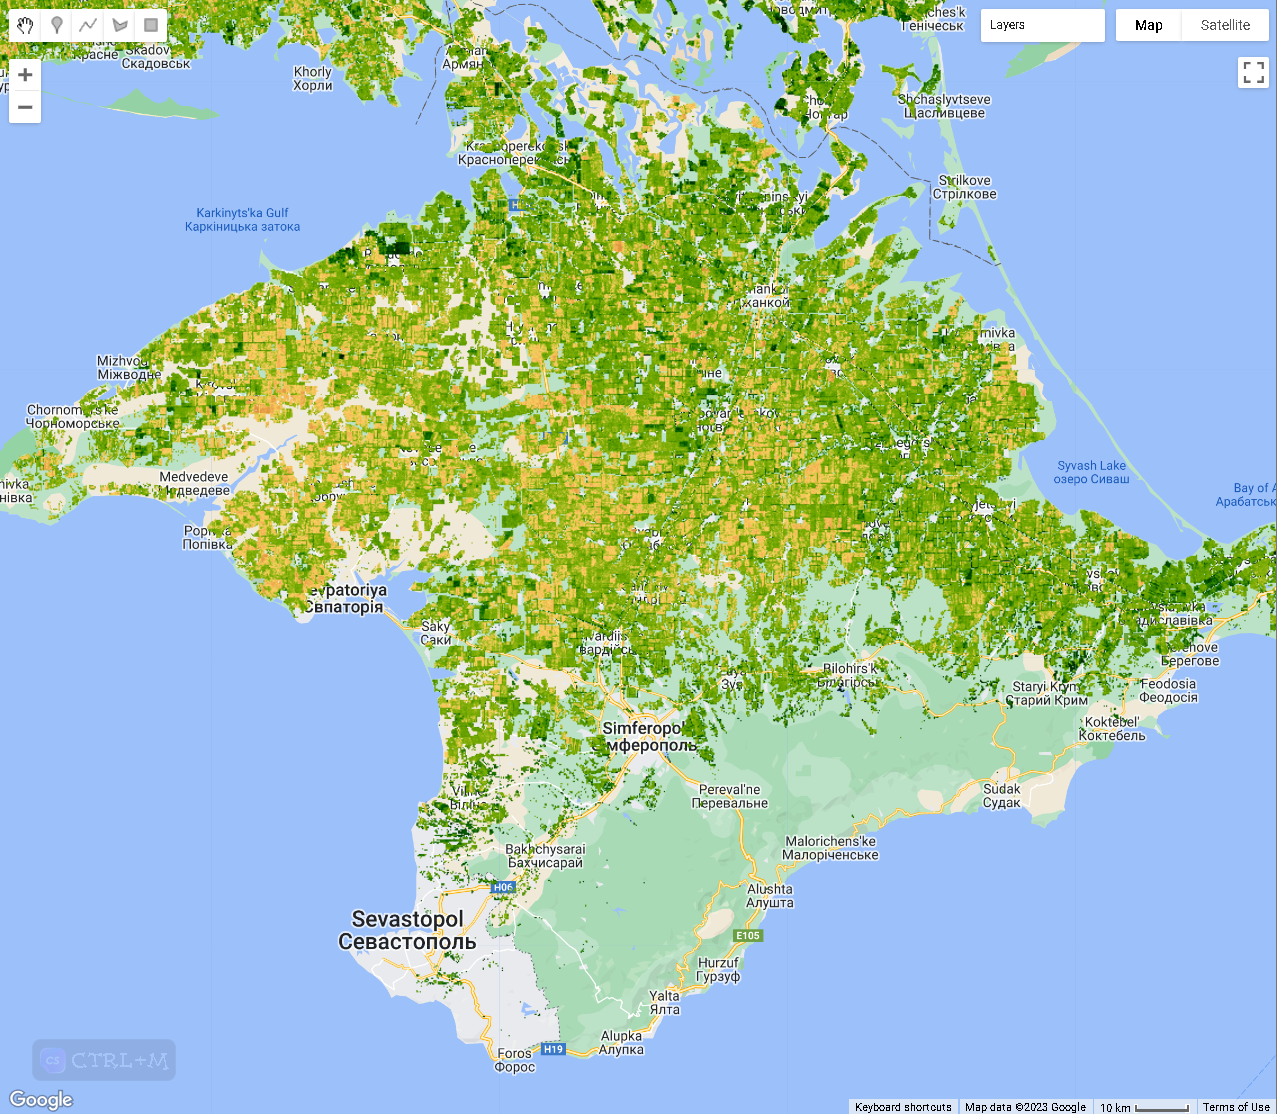 RVI in Crimean Peninsula [/caption]
Above picture is Vegetation Indices based on Sentinel-1 (generated using the GEE script), below picture is Vegetation Indices for the same period based on Sentinel-2 (generated using Climate Engine https://climengine.page.link/sZnR)
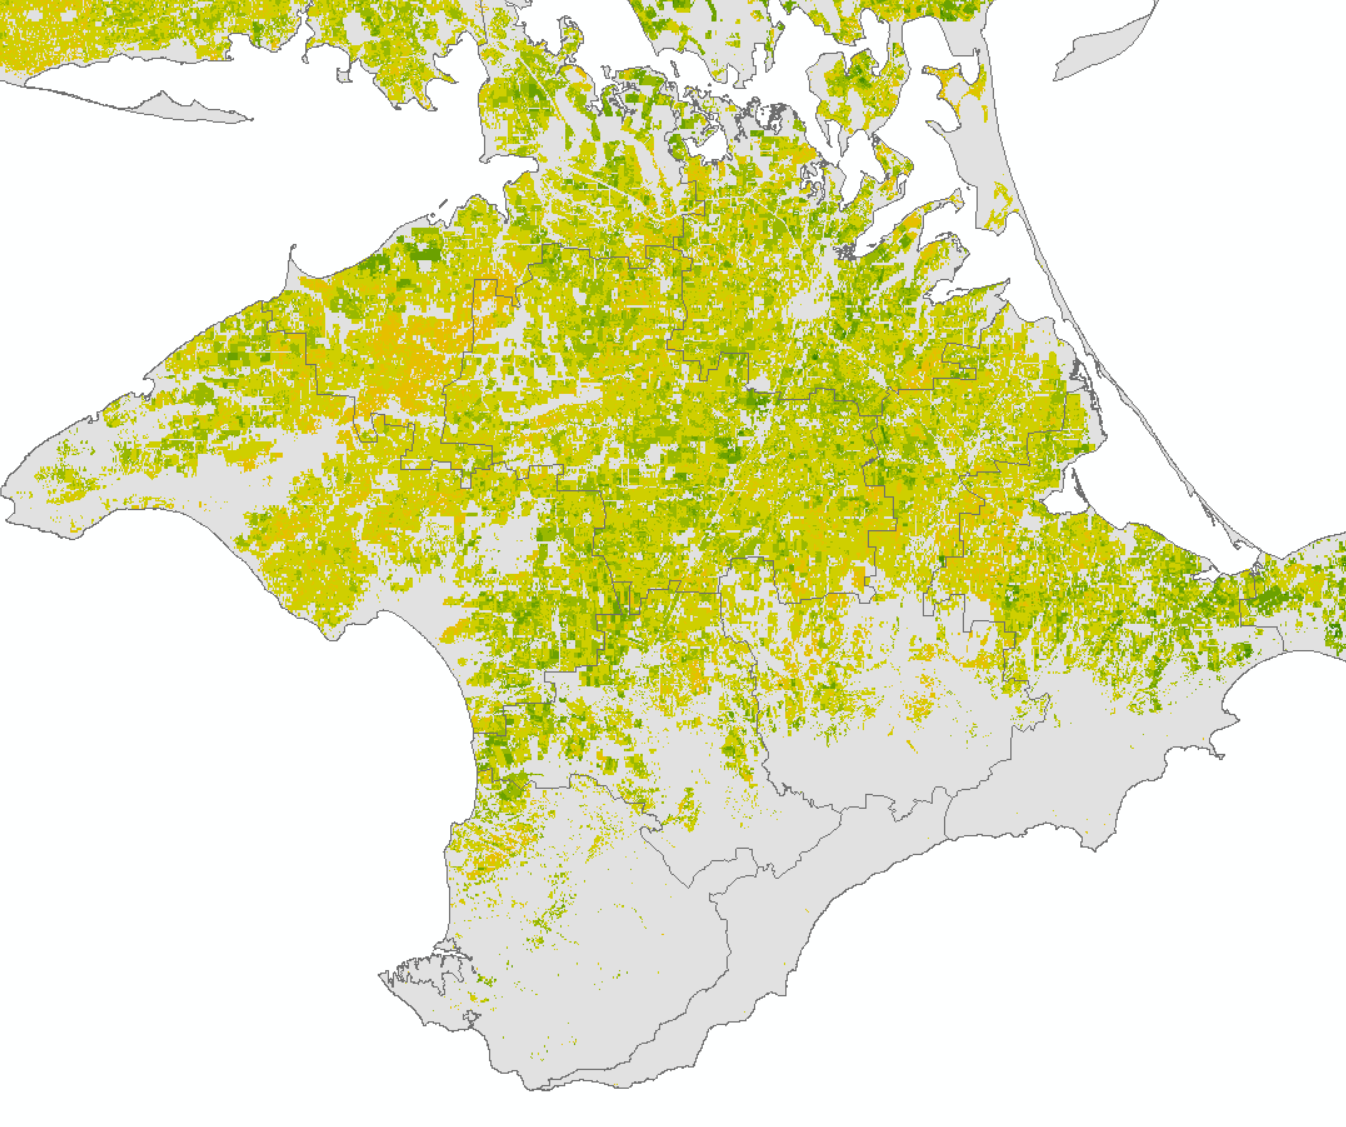
NDVI in Crimean Peninsula
Full GEE code is here: https://code.earthengine.google.com/62f799954525c997629cefdd435c500e
Back to top